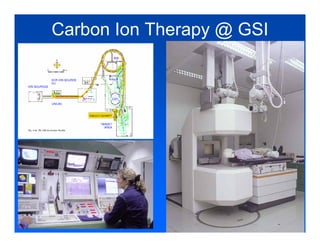
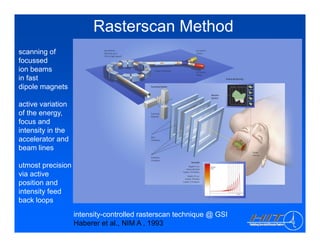
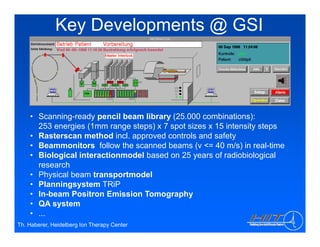
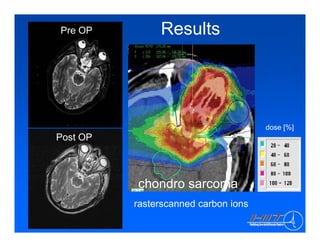
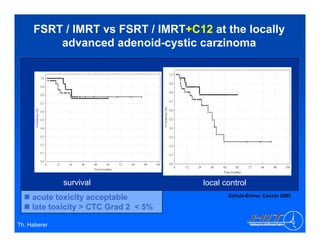
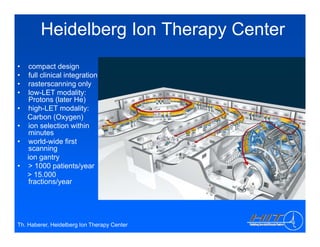
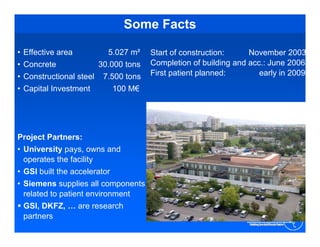
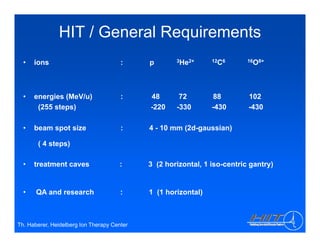
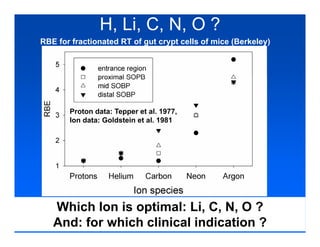
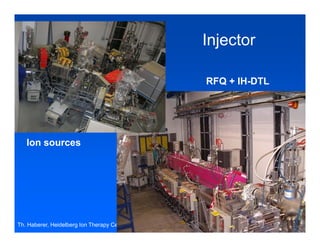
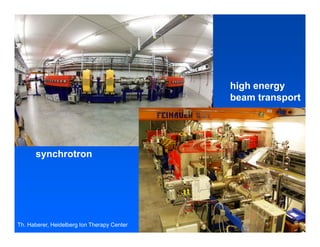
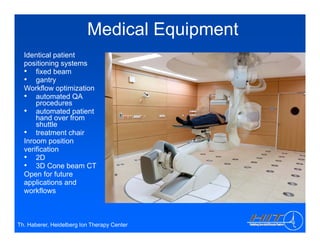
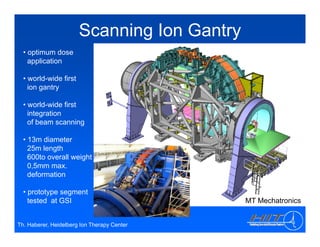
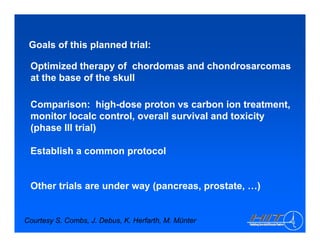
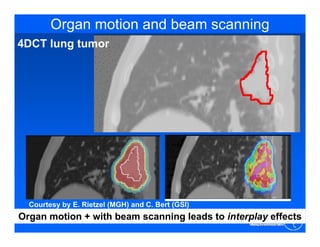
The document discusses ion beam therapy and the Heidelberg Ion Therapy Center. Some key points:
1) The Heidelberg Ion Therapy Center will provide carbon and proton ion beam therapy using raster scanning technology for precise dose delivery.
2) Clinical studies are underway to evaluate the effectiveness of carbon ion therapy for various cancers and determine optimal treatment protocols.
3) The center is scheduled to treat its first patient in early 2009 and will have the capacity to treat over 1,000 patients per year.
Particle beam – proton,neutron & heavy ion therapyAswathi c p
particle therapy is advanced external beam therapy used to treat cancer , which uses beams of protons or other charged particles such as helium, carbon or other ions instead of photons. charged particles have different depth-dose distributions compared to photons. They deposit most of their energy in the last final millimeters of their trajectory (when their speed slows). This results in a sharp and localized peak of dose, known as the Bragg peak.
(October 12, 2021) Webinar: Clinical Field MRI As A Measurement Instrument fo...Scintica Instrumentation
Watch our webinar where Professor Marc-Andre Fortin presented about the 3D printing of hydrogels and hydrated substances that have been introduced in various fields of biomedical research including regenerative medicine, cosmetic surgery, orthopedics, and medical physics.
However, one of the main challenges faced by 3D printing and bioprinting is geometrical conformity. In this presentation, studies requiring hydrogel 3D printing in the fields of ophthalmology, regenerative medicine, and medical physics, were described. MRI scanning procedures were developed and optimized for these specific applications.
The presentation highlighted the potential role of MRI in the development of more accurate, more precise 3D-printed hydrogel objects.
Dual energy CT in radiotherapy: Current applications and future outlookWookjin Choi
Dual energy CT in radiotherapy: Current applications and future outlook
Wouter van Elmpt, Guillaume Landry, Marco Das, Frank Verhaegen
Department of Radiation Oncology (MAASTRO), GROW – School for Oncology and Developmental Biology, Maastricht University Medical Centre, The Netherlands; Department of Medical Physics, Faculty of Physics, Ludwig-Maximilians-Universität München, Garching b. München, Germany; Department of Radiology, GROW – School for Oncology and Developmental Biology, Maastricht University Medical Centre, The Netherlands; and Medical Physics Unit, Department of Oncology, McGill University, Montréal, Canada
Diagnostic Reference Level in Lumbar Radiography in Abidjan, Côte d’ivoiretheijes
This study aims to determine the diagnostic reference levels (DRLs) for posterior-anterior lumbar and profile lumbar examinations in order to optimize the entrance dose (De) and the dose area product (DAP) of patient in Abidjan. A total of 240 patients undergoing conventional radiology in four hospitals of the city were considered. The device used to measure De and DAP values is a DAP-meter, model Diamentor M4 KDK and of type 11017. The DRLs in terms of De and DAP values were determined by applying the 75th percentile method. These values were compared to DRLs values obtained in other countries and to those recommended by international institutions. The values of De measured are encouraging, however for the DAP; many efforts are needed to be made to reduce the DRLs values
The SuperArgus state-of-the-art preclinical PET/CT system: An overview of the...Scintica Instrumentation
These systems are ideally suited for pre-clinical imaging of small animals such as mice and rats, all the way up to medium sized animals such as rabbits, non-human primates and other similarly sized animals. Some of the unique imaging capabilities include real-time imaging of awake animals, as well as multiplexed PET imaging of standard and non-standard isotopes. Key research applications and example images were reviewed.
Positron Emission Tomography (PET) is the gold standard in metabolic imaging, providing high sensitivity to specific radiotracer used to detect specific metabolic activity or biomarkers in vivo. The most common uses for PET imaging in pre-clinical research include oncology, neurobiology, cardiology, as well as dynamic imaging.
These systems are considered to be best in class imaging system with state of the art detectors and electronics. The systems have been designed to be self-shielded, requiring no additional shielding at the location selected for installation. The systems come in a three different bore sizes allowing for imaging of animals such as mice all the way up to rabbits and even non-human primates. The CT component of these systems has been optimized for reduced radiation exposure, rapid acquisition times, and high resolution images; all ideal for the longitudinal studies so commonly performed in pre-clinical research.
The SuperArgus system is uniquely designed to provide consistent resolution across the entire field of view, while maintaining sensitivity and system performance. Reconstruction algorithms have also been implemented to rapidly process and display the acquired images. The system performs very well for standard imaging applications such as oncology, cardiology, etc. Additionally, the system has some unique features which allow for some unique imaging capabilities such as real-time awake animal imaging, self-gated cardiac imaging, as well as multiplex imaging of standard and non-standard isotopes.
Title: Sense of Smell
Presenter: Dr. Faiza, Assistant Professor of Physiology
Qualifications:
MBBS (Best Graduate, AIMC Lahore)
FCPS Physiology
ICMT, CHPE, DHPE (STMU)
MPH (GC University, Faisalabad)
MBA (Virtual University of Pakistan)
Learning Objectives:
Describe the primary categories of smells and the concept of odor blindness.
Explain the structure and location of the olfactory membrane and mucosa, including the types and roles of cells involved in olfaction.
Describe the pathway and mechanisms of olfactory signal transmission from the olfactory receptors to the brain.
Illustrate the biochemical cascade triggered by odorant binding to olfactory receptors, including the role of G-proteins and second messengers in generating an action potential.
Identify different types of olfactory disorders such as anosmia, hyposmia, hyperosmia, and dysosmia, including their potential causes.
Key Topics:
Olfactory Genes:
3% of the human genome accounts for olfactory genes.
400 genes for odorant receptors.
Olfactory Membrane:
Located in the superior part of the nasal cavity.
Medially: Folds downward along the superior septum.
Laterally: Folds over the superior turbinate and upper surface of the middle turbinate.
Total surface area: 5-10 square centimeters.
Olfactory Mucosa:
Olfactory Cells: Bipolar nerve cells derived from the CNS (100 million), with 4-25 olfactory cilia per cell.
Sustentacular Cells: Produce mucus and maintain ionic and molecular environment.
Basal Cells: Replace worn-out olfactory cells with an average lifespan of 1-2 months.
Bowman’s Gland: Secretes mucus.
Stimulation of Olfactory Cells:
Odorant dissolves in mucus and attaches to receptors on olfactory cilia.
Involves a cascade effect through G-proteins and second messengers, leading to depolarization and action potential generation in the olfactory nerve.
Quality of a Good Odorant:
Small (3-20 Carbon atoms), volatile, water-soluble, and lipid-soluble.
Facilitated by odorant-binding proteins in mucus.
Membrane Potential and Action Potential:
Resting membrane potential: -55mV.
Action potential frequency in the olfactory nerve increases with odorant strength.
Adaptation Towards the Sense of Smell:
Rapid adaptation within the first second, with further slow adaptation.
Psychological adaptation greater than receptor adaptation, involving feedback inhibition from the central nervous system.
Primary Sensations of Smell:
Camphoraceous, Musky, Floral, Pepperminty, Ethereal, Pungent, Putrid.
Odor Detection Threshold:
Examples: Hydrogen sulfide (0.0005 ppm), Methyl-mercaptan (0.002 ppm).
Some toxic substances are odorless at lethal concentrations.
Characteristics of Smell:
Odor blindness for single substances due to lack of appropriate receptor protein.
Behavioral and emotional influences of smell.
Transmission of Olfactory Signals:
From olfactory cells to glomeruli in the olfactory bulb, involving lateral inhibition.
Primitive, less old, and new olfactory systems with different path
Title: Sense of Taste
Presenter: Dr. Faiza, Assistant Professor of Physiology
Qualifications:
MBBS (Best Graduate, AIMC Lahore)
FCPS Physiology
ICMT, CHPE, DHPE (STMU)
MPH (GC University, Faisalabad)
MBA (Virtual University of Pakistan)
Learning Objectives:
Describe the structure and function of taste buds.
Describe the relationship between the taste threshold and taste index of common substances.
Explain the chemical basis and signal transduction of taste perception for each type of primary taste sensation.
Recognize different abnormalities of taste perception and their causes.
Key Topics:
Significance of Taste Sensation:
Differentiation between pleasant and harmful food
Influence on behavior
Selection of food based on metabolic needs
Receptors of Taste:
Taste buds on the tongue
Influence of sense of smell, texture of food, and pain stimulation (e.g., by pepper)
Primary and Secondary Taste Sensations:
Primary taste sensations: Sweet, Sour, Salty, Bitter, Umami
Chemical basis and signal transduction mechanisms for each taste
Taste Threshold and Index:
Taste threshold values for Sweet (sucrose), Salty (NaCl), Sour (HCl), and Bitter (Quinine)
Taste index relationship: Inversely proportional to taste threshold
Taste Blindness:
Inability to taste certain substances, particularly thiourea compounds
Example: Phenylthiocarbamide
Structure and Function of Taste Buds:
Composition: Epithelial cells, Sustentacular/Supporting cells, Taste cells, Basal cells
Features: Taste pores, Taste hairs/microvilli, and Taste nerve fibers
Location of Taste Buds:
Found in papillae of the tongue (Fungiform, Circumvallate, Foliate)
Also present on the palate, tonsillar pillars, epiglottis, and proximal esophagus
Mechanism of Taste Stimulation:
Interaction of taste substances with receptors on microvilli
Signal transduction pathways for Umami, Sweet, Bitter, Sour, and Salty tastes
Taste Sensitivity and Adaptation:
Decrease in sensitivity with age
Rapid adaptation of taste sensation
Role of Saliva in Taste:
Dissolution of tastants to reach receptors
Washing away the stimulus
Taste Preferences and Aversions:
Mechanisms behind taste preference and aversion
Influence of receptors and neural pathways
Impact of Sensory Nerve Damage:
Degeneration of taste buds if the sensory nerve fiber is cut
Abnormalities of Taste Detection:
Conditions: Ageusia, Hypogeusia, Dysgeusia (parageusia)
Causes: Nerve damage, neurological disorders, infections, poor oral hygiene, adverse drug effects, deficiencies, aging, tobacco use, altered neurotransmitter levels
Neurotransmitters and Taste Threshold:
Effects of serotonin (5-HT) and norepinephrine (NE) on taste sensitivity
Supertasters:
25% of the population with heightened sensitivity to taste, especially bitterness
Increased number of fungiform papillae
These lecture slides, by Dr Sidra Arshad, offer a quick overview of the physiological basis of a normal electrocardiogram.
Learning objectives:
1. Define an electrocardiogram (ECG) and electrocardiography
2. Describe how dipoles generated by the heart produce the waveforms of the ECG
3. Describe the components of a normal electrocardiogram of a typical bipolar lead (limb II)
4. Differentiate between intervals and segments
5. Enlist some common indications for obtaining an ECG
6. Describe the flow of current around the heart during the cardiac cycle
7. Discuss the placement and polarity of the leads of electrocardiograph
8. Describe the normal electrocardiograms recorded from the limb leads and explain the physiological basis of the different records that are obtained
9. Define mean electrical vector (axis) of the heart and give the normal range
10. Define the mean QRS vector
11. Describe the axes of leads (hexagonal reference system)
12. Comprehend the vectorial analysis of the normal ECG
13. Determine the mean electrical axis of the ventricular QRS and appreciate the mean axis deviation
14. Explain the concepts of current of injury, J point, and their significance
Study Resources:
1. Chapter 11, Guyton and Hall Textbook of Medical Physiology, 14th edition
2. Chapter 9, Human Physiology - From Cells to Systems, Lauralee Sherwood, 9th edition
3. Chapter 29, Ganong’s Review of Medical Physiology, 26th edition
4. Electrocardiogram, StatPearls - https://www.ncbi.nlm.nih.gov/books/NBK549803/
5. ECG in Medical Practice by ABM Abdullah, 4th edition
6. Chapter 3, Cardiology Explained, https://www.ncbi.nlm.nih.gov/books/NBK2214/
7. ECG Basics, http://www.nataliescasebook.com/tag/e-c-g-basics
Integrating Ayurveda into Parkinson’s Management: A Holistic ApproachAyurveda ForAll
Explore the benefits of combining Ayurveda with conventional Parkinson's treatments. Learn how a holistic approach can manage symptoms, enhance well-being, and balance body energies. Discover the steps to safely integrate Ayurvedic practices into your Parkinson’s care plan, including expert guidance on diet, herbal remedies, and lifestyle modifications.
Knee anatomy and clinical tests 2024.pdfvimalpl1234
This includes all relevant anatomy and clinical tests compiled from standard textbooks, Campbell,netter etc..It is comprehensive and best suited for orthopaedicians and orthopaedic residents.
Rasamanikya is a excellent preparation in the field of Rasashastra, it is used in various Kushtha Roga, Shwasa, Vicharchika, Bhagandara, Vatarakta, and Phiranga Roga. In this article Preparation& Comparative analytical profile for both Formulationon i.e Rasamanikya prepared by Kushmanda swarasa & Churnodhaka Shodita Haratala. The study aims to provide insights into the comparative efficacy and analytical aspects of these formulations for enhanced therapeutic outcomes.
- Video recording of this lecture in English language: https://youtu.be/kqbnxVAZs-0
- Video recording of this lecture in Arabic language: https://youtu.be/SINlygW1Mpc
- Link to download the book free: https://nephrotube.blogspot.com/p/nephrotube-nephrology-books.html
- Link to NephroTube website: www.NephroTube.com
- Link to NephroTube social media accounts: https://nephrotube.blogspot.com/p/join-nephrotube-on-social-media.html
Maxilla, Mandible & Hyoid Bone & Clinical Correlations by Dr. RIG.pptx
Heidelberg Ion Therapy Center
1. The Heidelberg Ion Therapy Center
and
PARTNER
Thomas Haberer
Heidelberg Ion Therapy Center
2. Goal
The key element to improve the clinical
local control!
outcome is
entrance channel: tumour:
• low physical dose • high physical dose
• low rel biol effiency
rel. biol. • high rel biol effiency
rel. biol.
3. Standard Approach
• Facilities being built at
g
existing research
accelerators
• Fi d energy machines
Fixed hi
with moderate flexibility
(if at all)
• Dose delivery not exactly
tumor-conform
Th. Haberer, Heidelberg Ion Therapy Center
4. Carbon Ion Therapy at NIRS
(June 1994-August 2004)
Eye Miscell.
Rectum 13 (1.0%) 148 (11.4%)
15 (1.2%)
Pancreas Lung
18 (1.4%) 245 (18.9%)
Base of skull
20 (1.5%)
Total Head & Neck
Esophagus
207 (16.0%)
2,297
23 (1.8%)
Brain
74 (5.7%)
Uterus
78 (6.0%)
( )
Prostate
Bone/ soft tissue 190 (14.6%)
121 (9.3%) Liver
145 (11.2%)
6. Rasterscan Method
scanning of
focussed
ion beams
in fast
dipole magnets
active variation
of the energy,
focus and
intensity in the
accelerator and
beam lines
utmost precision
via active
position and
intensity feed
back loops
intensity-controlled rasterscan technique @ GSI
Haberer et al., NIM A , 1993
7. Key Developments @ GSI
• Scanning-ready pencil beam library (25.000 combinations):
253 energies (1mm range steps) x 7 spot sizes x 15 intensity steps
• Rasterscan method incl. approved controls and safety
pp y
• Beammonitors follow the scanned beams (v <= 40 m/s) in real-time
• Biological interactionmodel based on 25 years of radiobiological
research
• Physical beam transportmodel
• Planningsystem TRiP
• In-beam Positron Emission Tomography
• QA system
t
• ...
Th. Haberer, Heidelberg Ion Therapy Center
8. Results
Pre OP
dose [%]
Post OP
chondro sarcoma
rasterscanned carbon i
t d b ions
9. FSRT / IMRT vs FSRT / IMRT+C12 at the locally
advanced adenoid-cystic carzinoma
adenoid cystic
survival local control
Schulz-Ertner, Cancer 2005
acute toxicity acceptable
y p
late toxicity > CTC Grad 2 < 5%
Th. Haberer
10. Heidelberg Ion Therapy Center
• compact design
• full clinical integration
• rasterscanning only
• low-LET modality:
Protons (later He)
• high-LET
high LET modality:
Carbon (Oxygen)
• ion selection within
minutes
• world-wide fi t
ld id first
scanning
ion gantry
• > 1000 patients/year
> 15.000
fractions/year
Th. Haberer, Heidelberg Ion Therapy Center
11. Germany: Ion Some Facts Heidelberg
Facility of the
• Effective area 5.027 m² Start of construction: November 2003
Completion of building and acc.: June 2006
• Concrete 30.000 tons
First patient p
p planned: early in 2009
y
• Constructional steel 7 500 tons
7.500
• Capital Investment 100 M€
Project Partners:
• University pays, owns and
operates the facility
• GSI built the accelerator
• Siemens supplies all components
related to patient environment
GSI, DKFZ, … are research
partners
12. HIT / General Requirements
3He2+ 12C6 16O8+
• ions : p
• energies (MeV/u) : 48 72 88 102
(255 steps) -220 -330 -430 -430
• beam spot size : 4 - 10 mm (2d-gaussian)
( 4 steps)
• treatment caves : 3 (2 horizontal, 1 iso-centric gantry)
• QA and research : 1 (1 horizontal)
Th. Haberer, Heidelberg Ion Therapy Center
13. H, Li, C, N, O ?
RBE for fractionated RT of gut crypt cells of mice (Berkeley)
g yp ( y)
Proton data: Tepper et al. 1977,
Ion data: Goldstein et al. 1981
Which Ion is optimal: Li, C, N, O ?
And: for which clinical indication ?
14. Injector
j
RFQ + IH-DTL
Ion sources
Th. Haberer, Heidelberg Ion Therapy Center
15. high energy
beam transport
synchrotron
Th. Haberer, Heidelberg Ion Therapy Center
16. Medical Equipment
Identical patient
positioning systems
• fixed beam
• gantry
Workflow optimization
• automated QA
procedures
• automated patient
hand over from
shuttle
• treatment chair
Inroom position
I iti
verification
• 2D
• 3D Cone beam CT
Open for future
applications and
workflows
Th. Haberer, Heidelberg Ion Therapy Center
18. Status & Next Steps
preliminary scanner commissioning result
Protons@maximum energy recorded in a verification film
@ gy
no feedback loops for beam intensity or position
(courtesy S.O. Grözinger et al., Siemens Medical Solutions)
20. Scanning Ion Gantry
• optimum dose
application
• world-wide fi t
ld id first
ion gantry
• world-wide first
integration
of beam scanning
• 13m diameter
25m length
600to overall weight
0,5mm max.
deformation
• prototype segment
MT Mechatronics
tested at GSI
MT Aerospace
Th. Haberer, Heidelberg Ion Therapy Center
24. PARTNER: Simulation and Dosimetry
15-M1
15 M1 Customisation and integration of the FLUKA MC code M6 Milestone:
in the UKL-HD (HIT) research planning platform for Integration of the
dose calculations of scanned ion beams in water and FLUKA Monte Carlo
patient- or phantom-CTs code in the research
planning platform for
scanned ion beams
at UKL-HD (HIT)
15-M2 Experimental validation by means of dosimetric M12 Milestone:
15-D2
15 D2 measurements in homogeneous and heterogeneous Experimental
phantoms at UKL-HD (HIT) validation
Deliverable: Report
15-D1 Development of workflow-efficient analysis tools for M18 Deliverable: Report
comparison of MC and analytical treatment plan
calculations
15-D2
15 D2 Intercomparison between MC and analytical treatment M24 Deliverable: Report
plan calculations in a representative number of
challenging real clinical situations (e.g., in the presence
of tissue/air interfaces and metallic implants, dose to
water/tissue…)
water/tissue )
25. 12C Reference Plan Proton Plans
ISO@140cm
ISO@80cm
Calculations done with
TRiP98 and TRiP98Beam
(S. Brons, K P di)
(S B K. Parodi)
26. PARTNER: Clinical Studies,
Epidemiology and Patient Selection
2-M1 Effectiveness of carbon ions therapy m3 Specification
2-M2 Correct definition of treatment volumes & m6 Report
precise patient setup
2-D1 Preliminary results: LC and early toxicity m6 Report
2-M3 Target definition for treatment m12 Protocol
2-M4 Technique for data analysis selected m21 Protocol
2-D2 Experimental data analysed m24 Report
2-D3 Preliminary results: LC, DFS, OS, and late m24 Report
toxicity and relationship with dose fractionation
and Final Report
2-D4 Clinical validation of biological input m30 Report
parameters
2-D5 Cost-effectiveness analysis m36 Report
Courtesy S. Combs
27. PARTNER: Clinical Studies,
Epidemiology and Patient Selection
2-M1 Refine epidemiological date for indication for m6 Milestone
ion therapy
2-D1 Comparison of data on photon proton and m12 Report
ion therapy
2-M2
2 M2 Develop clinical trial of specific indication
D l li i l i l f ifi i di i m18
18 Protocol
P l
2-D2 Report on the analysis of the data on P2-M2 m36 Report
Courtesy S. Combs
28. Preparatory Work
carbon ion therapy for chondrosarcomas at the base of the skull
local control 96.2% / 89.8% 5-year OS 98.2%
at 3 / 4 years, n=54
failure: n=1 in-field
n=1 border
Courtesy S. Combs
29. Goals of this planned trial:
Optimized therapy of chordomas and chondrosarcomas
at the base of the skull
Comparison: high-dose proton vs carbon ion treatment,
p g p ,
monitor localc control, overall survival and toxicity
(phase III trial)
Establish a common protocol
Other trials are under way (pancreas, prostate, …)
Courtesy S. Combs, J. Debus, K. Herfarth, M. Münter
30. Organ motion and beam scanning
4DCT lung tumor
Courtesy by E. Rietzel (MGH) and C. Bert (GSI)
Organ motion + with beam scanning leads to interplay effects