Download as PDF, PPTX
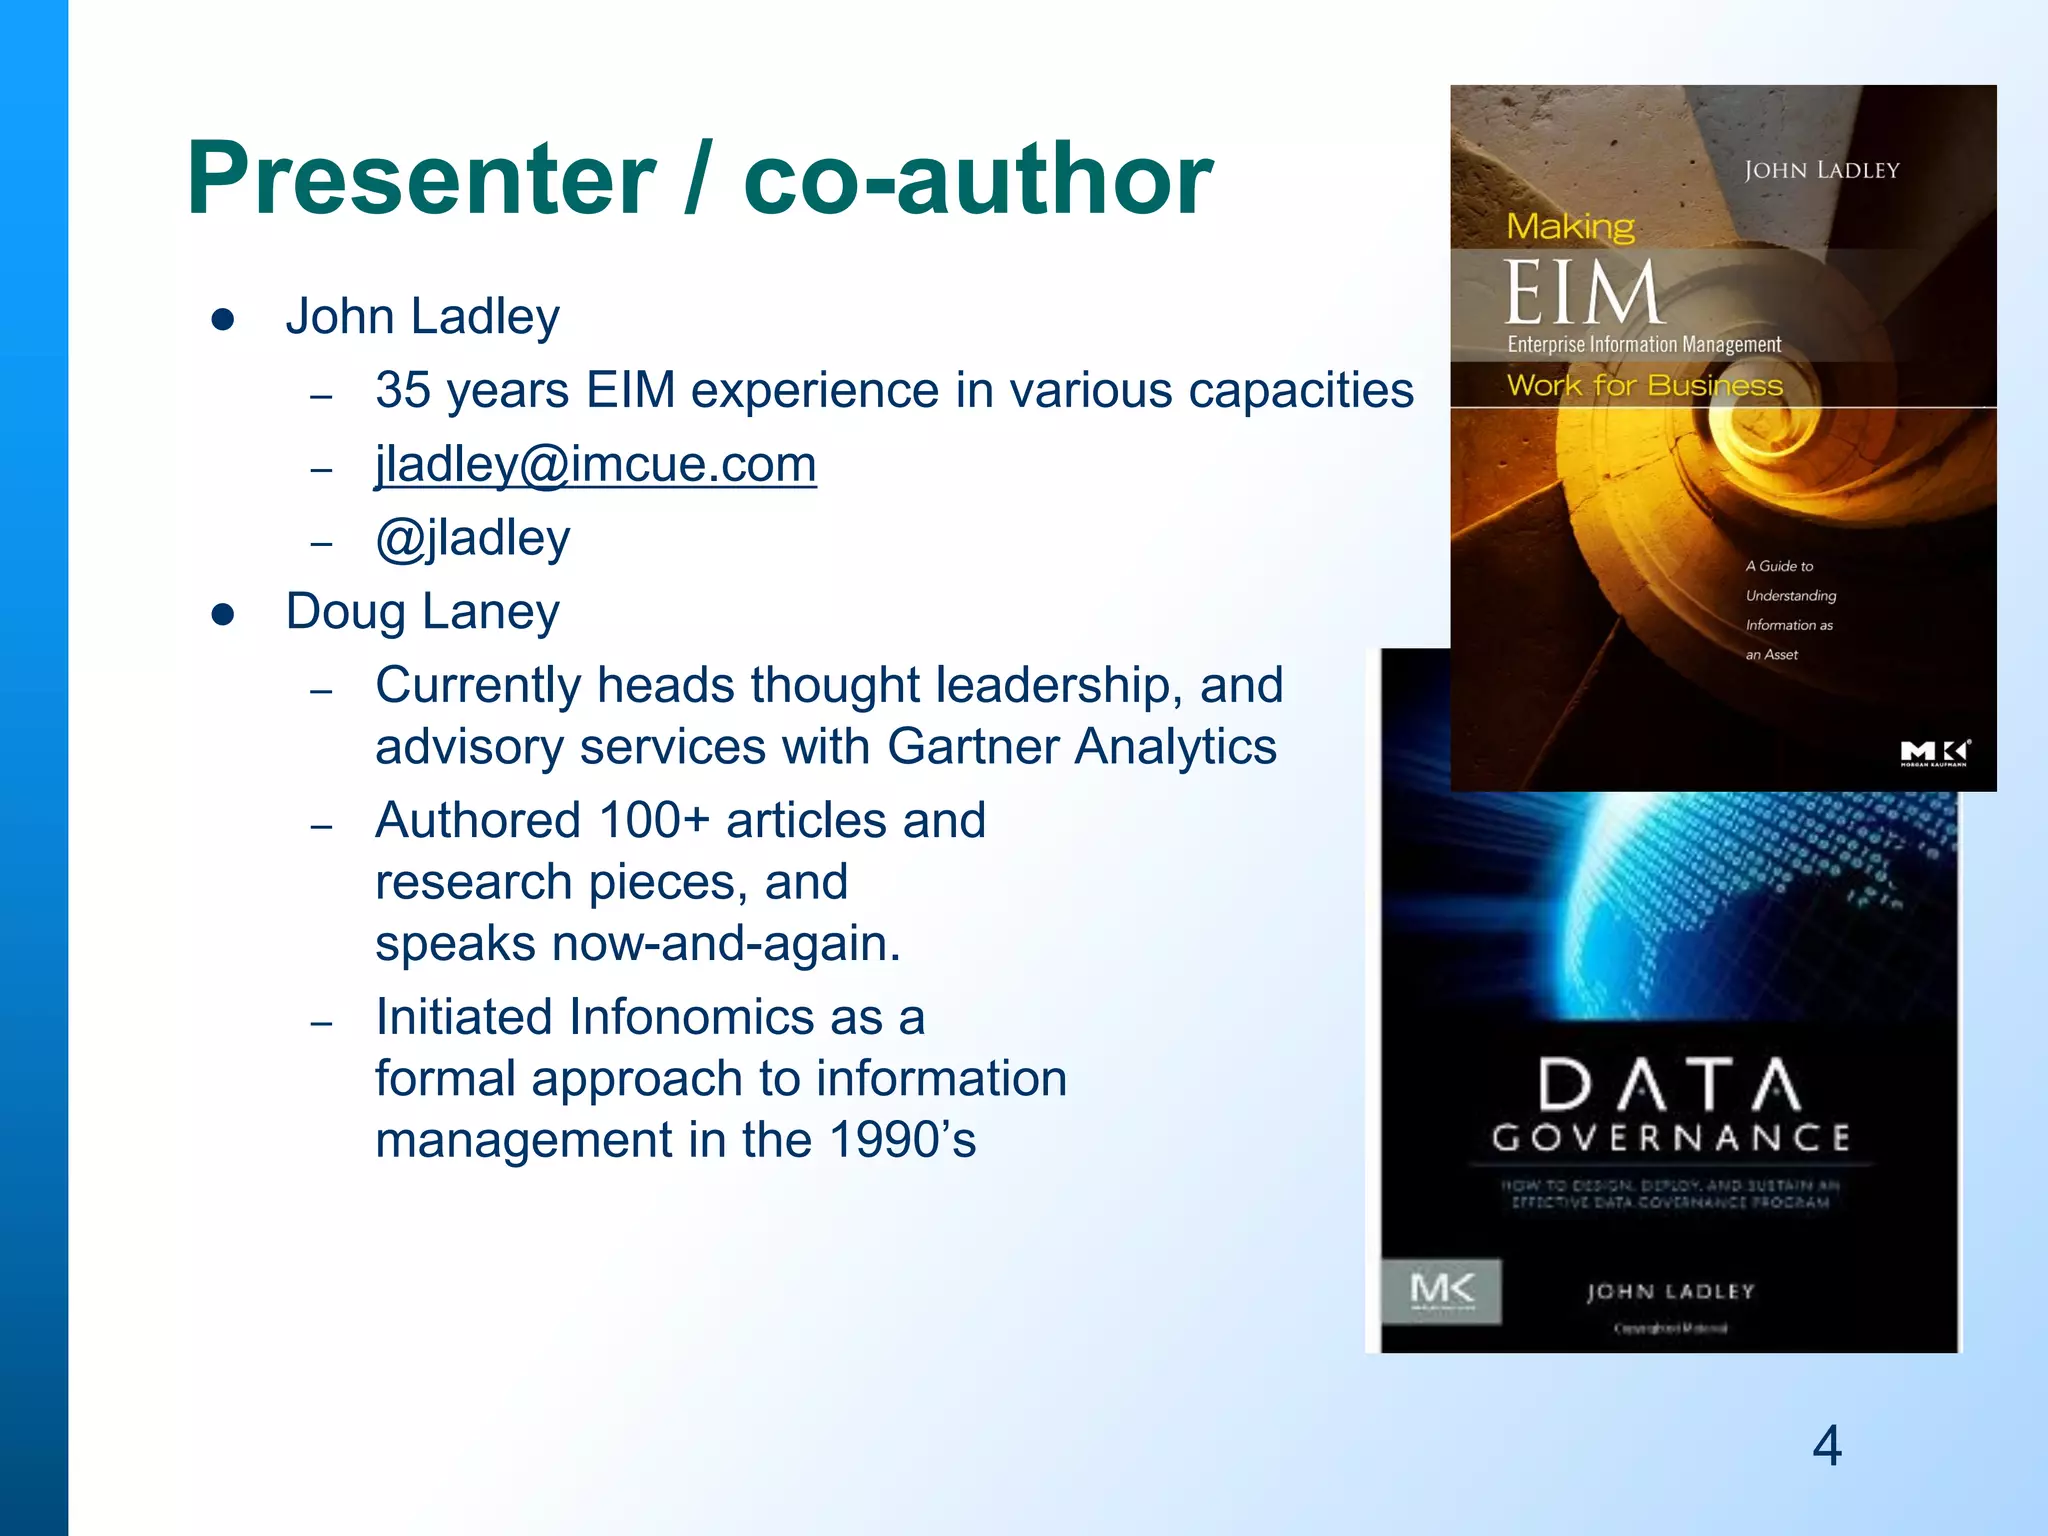

The document outlines a webinar series hosted by Dataversity, focusing on data governance, advanced analytics, and the economic impact of information management. Key speakers include Tony Shaw and John Ladley, who emphasize the importance of measuring information as a valuable asset and the need for effective information asset management. The agenda includes discussions on metrics, governance, and the economic principles of information management.


![Vibe Coding vs. Spec-Driven Development [Free Meetup]](https://cdn.slidesharecdn.com/ss_thumbnails/vibecodingvsspecdrivendevelopment-251209105622-43f455e7-thumbnail.jpg?width=640&height=640&fit=bounds)


