Download as PDF, PPTX


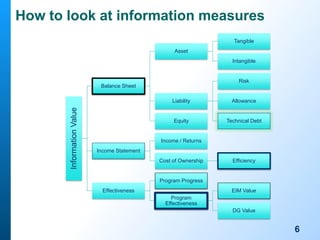
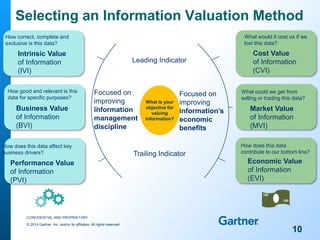
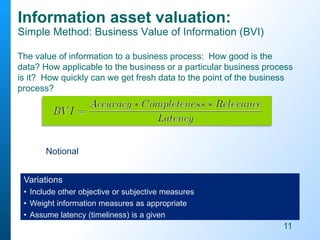
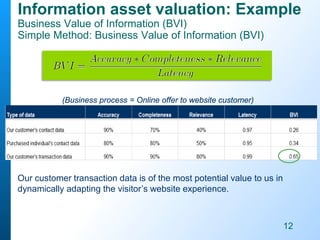

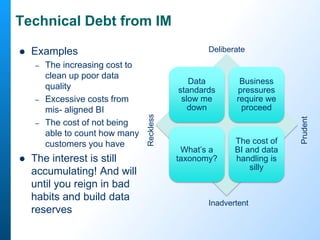
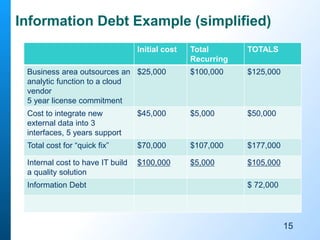


The document discusses the importance of measuring the value of data and information within organizations, emphasizing how information can be treated as an asset that contributes to future value and needs to be managed effectively. It presents various valuation methods and considerations, such as intrinsic, business, and performance values, while highlighting the potential costs associated with poor information management and technical debt. Ultimately, it underscores that measuring information value is essential for achieving business efficiency and effectiveness.


![[MU630] 002. IT Strategic Planning](https://cdn.slidesharecdn.com/ss_thumbnails/002-190422035026-thumbnail.jpg?width=640&height=640&fit=bounds)