Download as PDF, PPTX

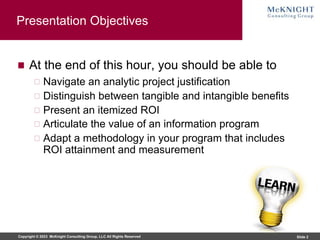
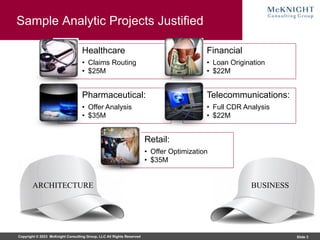
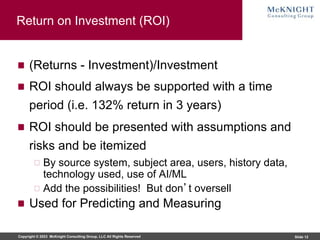
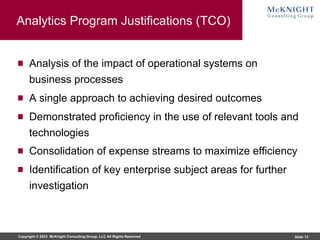
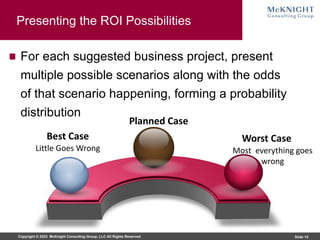

The document outlines the key objectives for justifying analytic projects, emphasizing ROI measurement and the distinction between tangible and intangible benefits. It discusses various methods of presenting ROI, the importance of risk assessment, and the need for a structured approach to project and program justification in analytics. Additionally, it provides real-world examples of companies successfully leveraging analytics for improved performance and customer insights.