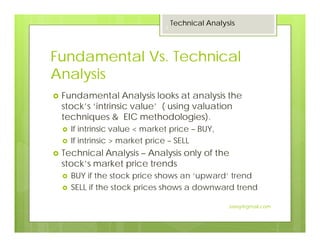
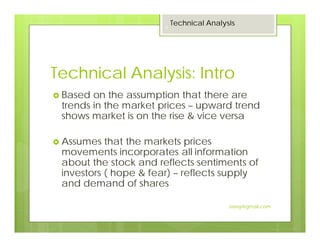
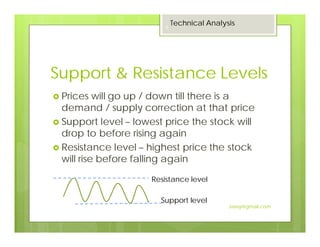
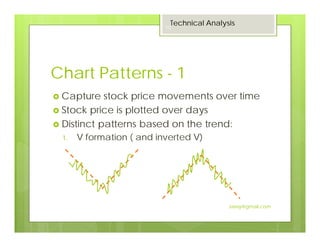
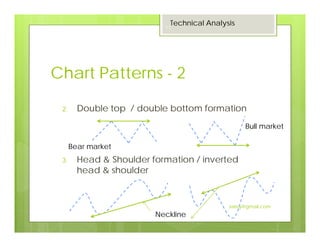
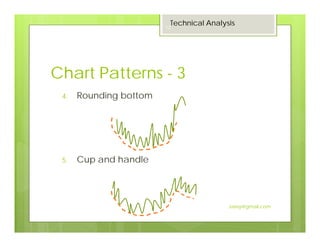
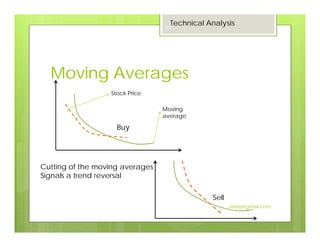
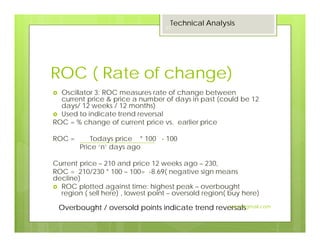
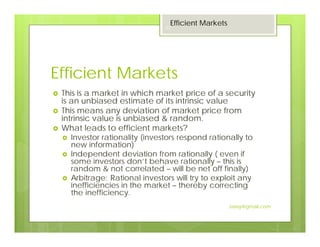
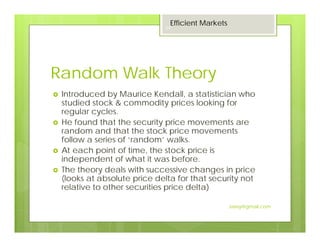
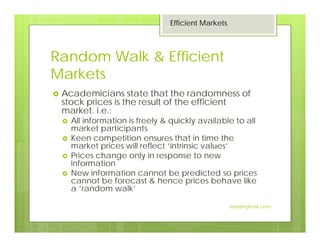
Module – I Commodity Markets and Exchanges:
Growth of Global and Domestic Commodities Derivatives Markets, Agricultural Commodities Market and Non-Agricultural Commodities Markets
Commodity Exchanges: Exchanges around the World and its Importance, Commodity Exchanges in India. National Exchanges and Regional Exchanges, platform – Structure, Exchange memebership, Capital requirements, commodities traded on National exchanges, instruments available for trading and Electronic Spot Exchanges.
Innovation of derivatives have redefined and revolutionized the landscape of financial industry across the world and derivatives have earned a well deserved and extremely significant place among all the financial products. Derivatives are risk management tool that help in effective management of risk by various stakeholders. Derivatives provide an opportunity to transfer risk, from the one who wish to avoid it; to one, who wish to accept it. India’s experience with the launch of equity derivatives market has been extremely encouraging and successful.
Money Market: Structure and components: Participants in Indian Money Market, Money Market Instruments,
Structure of Money Market, Role of central bank in money market; Players in the Indian Money Market, The reforms in
Indian Money Market.
The concept of the Security Market Line is very popular for portfolio management. It helps to derive the pricing of risky securities by plotting their expected returns.
To know more about it, click on the link given below:
https://efinancemanagement.com/investment-decisions/security-market-line
Derivatives are the financial instruments whosevalue is derived from the underlying assets.
•
It is called derivatives as its value is derived fromother assets called underlying asset.
•
It is a contract that derives its value from changes inthe price of the underlying asset.
Example1:
The value of a gold futures contract is derived fromthe value of the underlying asset i.e. Gold.
This presentation gives you an overview of technical analysis. Technical Analysis basically suggests us "WHEN" to invest. This presentation will give a brief idea of Dow's Theory and different types of graphs used in share market to demonstrate a specific stock (5 types of graphs).
An overview of technical analysis and its common techniques (Candlestick , MACD, Parabolic SAR, RSI, Bolinger Bands etc) - given to brokers and managers of Nepal Derivative Exchange (NDEX) by Mr. Sohan Khatri (Resource person - Management Association of Nepal, Adjunct Faculty - Ace Institute of Management, Kathmandu College of Management)
Using analysis on a particular market instrument or stock can be hard to do manually but today's market analysis software and trading platforms often have features that can does this even on multiple items or samples.
Model Attribute Check Company Auto PropertyCeline George
In Odoo, the multi-company feature allows you to manage multiple companies within a single Odoo database instance. Each company can have its own configurations while still sharing common resources such as products, customers, and suppliers.
A workshop hosted by the South African Journal of Science aimed at postgraduate students and early career researchers with little or no experience in writing and publishing journal articles.
Normal Labour/ Stages of Labour/ Mechanism of LabourWasim Ak
Normal labor is also termed spontaneous labor, defined as the natural physiological process through which the fetus, placenta, and membranes are expelled from the uterus through the birth canal at term (37 to 42 weeks
June 3, 2024 Anti-Semitism Letter Sent to MIT President Kornbluth and MIT Cor...Levi Shapiro
Letter from the Congress of the United States regarding Anti-Semitism sent June 3rd to MIT President Sally Kornbluth, MIT Corp Chair, Mark Gorenberg
Dear Dr. Kornbluth and Mr. Gorenberg,
The US House of Representatives is deeply concerned by ongoing and pervasive acts of antisemitic
harassment and intimidation at the Massachusetts Institute of Technology (MIT). Failing to act decisively to ensure a safe learning environment for all students would be a grave dereliction of your responsibilities as President of MIT and Chair of the MIT Corporation.
This Congress will not stand idly by and allow an environment hostile to Jewish students to persist. The House believes that your institution is in violation of Title VI of the Civil Rights Act, and the inability or
unwillingness to rectify this violation through action requires accountability.
Postsecondary education is a unique opportunity for students to learn and have their ideas and beliefs challenged. However, universities receiving hundreds of millions of federal funds annually have denied
students that opportunity and have been hijacked to become venues for the promotion of terrorism, antisemitic harassment and intimidation, unlawful encampments, and in some cases, assaults and riots.
The House of Representatives will not countenance the use of federal funds to indoctrinate students into hateful, antisemitic, anti-American supporters of terrorism. Investigations into campus antisemitism by the Committee on Education and the Workforce and the Committee on Ways and Means have been expanded into a Congress-wide probe across all relevant jurisdictions to address this national crisis. The undersigned Committees will conduct oversight into the use of federal funds at MIT and its learning environment under authorities granted to each Committee.
• The Committee on Education and the Workforce has been investigating your institution since December 7, 2023. The Committee has broad jurisdiction over postsecondary education, including its compliance with Title VI of the Civil Rights Act, campus safety concerns over disruptions to the learning environment, and the awarding of federal student aid under the Higher Education Act.
• The Committee on Oversight and Accountability is investigating the sources of funding and other support flowing to groups espousing pro-Hamas propaganda and engaged in antisemitic harassment and intimidation of students. The Committee on Oversight and Accountability is the principal oversight committee of the US House of Representatives and has broad authority to investigate “any matter” at “any time” under House Rule X.
• The Committee on Ways and Means has been investigating several universities since November 15, 2023, when the Committee held a hearing entitled From Ivory Towers to Dark Corners: Investigating the Nexus Between Antisemitism, Tax-Exempt Universities, and Terror Financing. The Committee followed the hearing with letters to those institutions on January 10, 202
Operation “Blue Star” is the only event in the history of Independent India where the state went into war with its own people. Even after about 40 years it is not clear if it was culmination of states anger over people of the region, a political game of power or start of dictatorial chapter in the democratic setup.
The people of Punjab felt alienated from main stream due to denial of their just demands during a long democratic struggle since independence. As it happen all over the word, it led to militant struggle with great loss of lives of military, police and civilian personnel. Killing of Indira Gandhi and massacre of innocent Sikhs in Delhi and other India cities was also associated with this movement.
Exploiting Artificial Intelligence for Empowering Researchers and Faculty, In...Dr. Vinod Kumar Kanvaria
Exploiting Artificial Intelligence for Empowering Researchers and Faculty,
International FDP on Fundamentals of Research in Social Sciences
at Integral University, Lucknow, 06.06.2024
By Dr. Vinod Kumar Kanvaria
A Strategic Approach: GenAI in EducationPeter Windle
Artificial Intelligence (AI) technologies such as Generative AI, Image Generators and Large Language Models have had a dramatic impact on teaching, learning and assessment over the past 18 months. The most immediate threat AI posed was to Academic Integrity with Higher Education Institutes (HEIs) focusing their efforts on combating the use of GenAI in assessment. Guidelines were developed for staff and students, policies put in place too. Innovative educators have forged paths in the use of Generative AI for teaching, learning and assessments leading to pockets of transformation springing up across HEIs, often with little or no top-down guidance, support or direction.
This Gasta posits a strategic approach to integrating AI into HEIs to prepare staff, students and the curriculum for an evolving world and workplace. We will highlight the advantages of working with these technologies beyond the realm of teaching, learning and assessment by considering prompt engineering skills, industry impact, curriculum changes, and the need for staff upskilling. In contrast, not engaging strategically with Generative AI poses risks, including falling behind peers, missed opportunities and failing to ensure our graduates remain employable. The rapid evolution of AI technologies necessitates a proactive and strategic approach if we are to remain relevant.
Acetabularia Information For Class 9 .docxvaibhavrinwa19
Acetabularia acetabulum is a single-celled green alga that in its vegetative state is morphologically differentiated into a basal rhizoid and an axially elongated stalk, which bears whorls of branching hairs. The single diploid nucleus resides in the rhizoid.
Unit 8 - Information and Communication Technology (Paper I).pdfThiyagu K
This slides describes the basic concepts of ICT, basics of Email, Emerging Technology and Digital Initiatives in Education. This presentations aligns with the UGC Paper I syllabus.
Introduction to AI for Nonprofits with Tapp NetworkTechSoup
Dive into the world of AI! Experts Jon Hill and Tareq Monaur will guide you through AI's role in enhancing nonprofit websites and basic marketing strategies, making it easy to understand and apply.
2. Objective: (Module 4)
Understand Technical Analysis
Chart Patterns
Moving Averages
RSI / ROC /MACD
Learn of the Efficient Market Hypothesis and
the Random walk theory
References: SAPM texts by
Punithavathy Pandian
Prassana Chandra
2
Jaissy@gmail.com
3. Fundamental Vs. Technical
Analysis
Fundamental Analysis looks at analysis the
stock’s ‘intrinsic value’ ( using valuation
techniques & EIC methodologies).
If intrinsic value < market price – BUY,
If intrinsic > market price – SELL
Technical Analysis – Analysis only of the
stock’s market price trends
BUY if the stock price shows an ‘upward’ trend
SELL if the stock prices shows a downward trend
Technical Analysis
3
Jaissy@gmail.com
4. Technical Analysis: Intro
Based on the assumption that there are
trends in the market prices – upward trend
shows market is on the rise & vice versa
Assumes that the markets prices
movements incorporates all information
about the stock and reflects sentiments of
investors ( hope & fear) – reflects supply
and demand of shares
Technical Analysis
4
Jaissy@gmail.com
5. DOW Theory: Assumptions
Father of technical Analysis: Charles Dow
Analyzed stock movement charts, computed
moving averages to develop the ‘DOW
theory’ ( now implemented using computers)
1. Assumption 1: No single investor can influence
market trends ( only a stock trend if traded in
large quantities)
2. Assumption 2: Market factors in everything –
natural calamities, global recession etc
3. Assumption 3: Theory can only be used to
understand market, not beat it
Technical Analysis
5
Jaissy@gmail.com
6. Dow theory
Trend = direction of movement
Share prices moves up & down in a zigzag;
trend lines connect either 2 tops / bottom
There are 3 types of trends
1. Primary ( upward / downward – 1 / 2 years)…
( like TIDES of the sea)
2. Intermediary ( corrective movements – 1 – 3
months)…(like WAVES of the sea)
3. Short term ( day to day oscillations)…RIPPLES
Technical Analysis
6
Jaissy@gmail.com
7. Trend Lines
Rising trend line : BULL market
Falling Trend line : BEAR market
Prices rises, then
falls then rises even
more.. B2 > B1
Indicates revival,
growth in profitsB1
B2
Prices falls, then
rises, then falls even
more & rises again..
B2 < B1
Indicates decline
B1
B2
speculation
Distress selling
Decline in profit
Good profit
Loss of faith
Hope!
Technical Analysis
7
Jaissy@gmail.com
9. Support & Resistance Levels
Prices will go up / down till there is a
demand / supply correction at that price
Support level – lowest price the stock will
drop to before rising again
Resistance level – highest price the stock
will rise before falling again
Resistance level
Support level
Technical Analysis
9
Jaissy@gmail.com
10. Chart Patterns - 1
Capture stock price movements over time
Stock price is plotted over days
Distinct patterns based on the trend:
1. V formation ( and inverted V)
Technical Analysis
10
Jaissy@gmail.com
14. INDICATORS & OSCILLATORS
Indicator is a set of data points obtained by
applying a formula to the price data ( Open,
close price, volume) of a stock / index.
Technical indicators – used to find the overall
direction of the market.
Oscillator – shows the stock price movement
between two points
Oscillators show stock momentum &
indication on a possible trend reversal
Technical Analysis
14
Jaissy@gmail.com
15. Indicators: Volume of trade
indicates trend – bull or bear
Indicator 1: Volume; Volumes expand in a bull
market & narrow in bear market
Indicator 2: Breadth of market : Diff between
advance & declines
Advances (# of shares that have risen in price)
Declines (# of shares that have declined in
price) in volume
Indicator 3: Short sales ( in bear market) –
selling shares that you don’t have hoping for
future price decrease. # of short sales of a
months compared with avg daily volume for
previous month ( >1..oversold – bull trend)
Technical Analysis
15
Jaissy@gmail.com
16. Indicator 4: Moving Averages
Moving averages = ( average of a body
of data ( price) over time)
Short term ( 10-30 days)/ medium term (50
– 125 days) / long term ( 200 days) trends
of moving average studied to identify
trends
Stock price moving avg. compared with
index moving avg. to identify trends
Technical Analysis
16
Jaissy@gmail.com
18. Types of moving averages
Simple moving average – equal
weightage to each days price
Exponential moving average – higher
weightage to more recent prices.
Moving averages are studied for ‘buy’
and ‘sell’ signals.
Rising moving average- rising trends and
declining moving average -declining
trend
Technical Analysis
18
Jaissy@gmail.com
19. MACD ( Moving Average
convergence & divergence
Oscillator 1: MACD= difference between 2
exponential moving averages
MACD – difference between Short Term (
SEMA - 12 days) & Long Term (LEMA - 26 days)
exponential moving averages
MACD = SEMA - LEMA
Convergence = when the difference-> 0
Divergence = when the difference-> high
MACD: + = rising trend
MACD: - = declining trend
Technical Analysis
19
Jaissy@gmail.com
20. RSI- Relative Strength Index
: Oscillator 2: RSI shows inherent strength or weakness
of a particular stock
RSI = 100 – 100
1 + avg. daily gain
avg. daily loss
RSI avg. Gain / loss can be calculated for 9, 14 days
or more.. Higher the better.
RSI >70 likely downturn – sell, RSI<30 likely upturn- buy
Technical Analysis
20
Jaissy@gmail.com
21. ROC ( Rate of change)
Oscillator 3: ROC measures rate of change between
current price & price a number of days in past (could be 12
days/ 12 weeks / 12 months)
Used to indicate trend reversal
ROC = % change of current price vs. earlier price
ROC = Todays price * 100 - 100
Price ‘n’ days ago
Current price – 210 and price 12 weeks ago – 230,
ROC = 210/230 * 100 – 100= -8.69( negative sign means
decline)
ROC plotted against time: highest peak – overbought
region ( sell here) , lowest point – oversold region( buy here)
Overbought / oversold points indicate trend reversals
Technical Analysis
21
Jaissy@gmail.com
22. Efficient Market Theory
Introduced by Fama – Efficient market theory
states that stock price movements are random
and without any pattern ( unlike technical analysis
which identifies chart patterns)
This theory assumes that any information regarding
the stock will be factored into the stock prices.
Higher the market efficiency, quicker will be the
incorporation of future expectations / any
information into the stock price.
Arbitrageurs look to make a quick profit in the time
before the market prices adjust to new
information; their actions cause the market to
adjust.
Intense competition will ensure a fair price for securities in the market
Efficient Markets
22
Jaissy@gmail.com
23. Efficient Markets
This is a market in which market price of a security
is an unbiased estimate of its intrinsic value
This means any deviation of market price from
intrinsic value is unbiased & random.
What leads to efficient markets?
Investor rationality (investors respond rationally to
new information)
Independent deviation from rationally ( even if
some investors don’t behave rationally – this is
random & not correlated – will be net off finally)
Arbitrage: Rational investors will try to exploit any
inefficiencies in the market – thereby correcting
the inefficiency.
Efficient Markets
23
Jaissy@gmail.com
24. Random Walk Theory
Introduced by Maurice Kendall, a statistician who
studied stock & commodity prices looking for
regular cycles.
He found that the security price movements are
random and that the stock price movements
follow a series of ‘random’ walks.
At each point of time, the stock price is
independent of what it was before.
The theory deals with successive changes in price
(looks at absolute price delta for that security not
relative to other securities price delta)
Efficient Markets
24
Jaissy@gmail.com
25. Random Walk & Efficient
Markets
Academicians state that the randomness of
stock prices is the result of the efficient
market. i.e.:
All information is freely & quickly available to all
market participants
Keen competition ensures that in time the
market prices will reflect ‘intrinsic values’
Prices change only in response to new
information
New information cannot be predicted so prices
cannot be forecast & hence prices behave like
a ‘random walk’
Efficient Markets
25
Jaissy@gmail.com
26. Sem
Three forms of efficient market
hypothesis
Efficient Market Hypothesis
Weak form
efficiency
Semi strong form efficiency
Strong form efficiency
Security prices
factor in all security
market info
Security prices factor
in all public market
info as well as non
market info
Security prices factor
in all available info –
pubic & private
26
Jaissy@gmail.com
27. Stock price factors in the
following info:
Weak Market Hypothesis
All security market info: prices, trading volumes,
rate of return, insider transactions, block trades,
odd lot transactions
Semi Strong Market Hypothesis
All public info– market & non market: macro-
economic data, industry reports, corporate
announcements, P:E ratio, div yield
Strong Market Hypothesis
All available info – public & private. Assumes that
no investor has monopolistic access to info that
would lead to higher risk adjusted returns.
This means no one can getter returns than the market using info!
Efficient Market Hypothesis
27
Jaissy@gmail.com
28. Contradiction to concept of
‘efficient markets’
1. Over reactions of the market – Stock
prices decline dramatically after bad
results - and take time to come to
‘normal’ – during which time investor
can buy at low rates & sell at high rates
making abnormal profit – against
efficient market theory
Efficient Market Hypothesis
28
Jaissy@gmail.com
29. Contradiction to concept of
‘efficient markets’
2. Stock price will go back to ‘average’
return after low or high returns – thereby
giving an investor a chance to ‘predict’
price : against random walk theory
3. Delayed adjustment to new information:
stock prices tend to continue to rise /
decline for some time after corporate
announcements are positive / negative.
Efficient Market Hypothesis
29
Jaissy@gmail.com
30. Contradiction to concept of
‘efficient markets’
4. Small firm: A theory that says small firms give
better returns than large firms – confirmed by
a study done on the NYSE
5. Weekend effect: Stock prices tend to rise all
week reaching a peak on Friday. So it makes
sense to buy on Monday and sell on Friday –
the ‘weekend’ effect contradicts the
efficient market hypothesis
Efficient Market Hypothesis
30
Jaissy@gmail.com