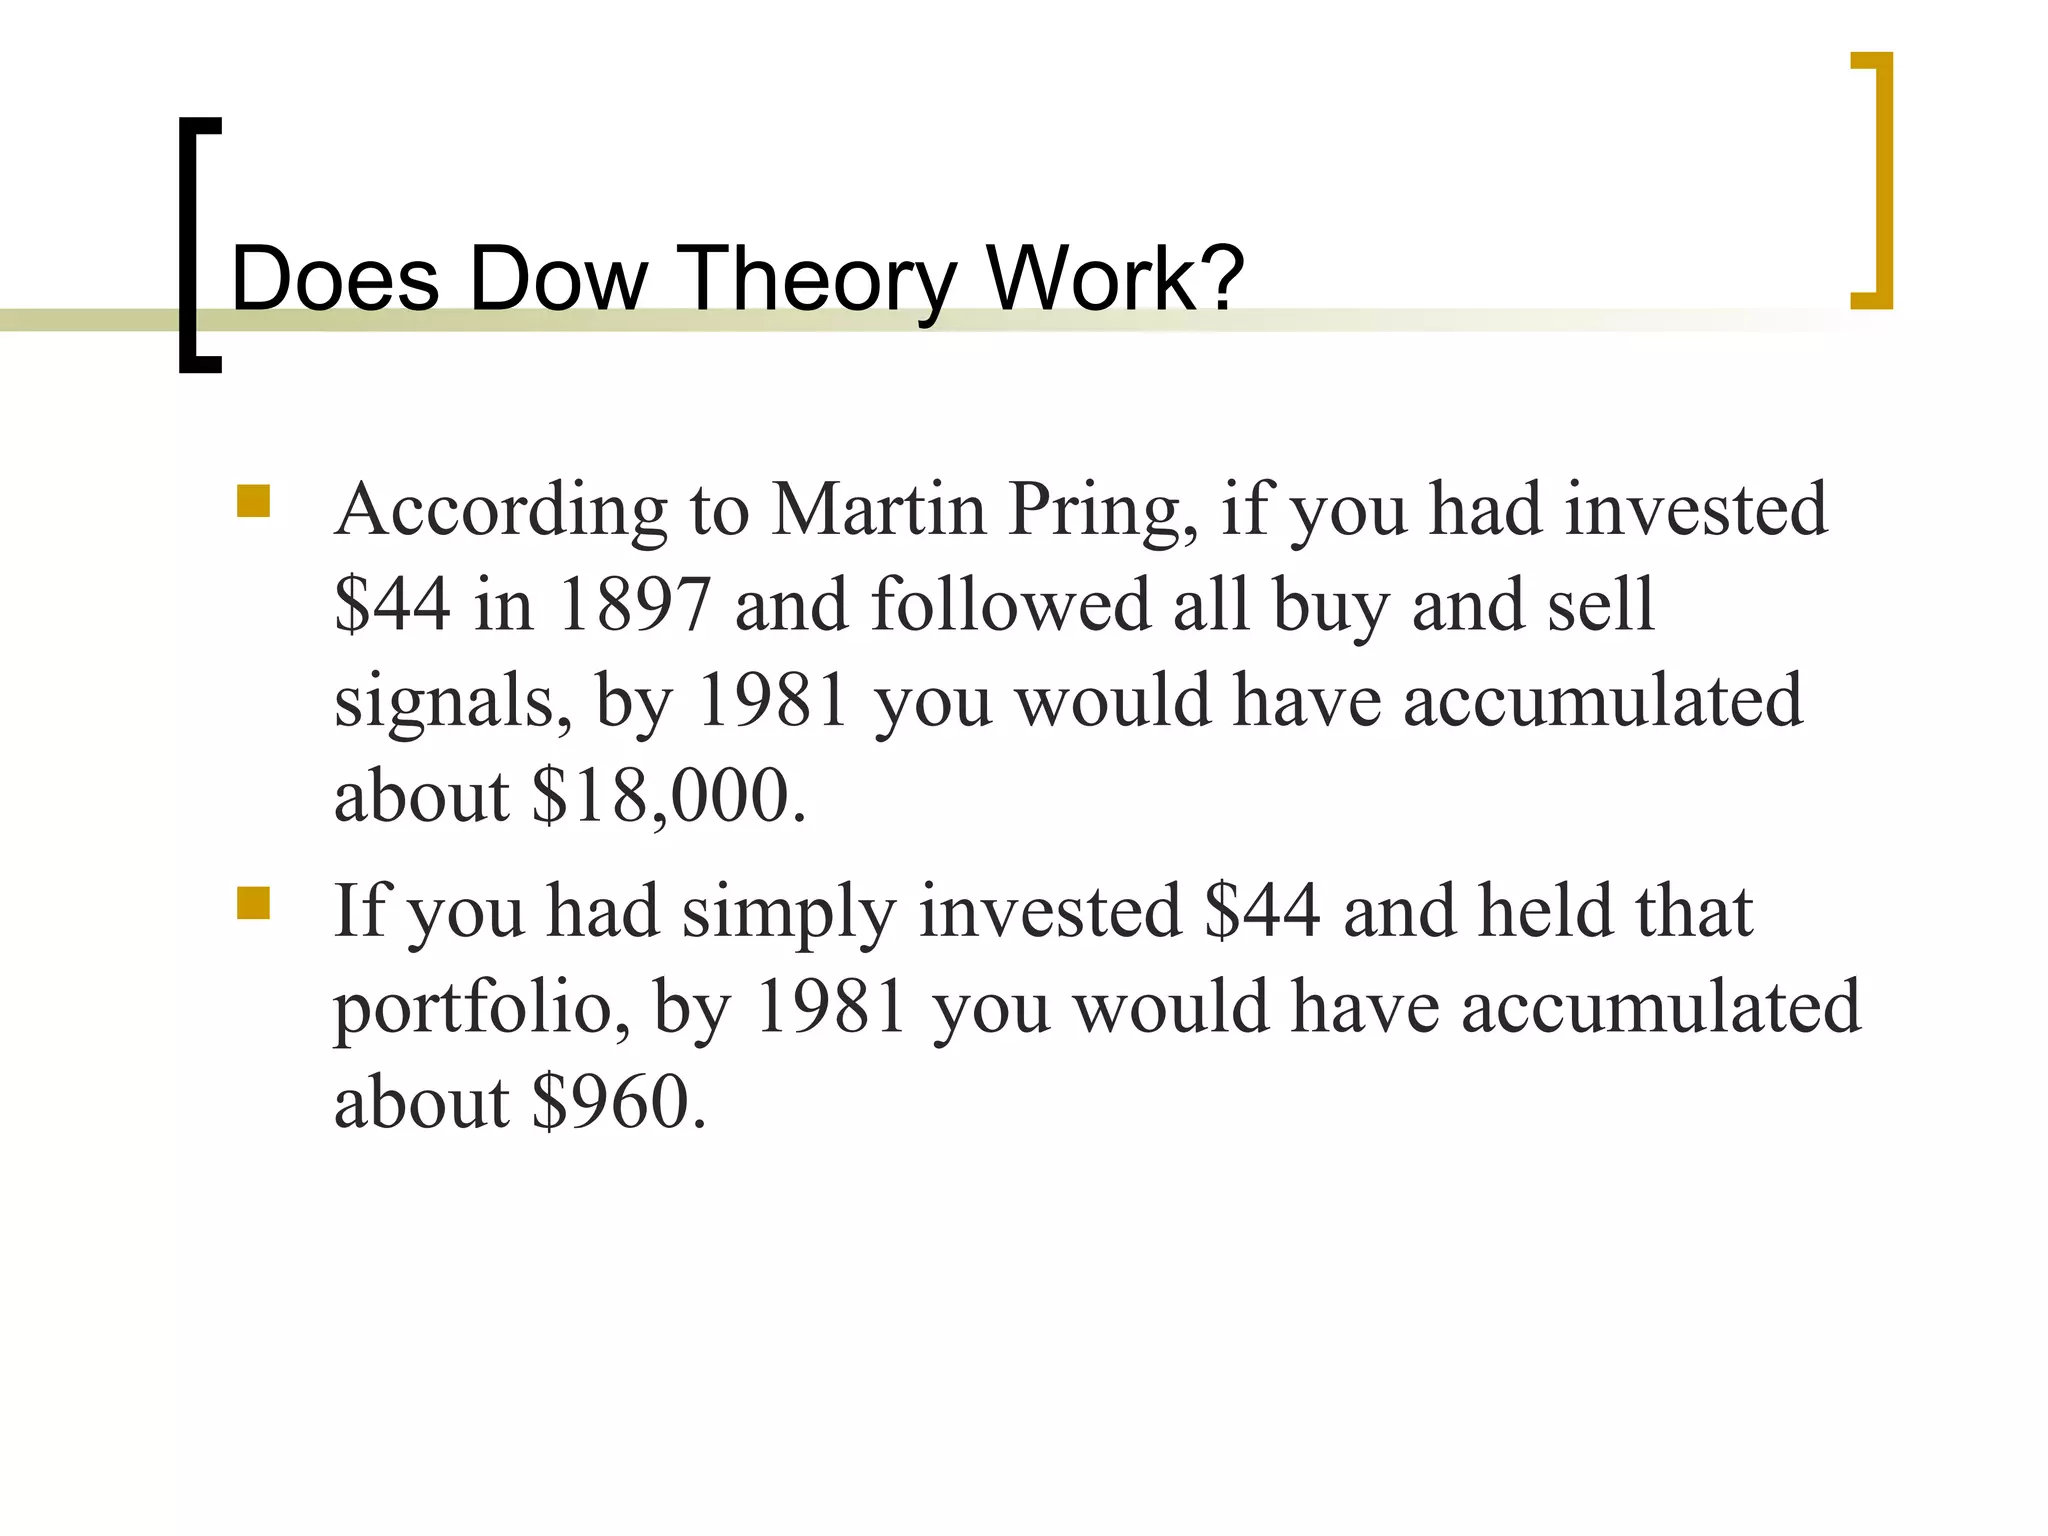
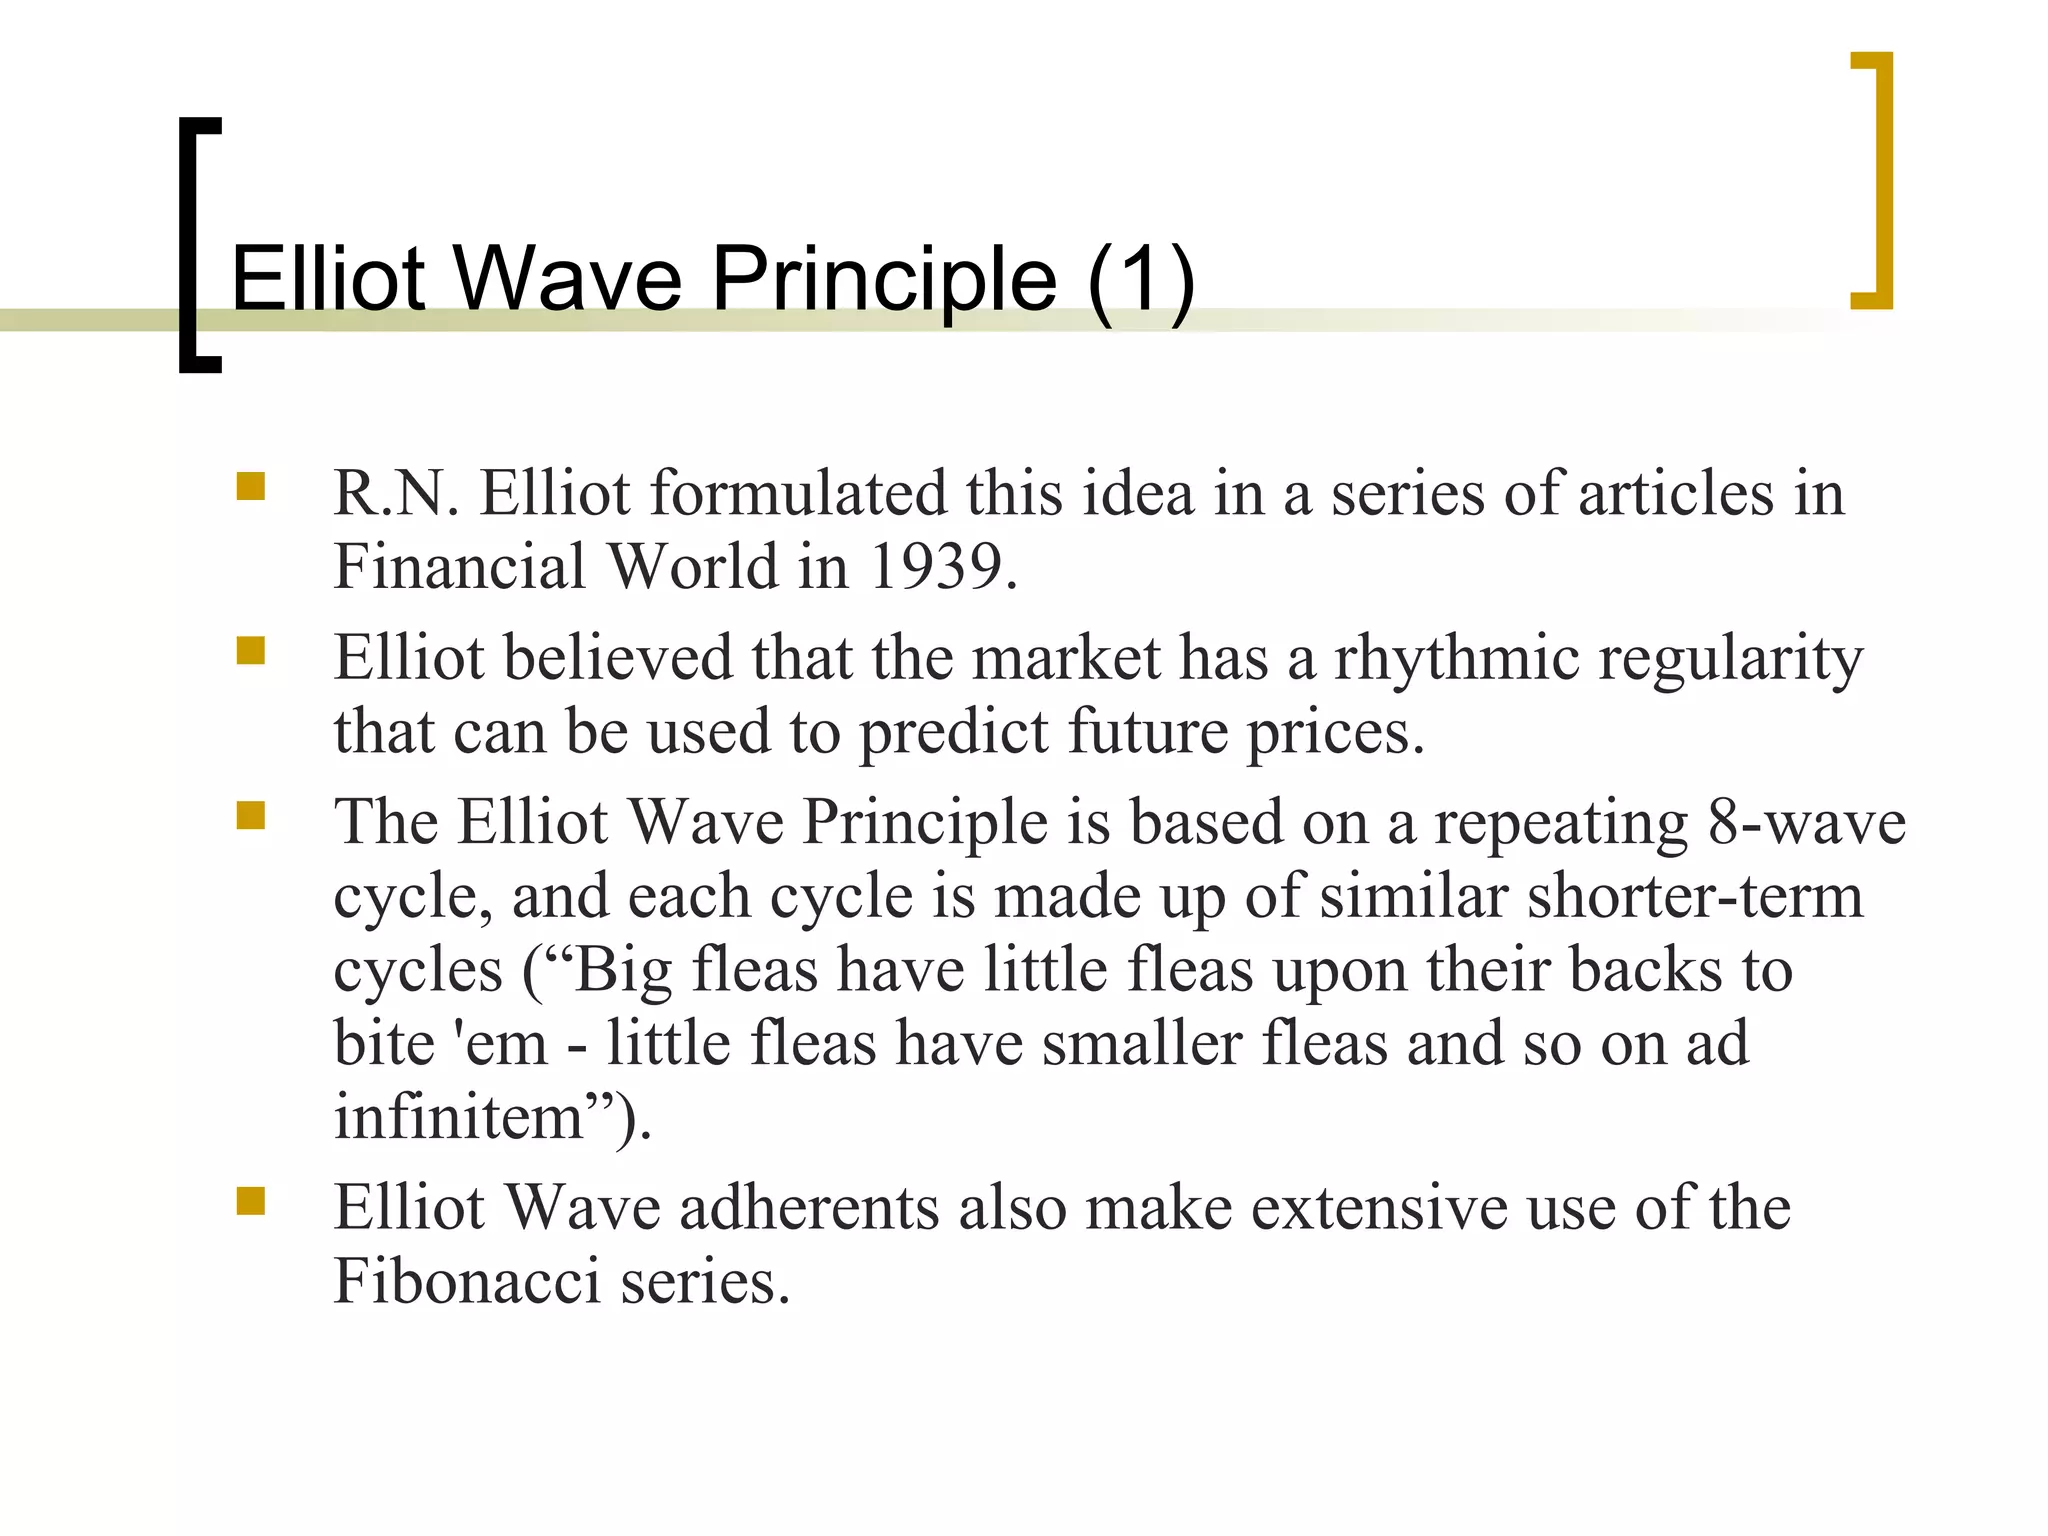
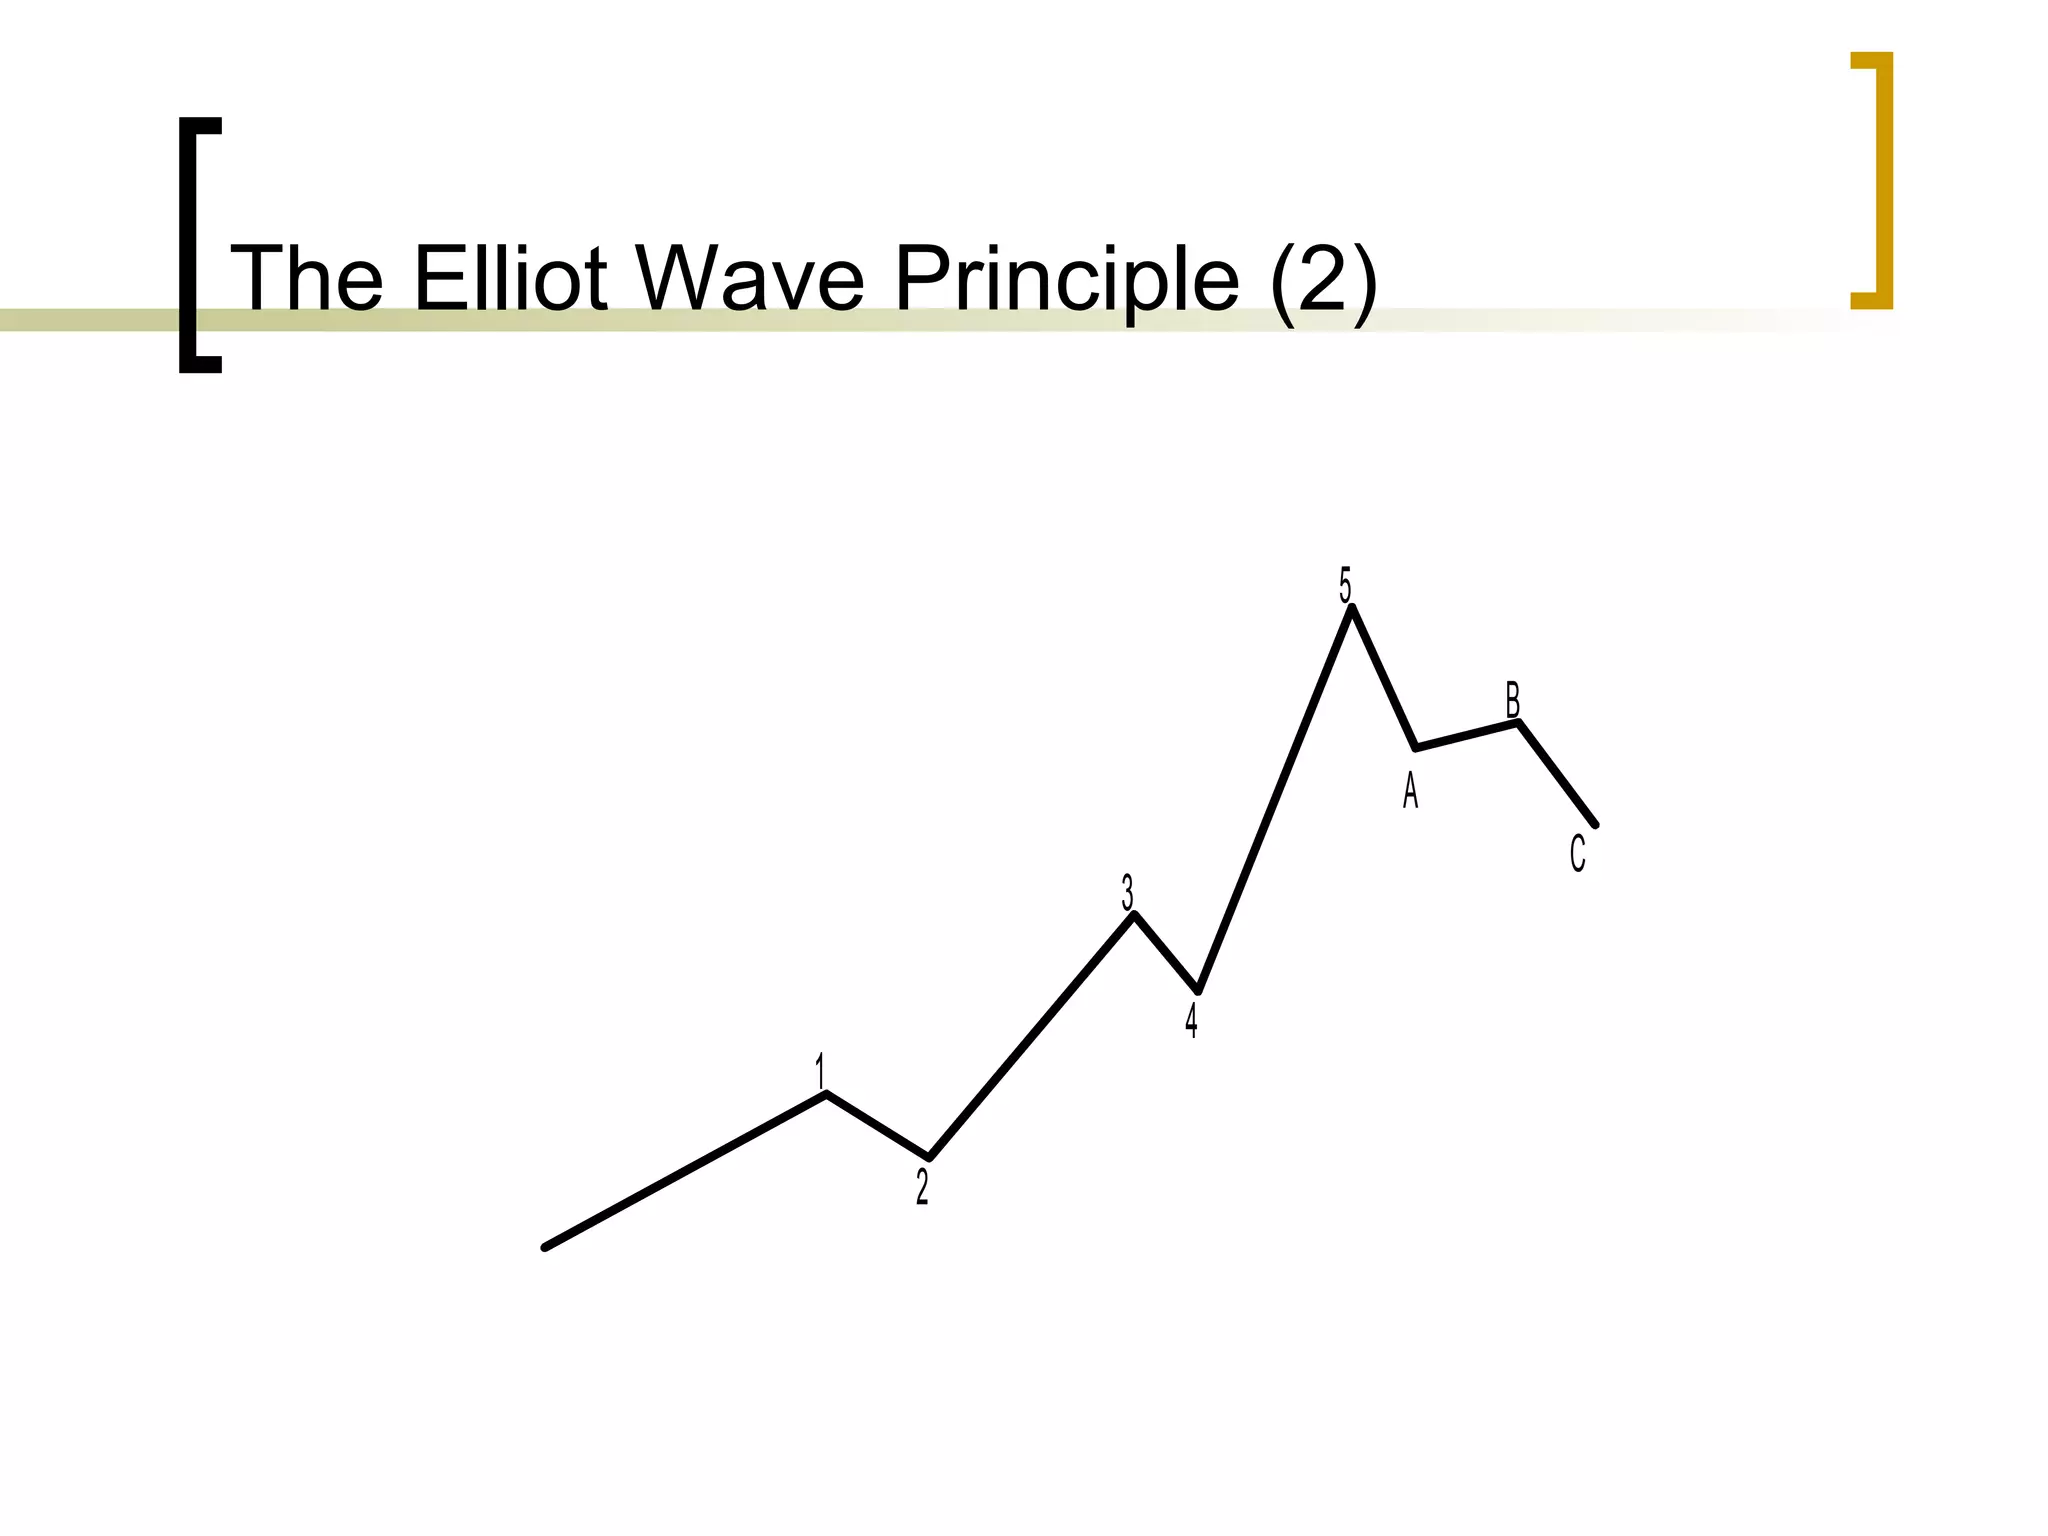
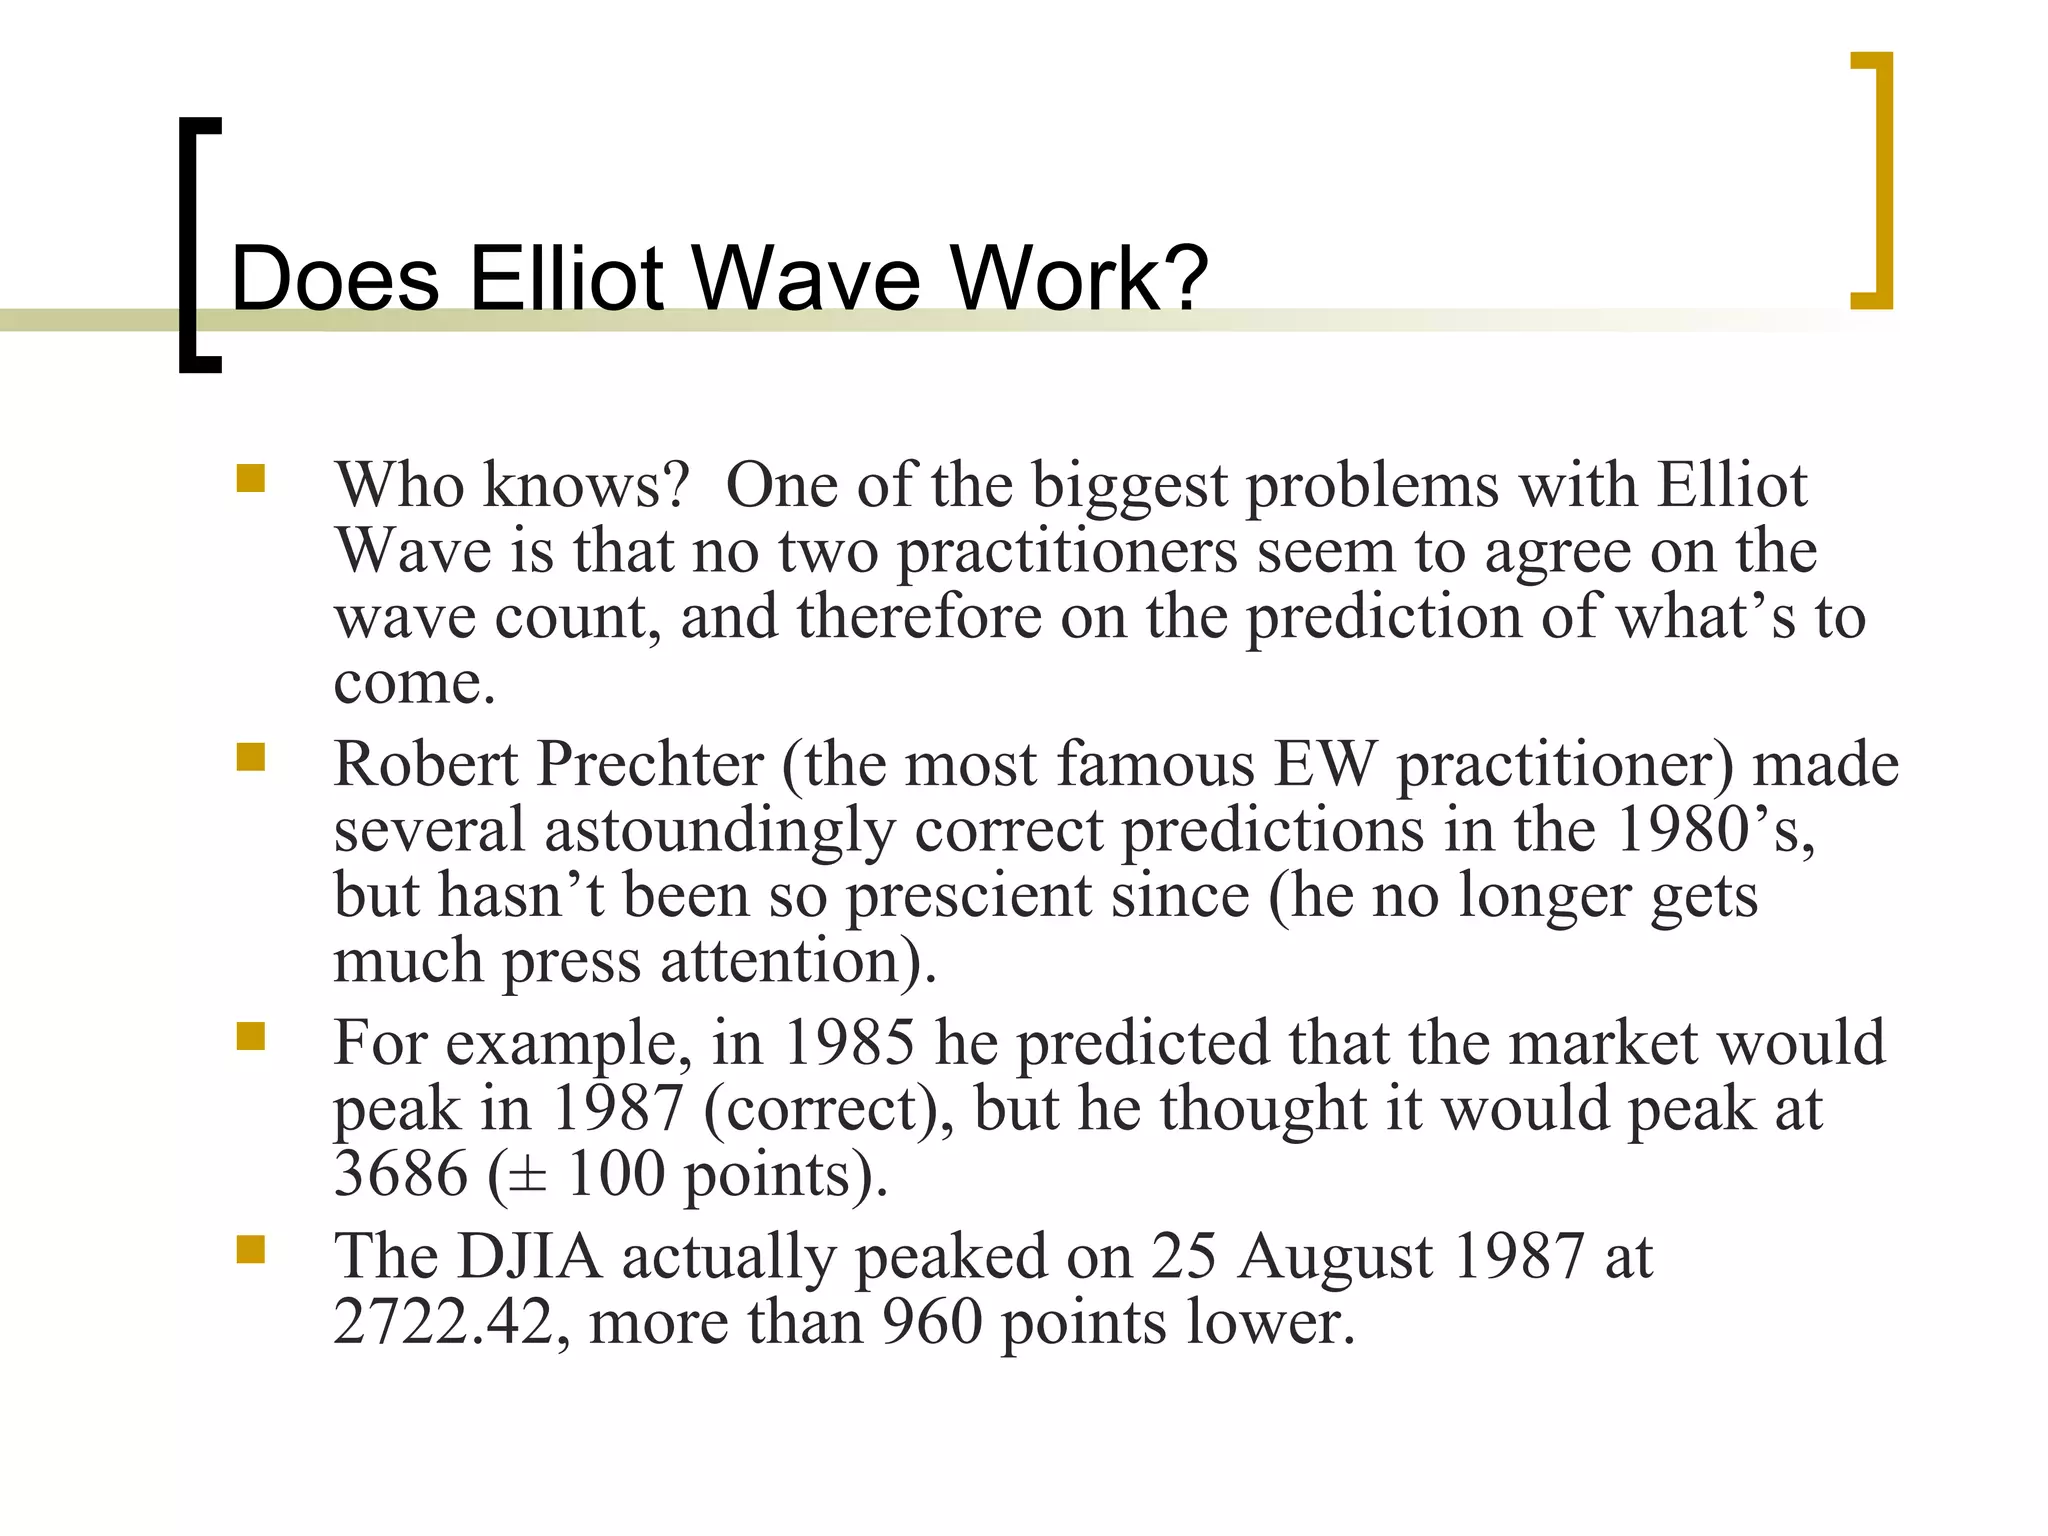
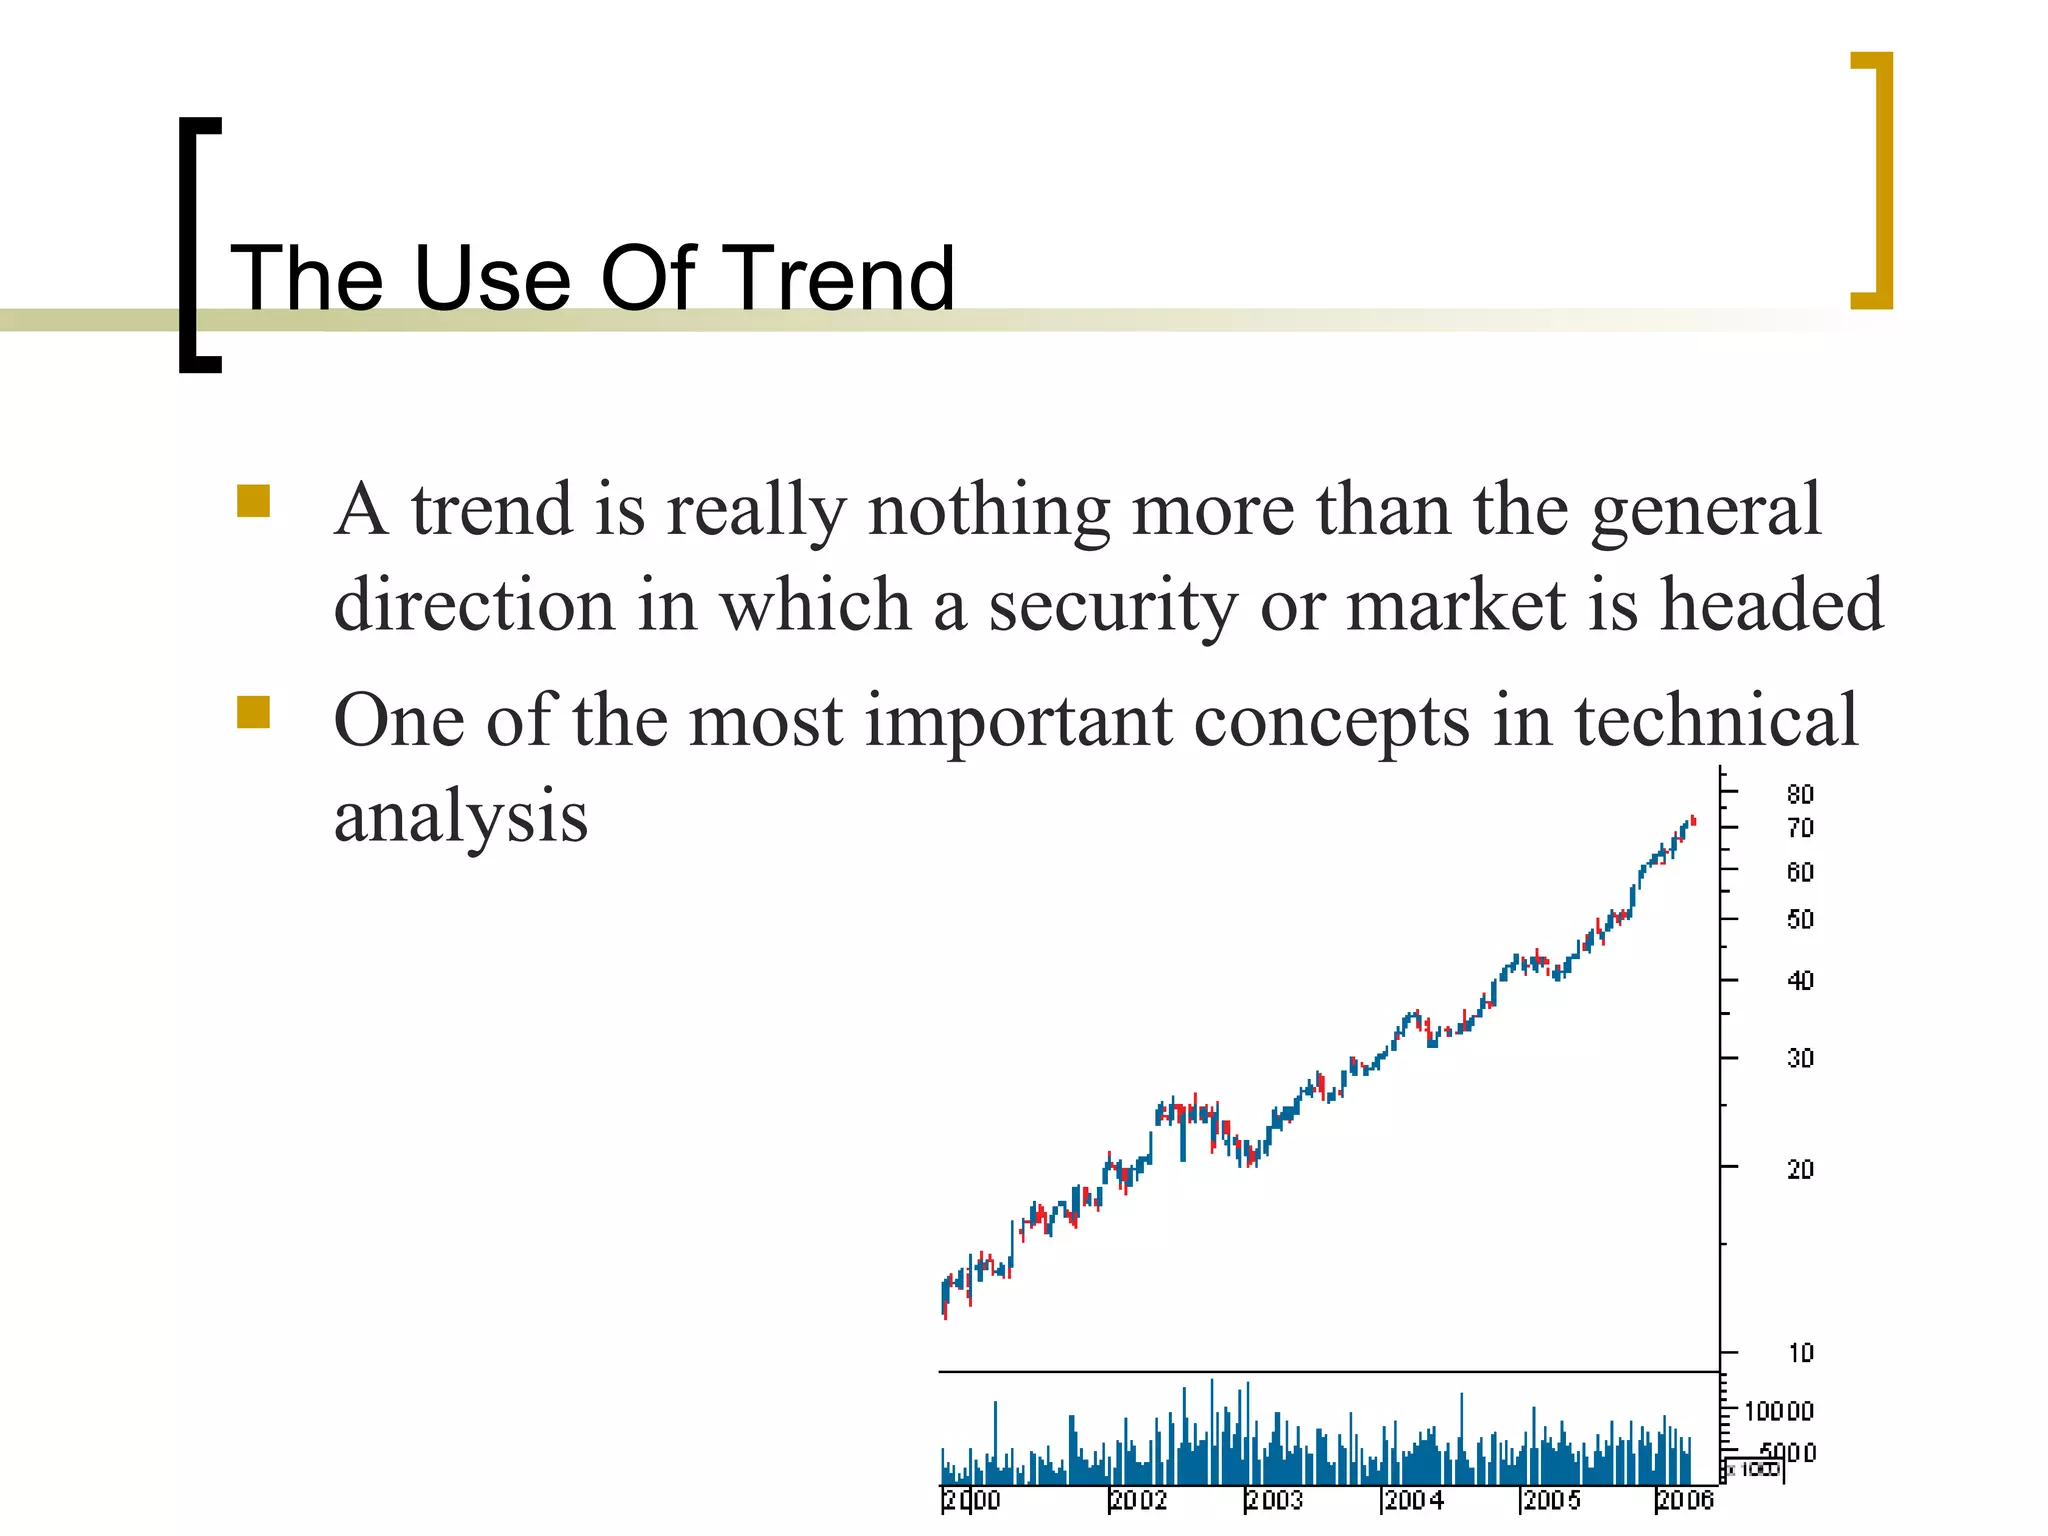
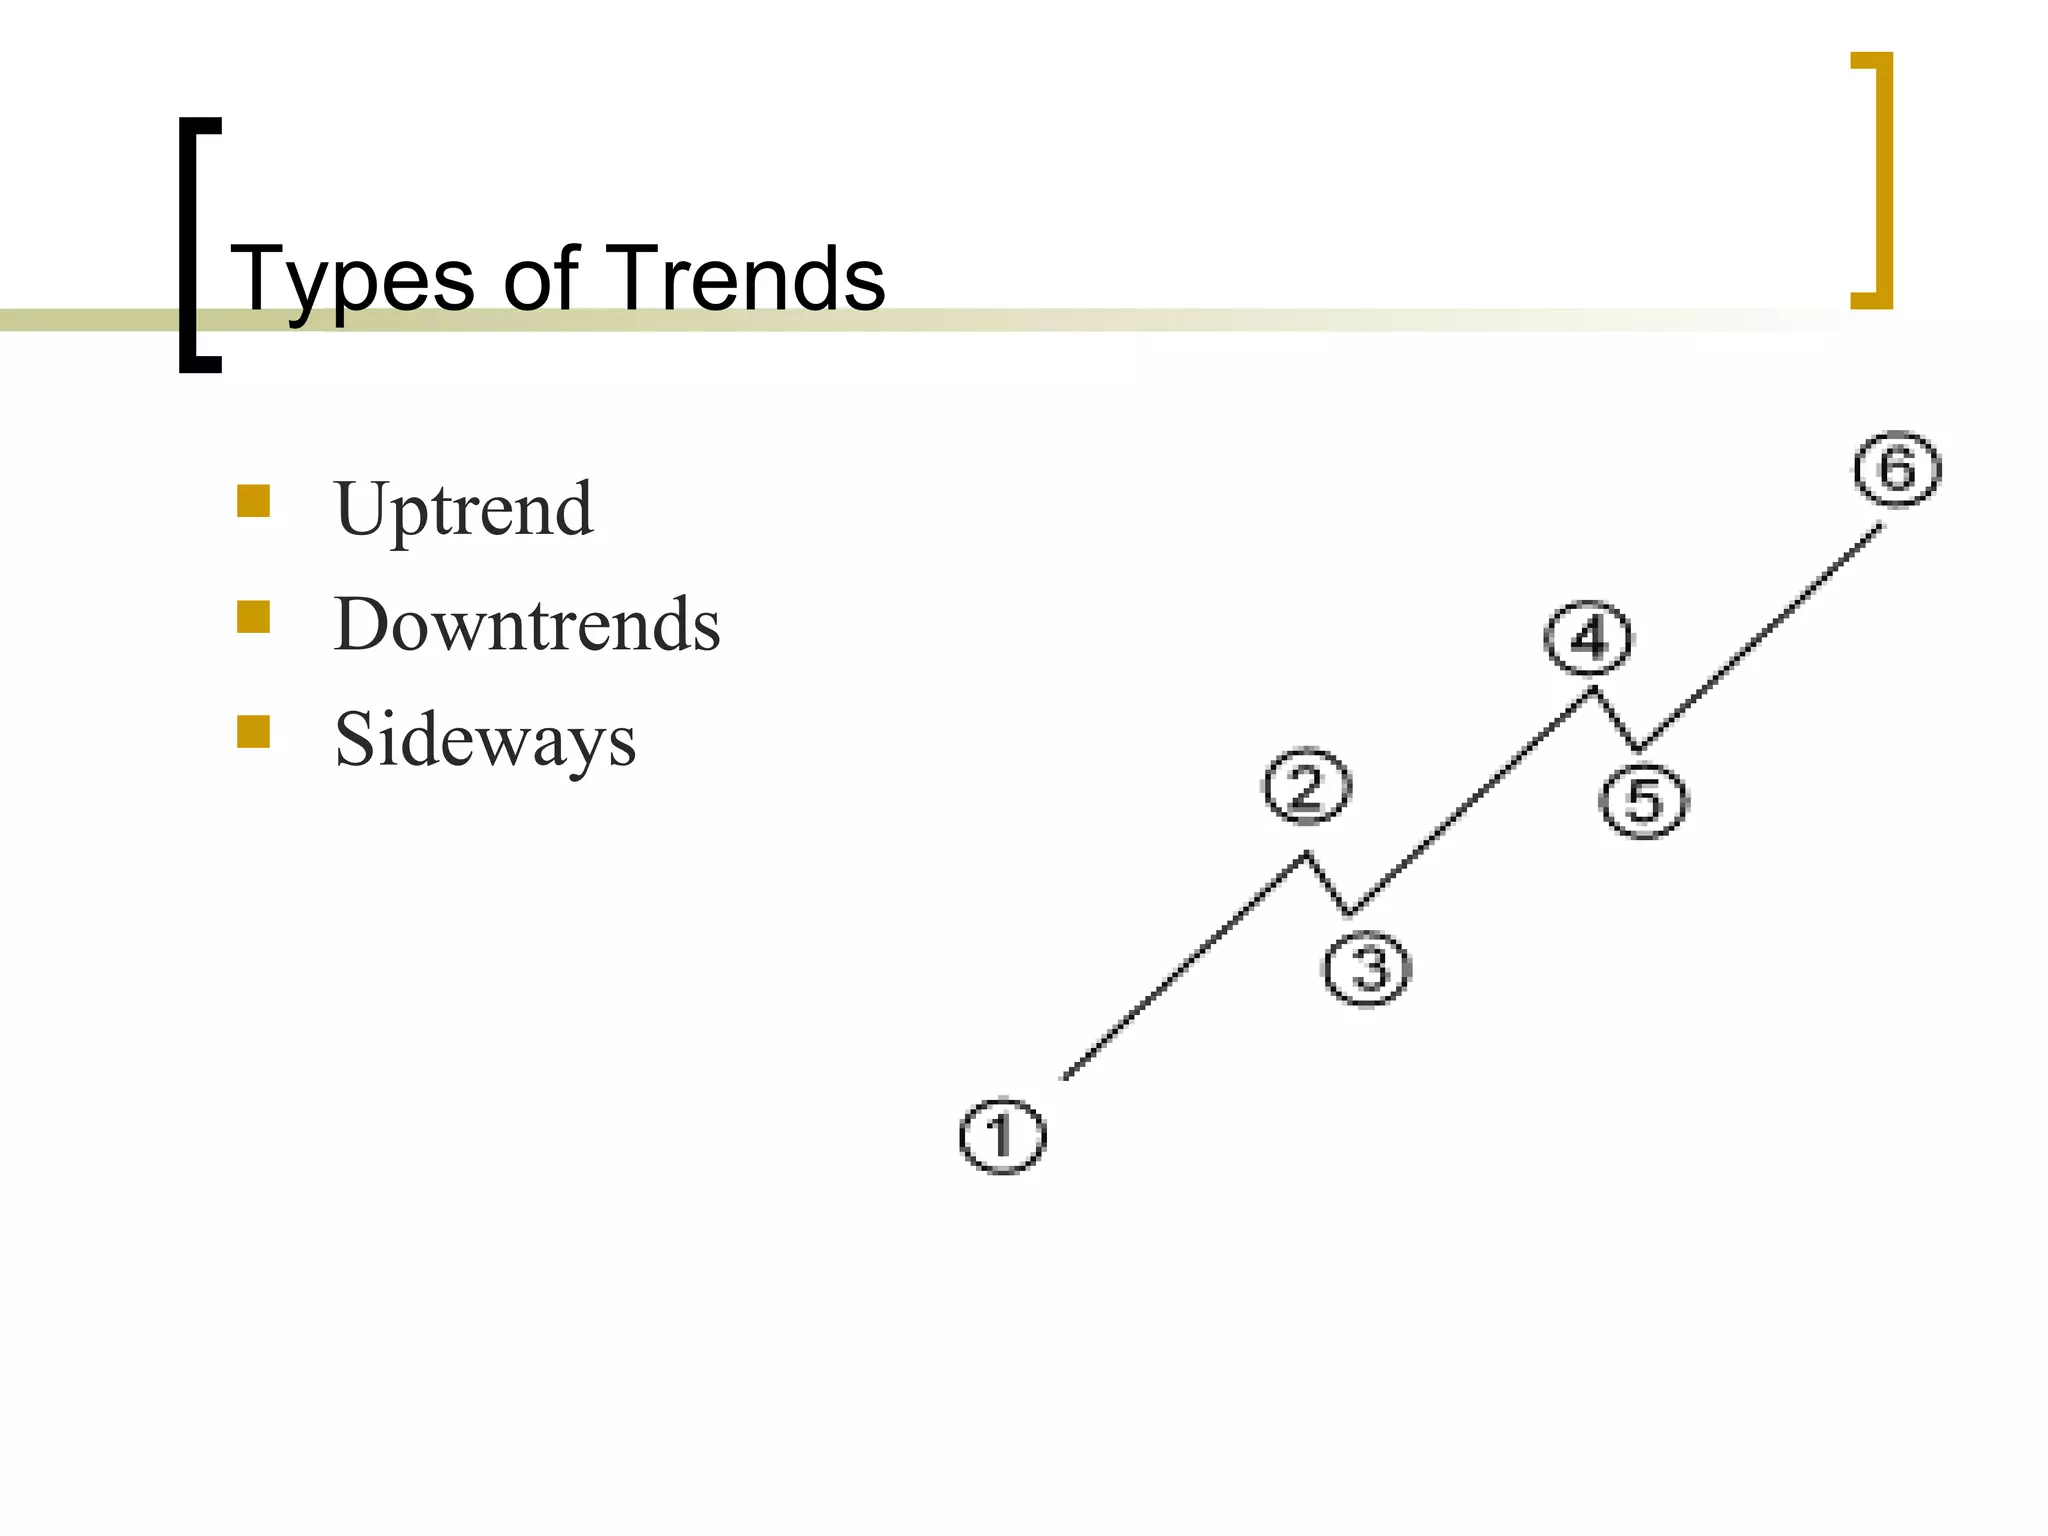
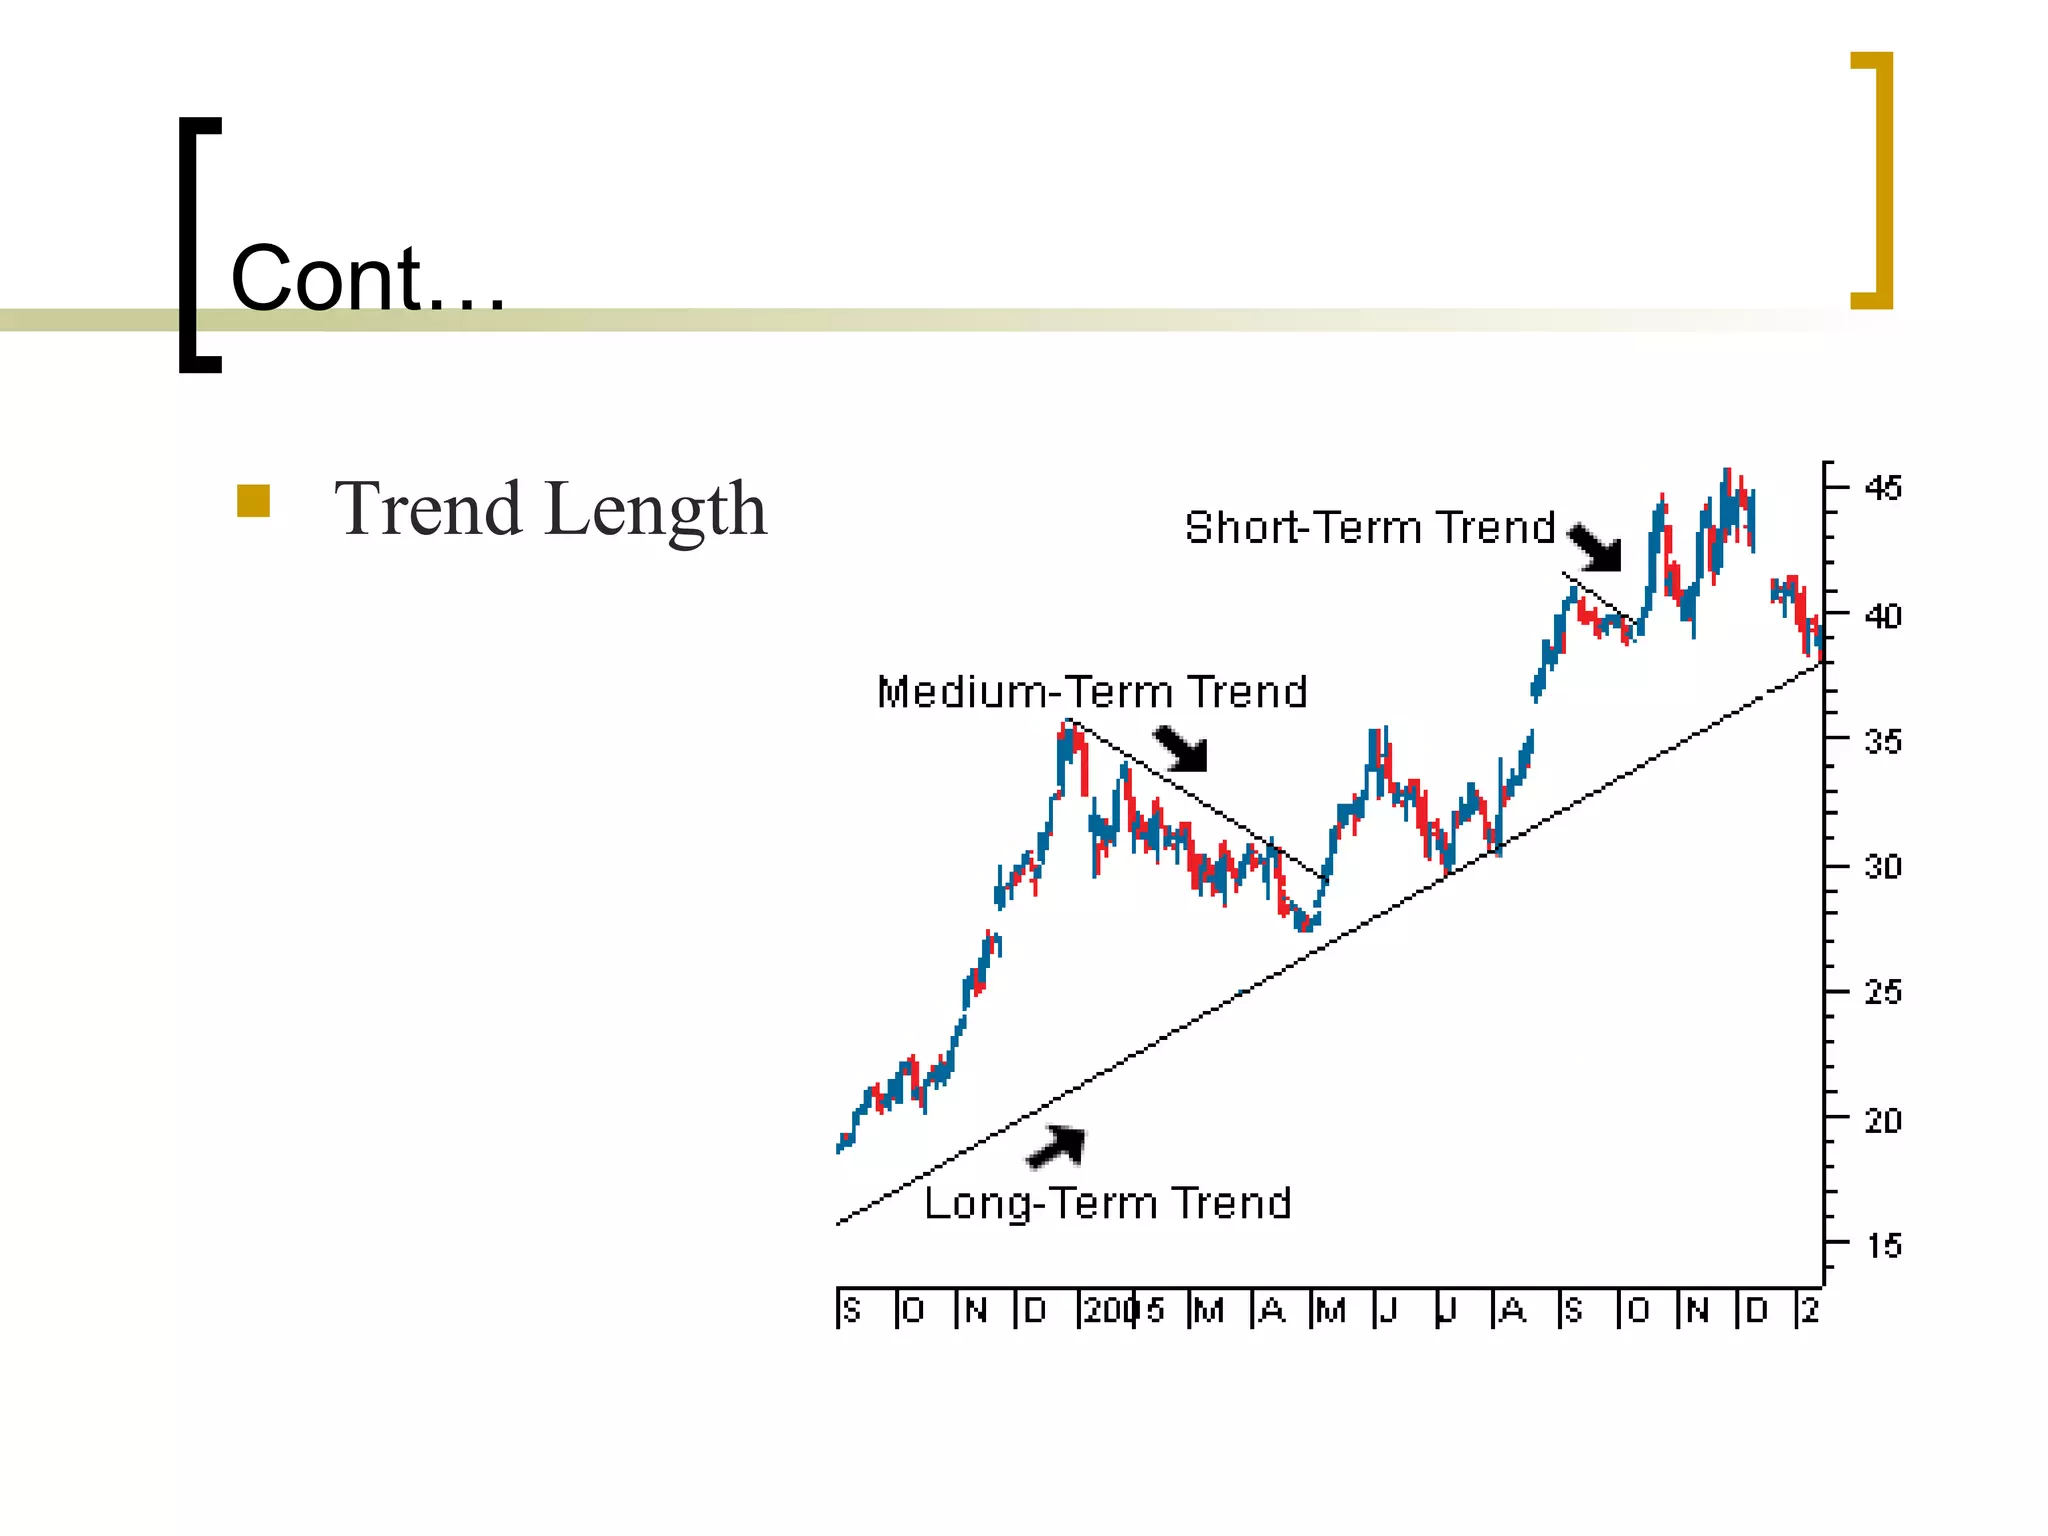
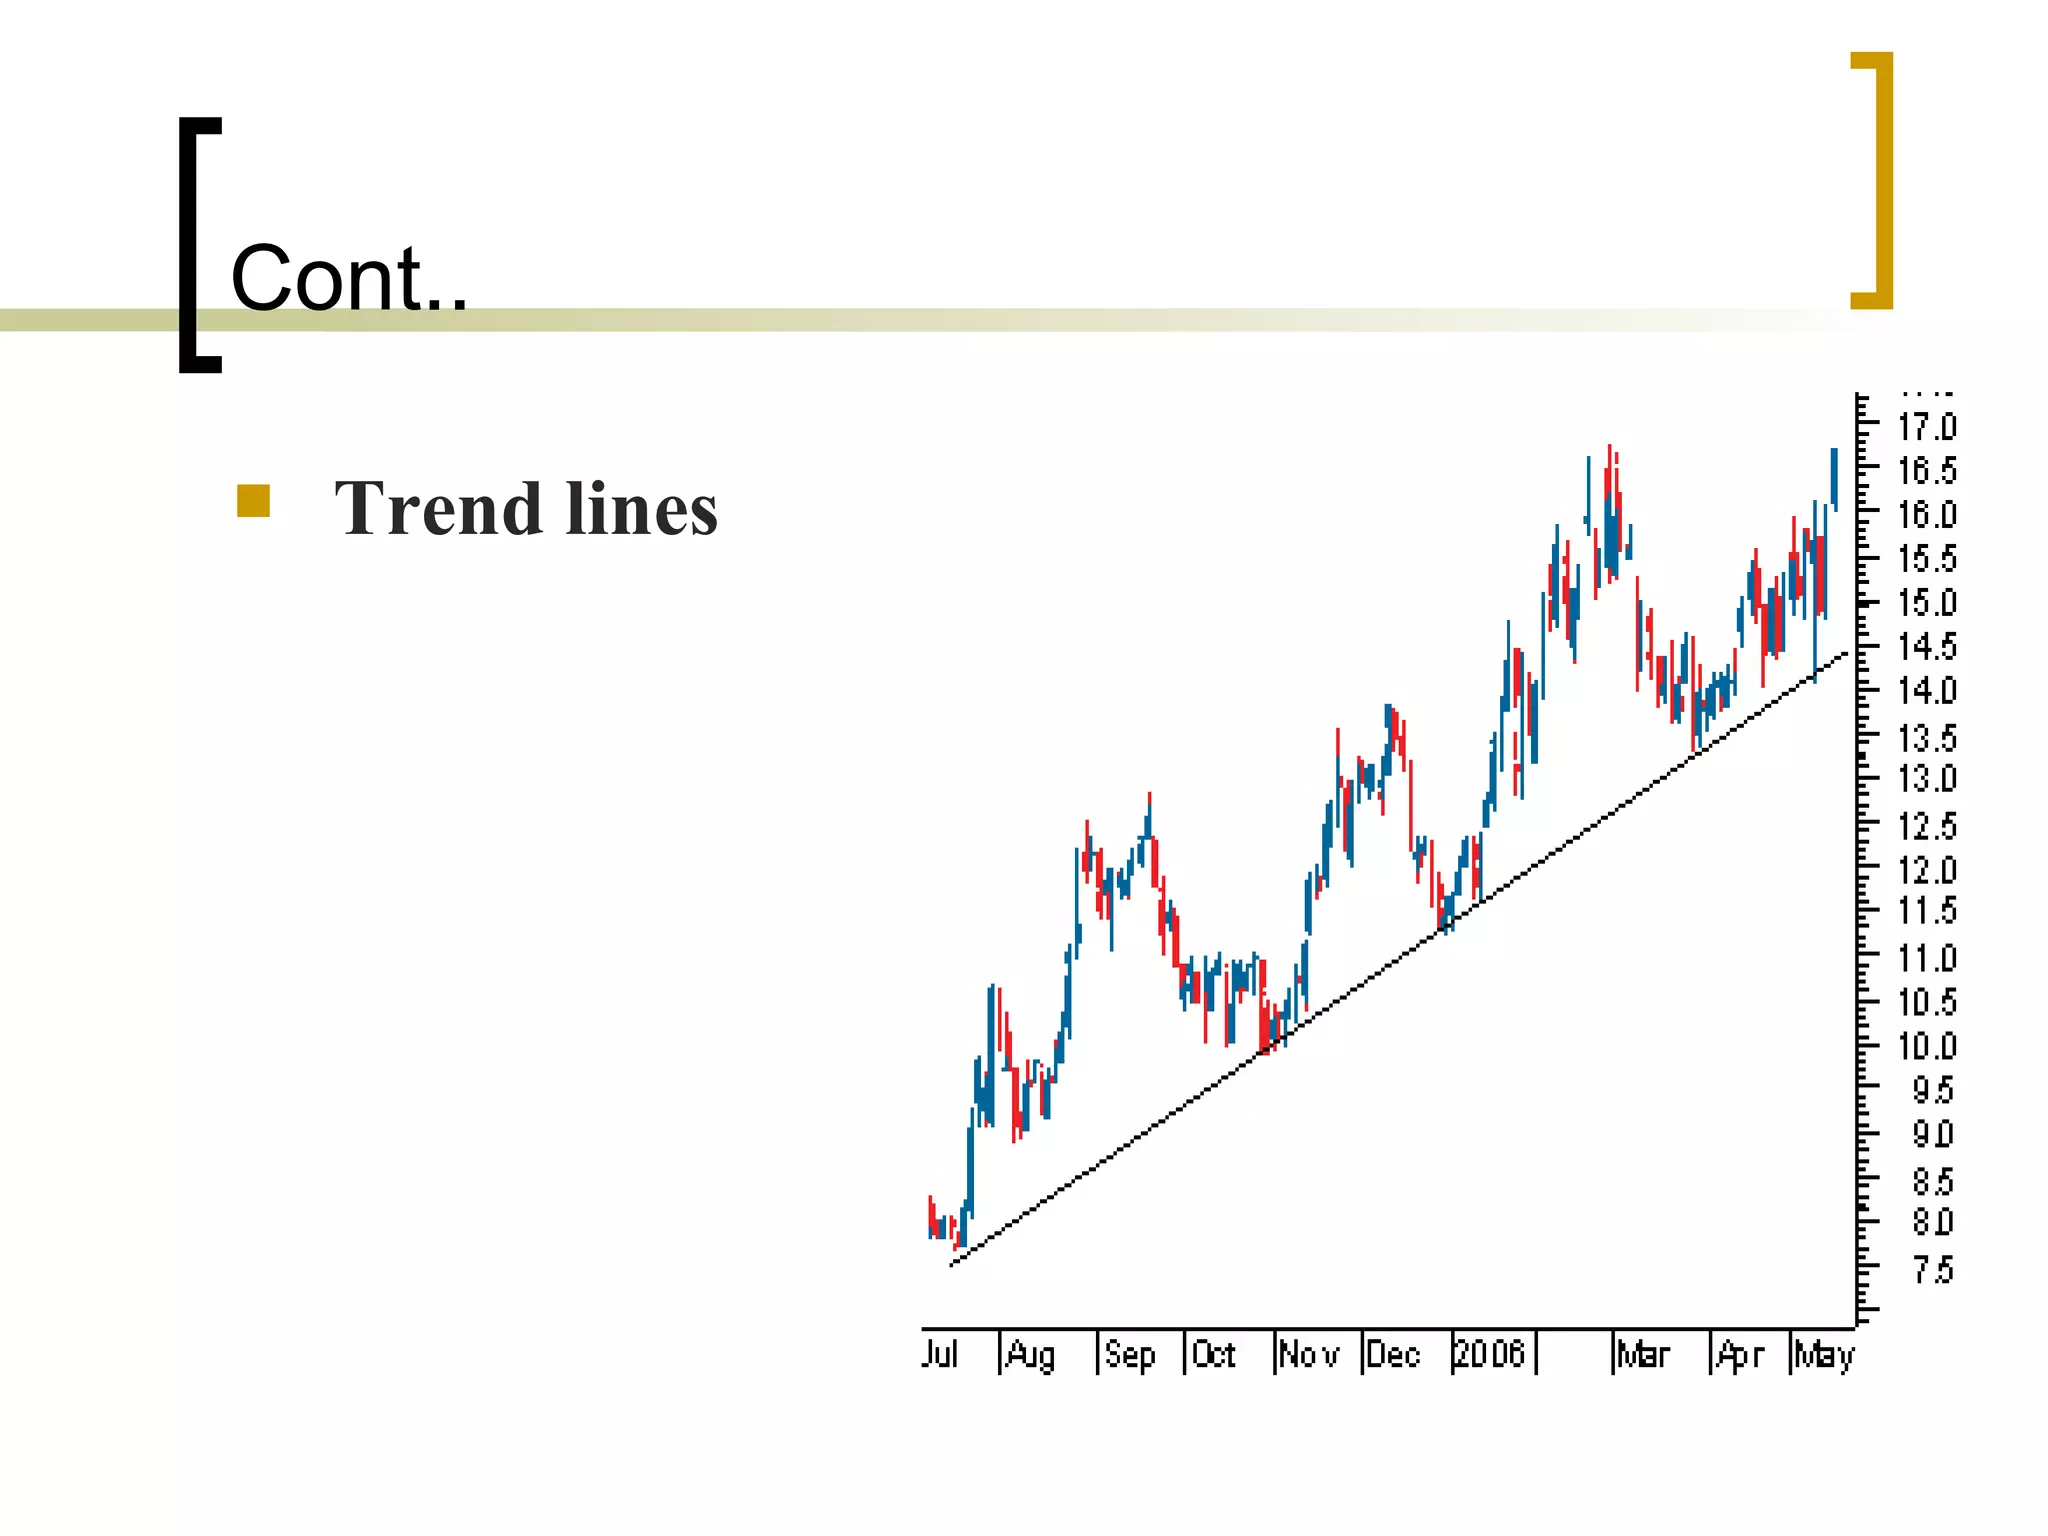
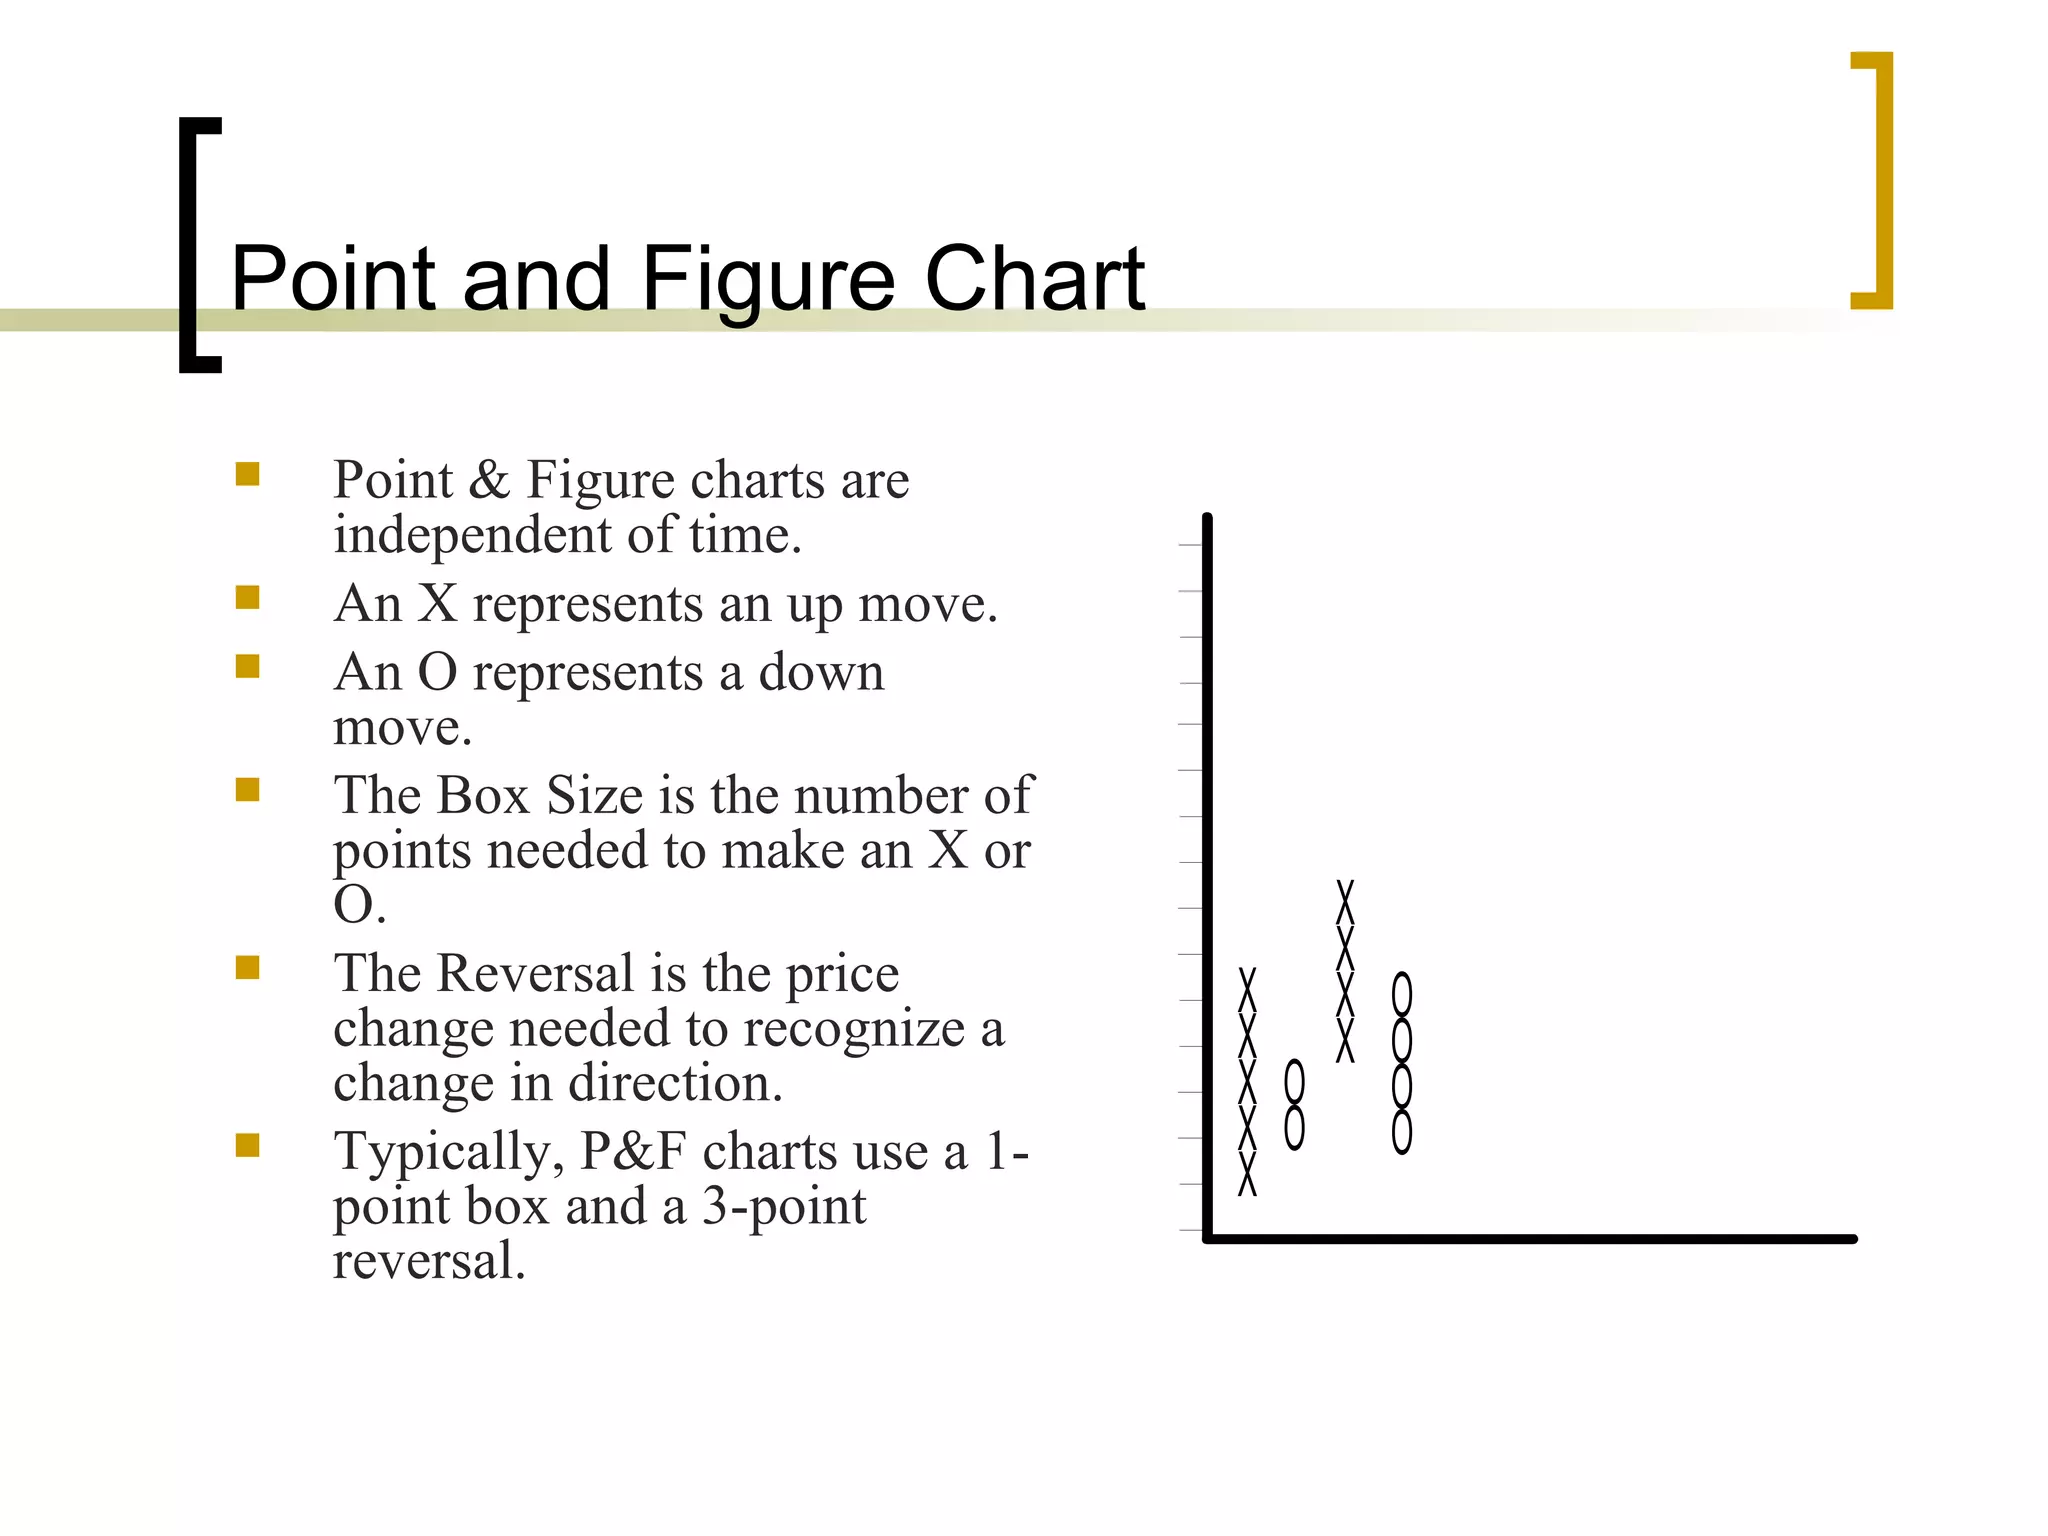
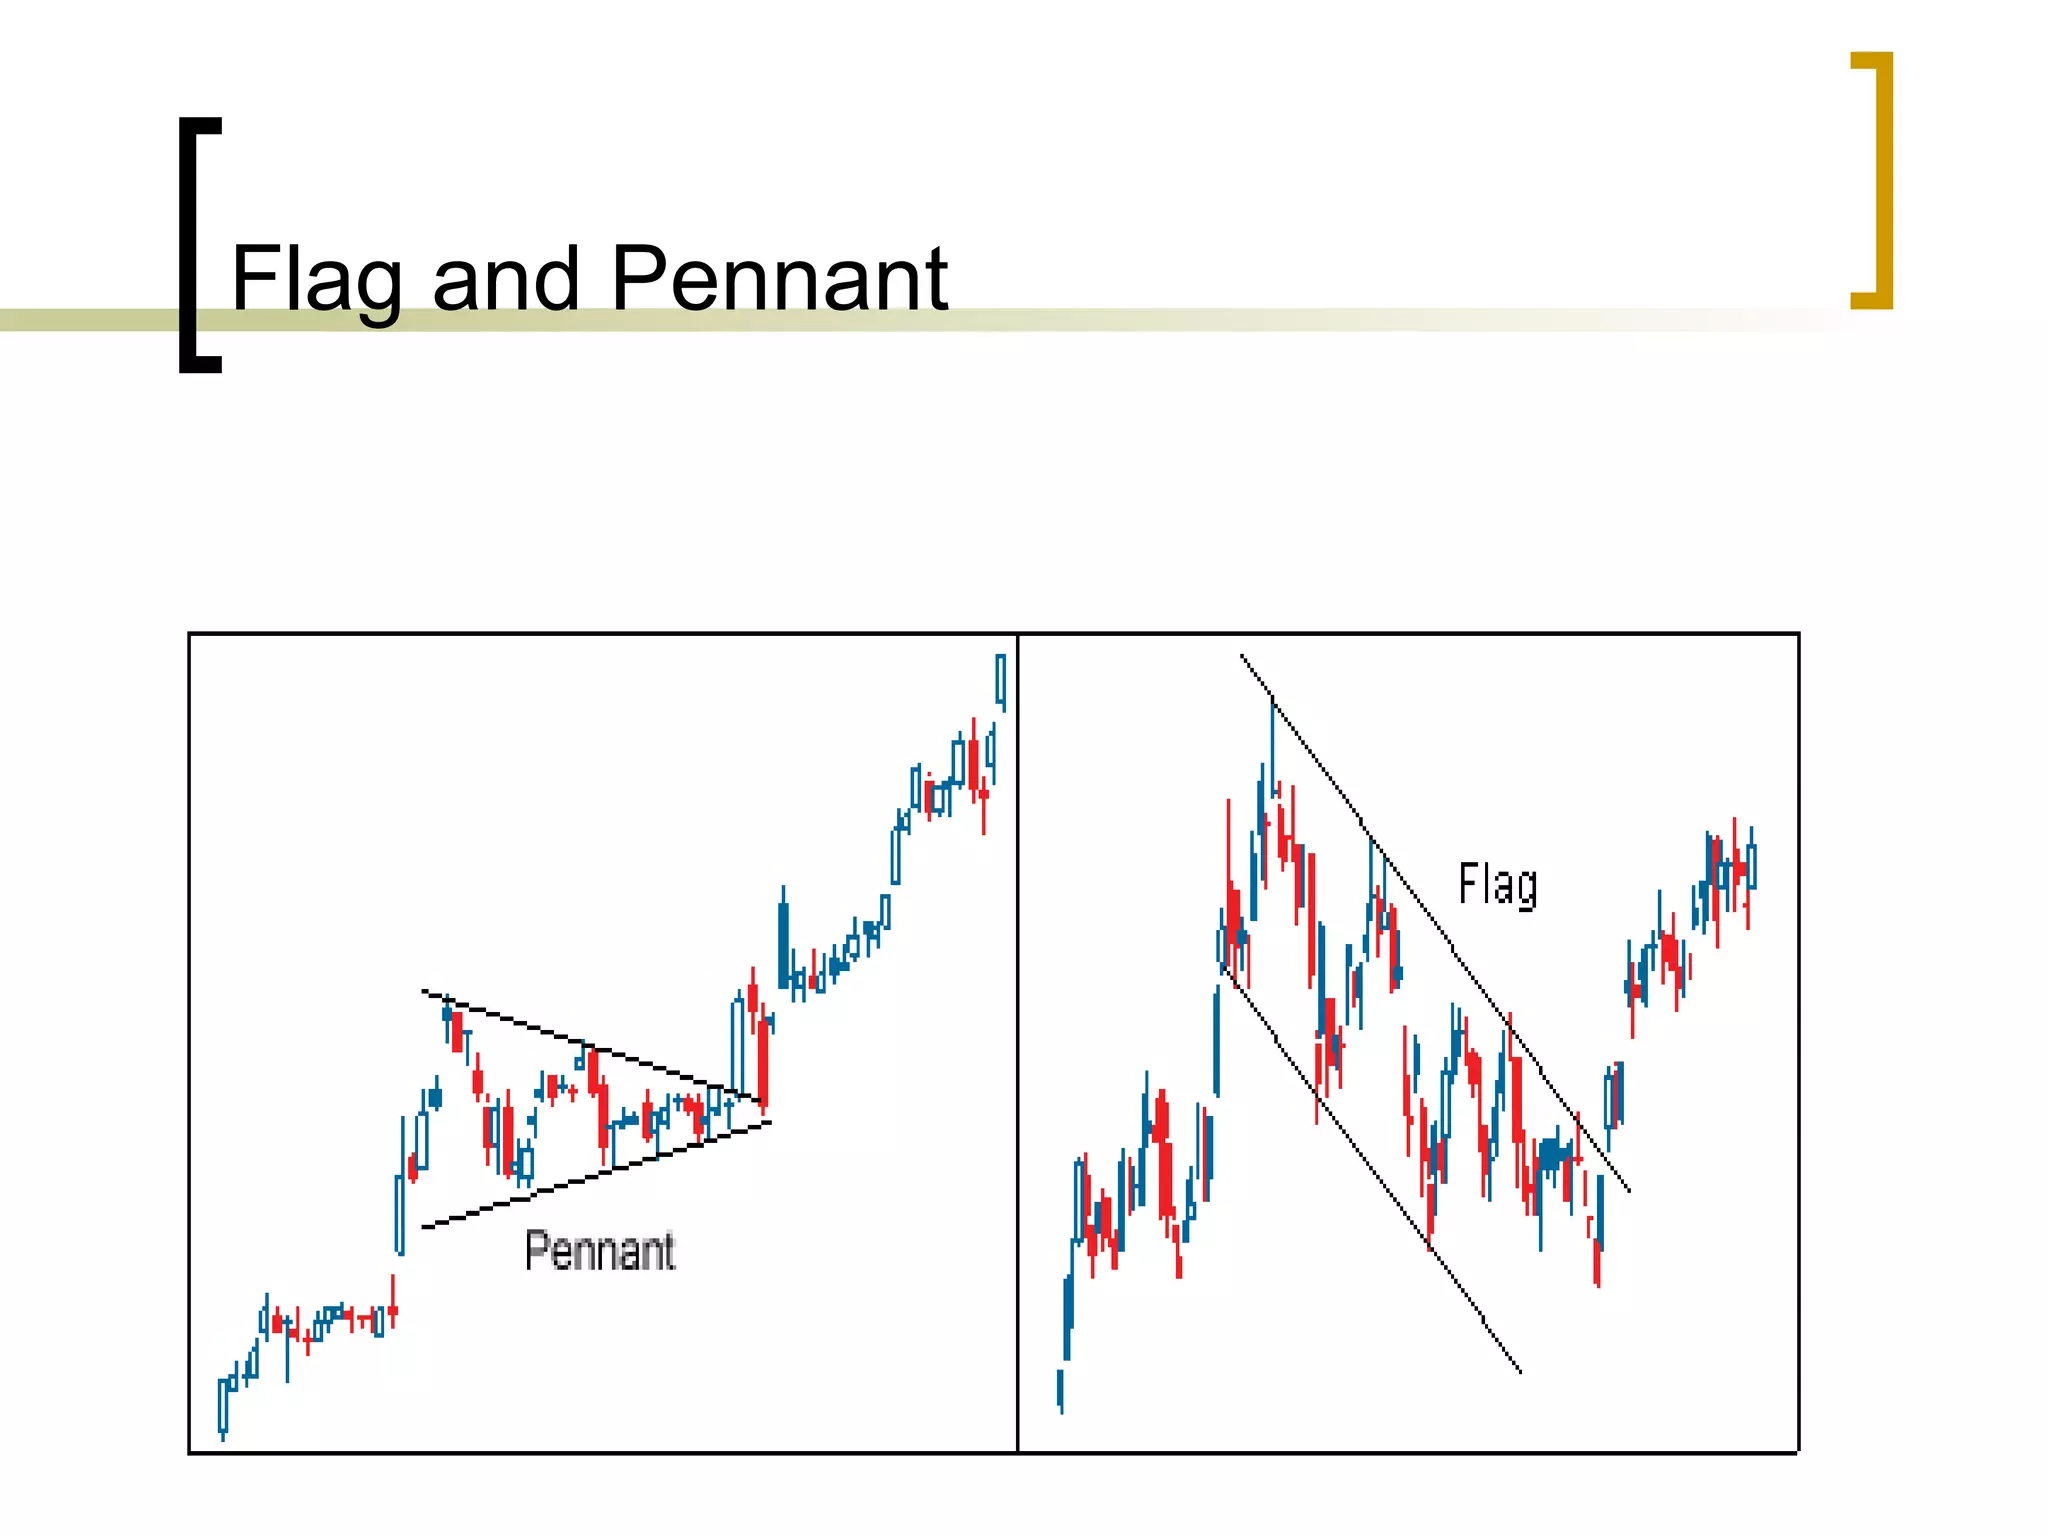
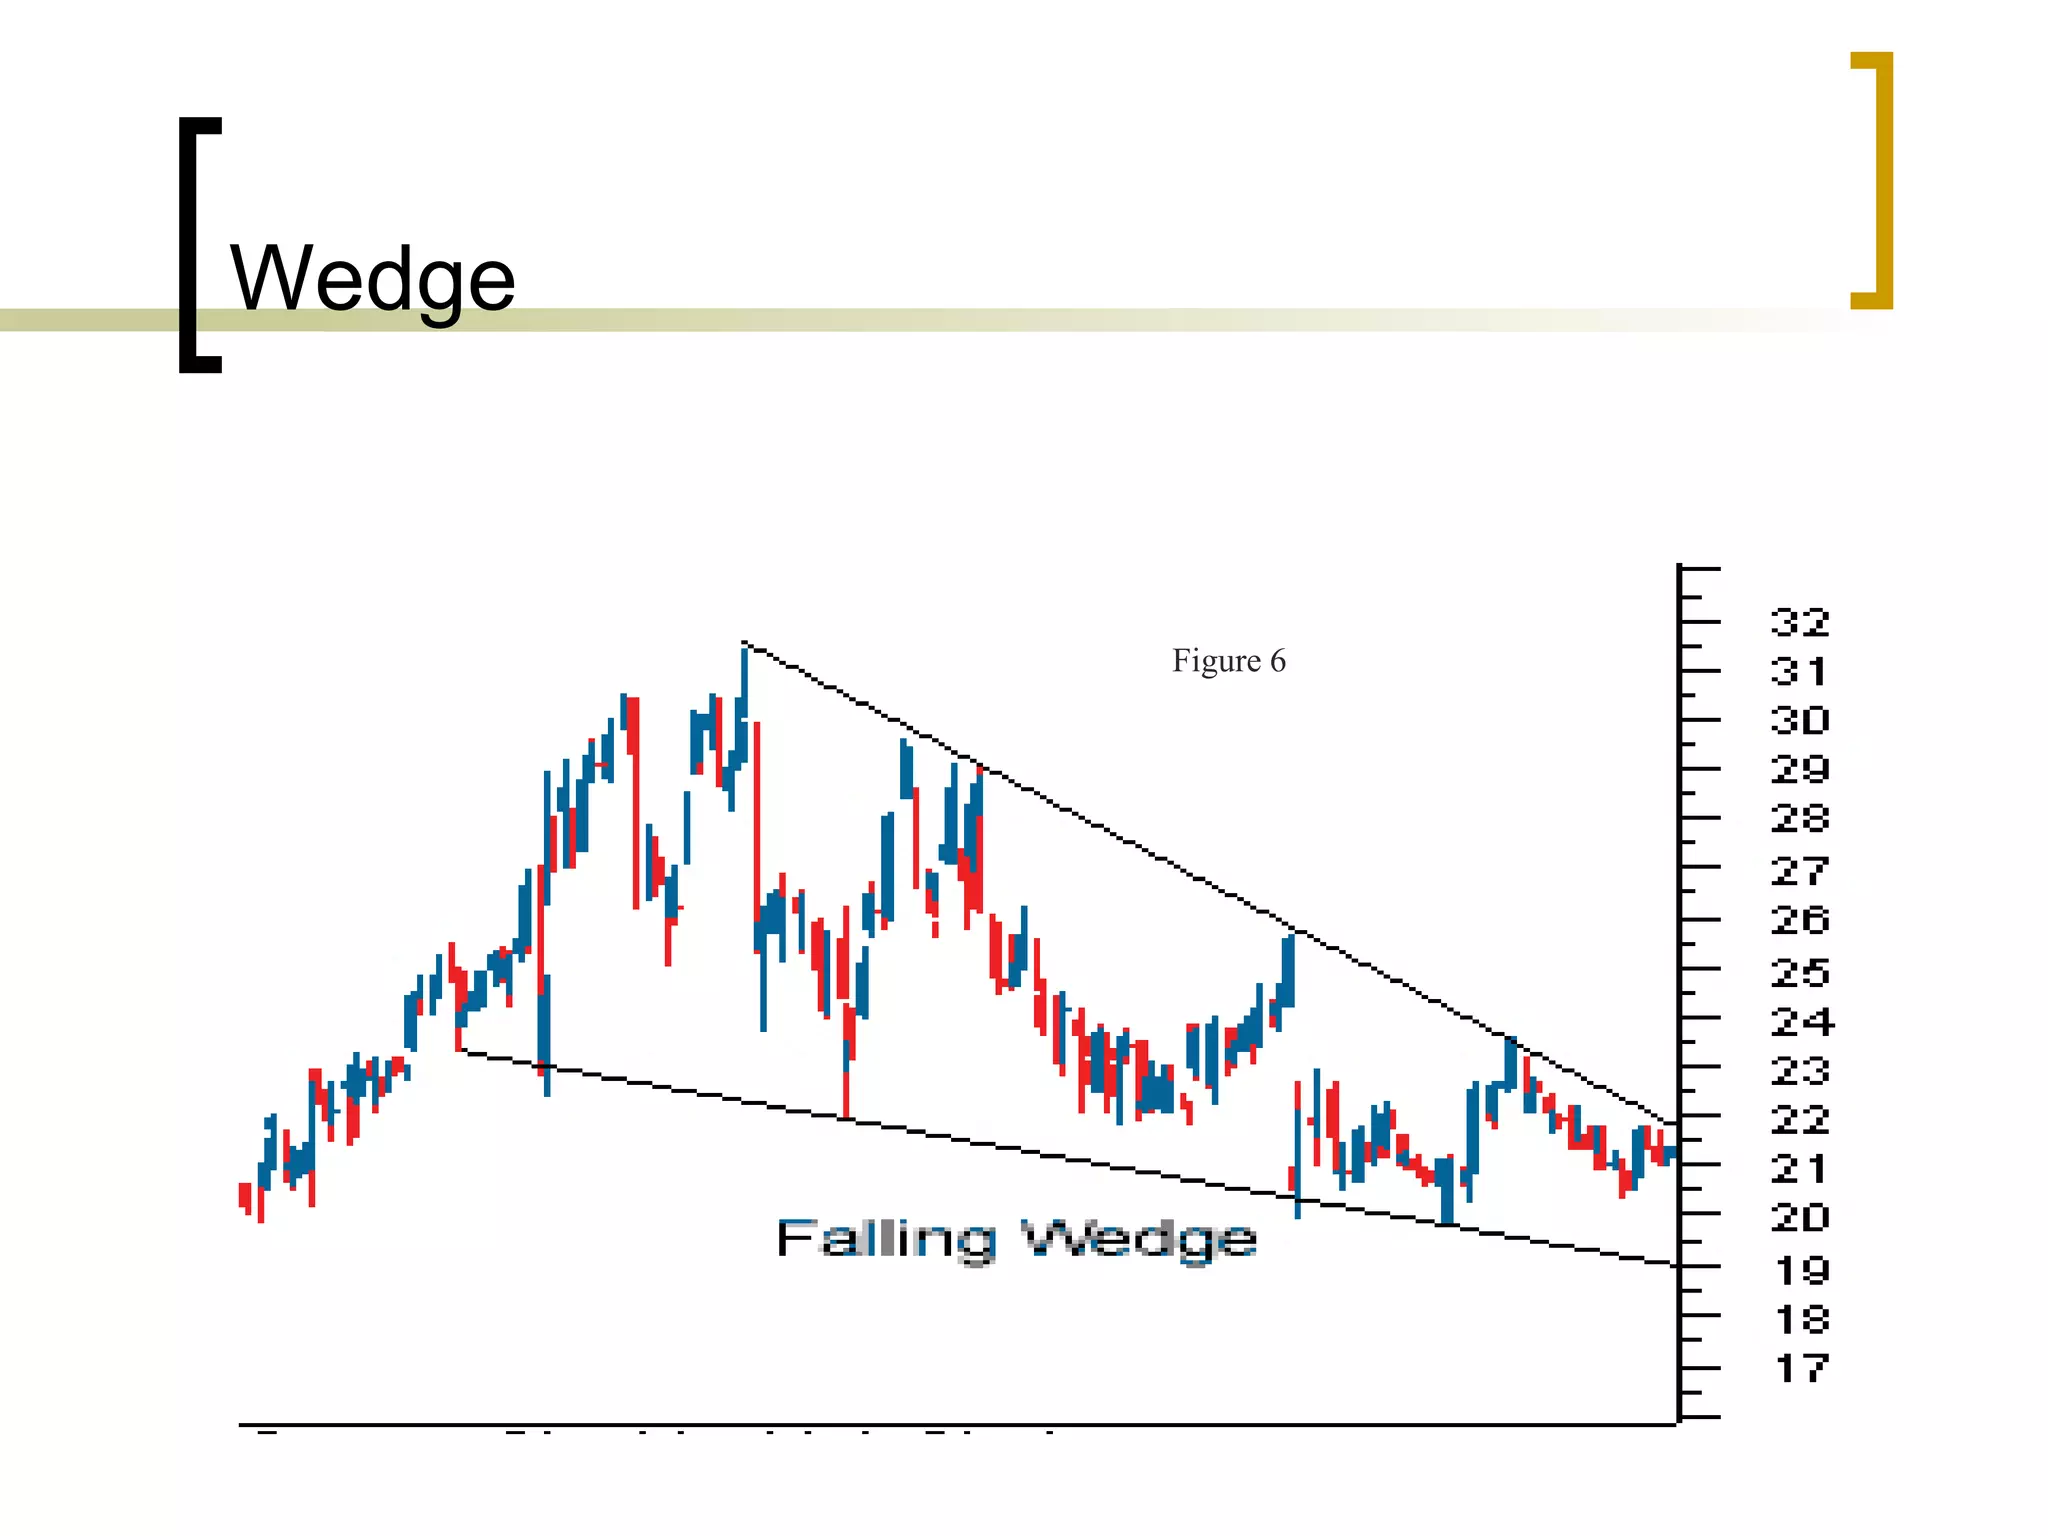
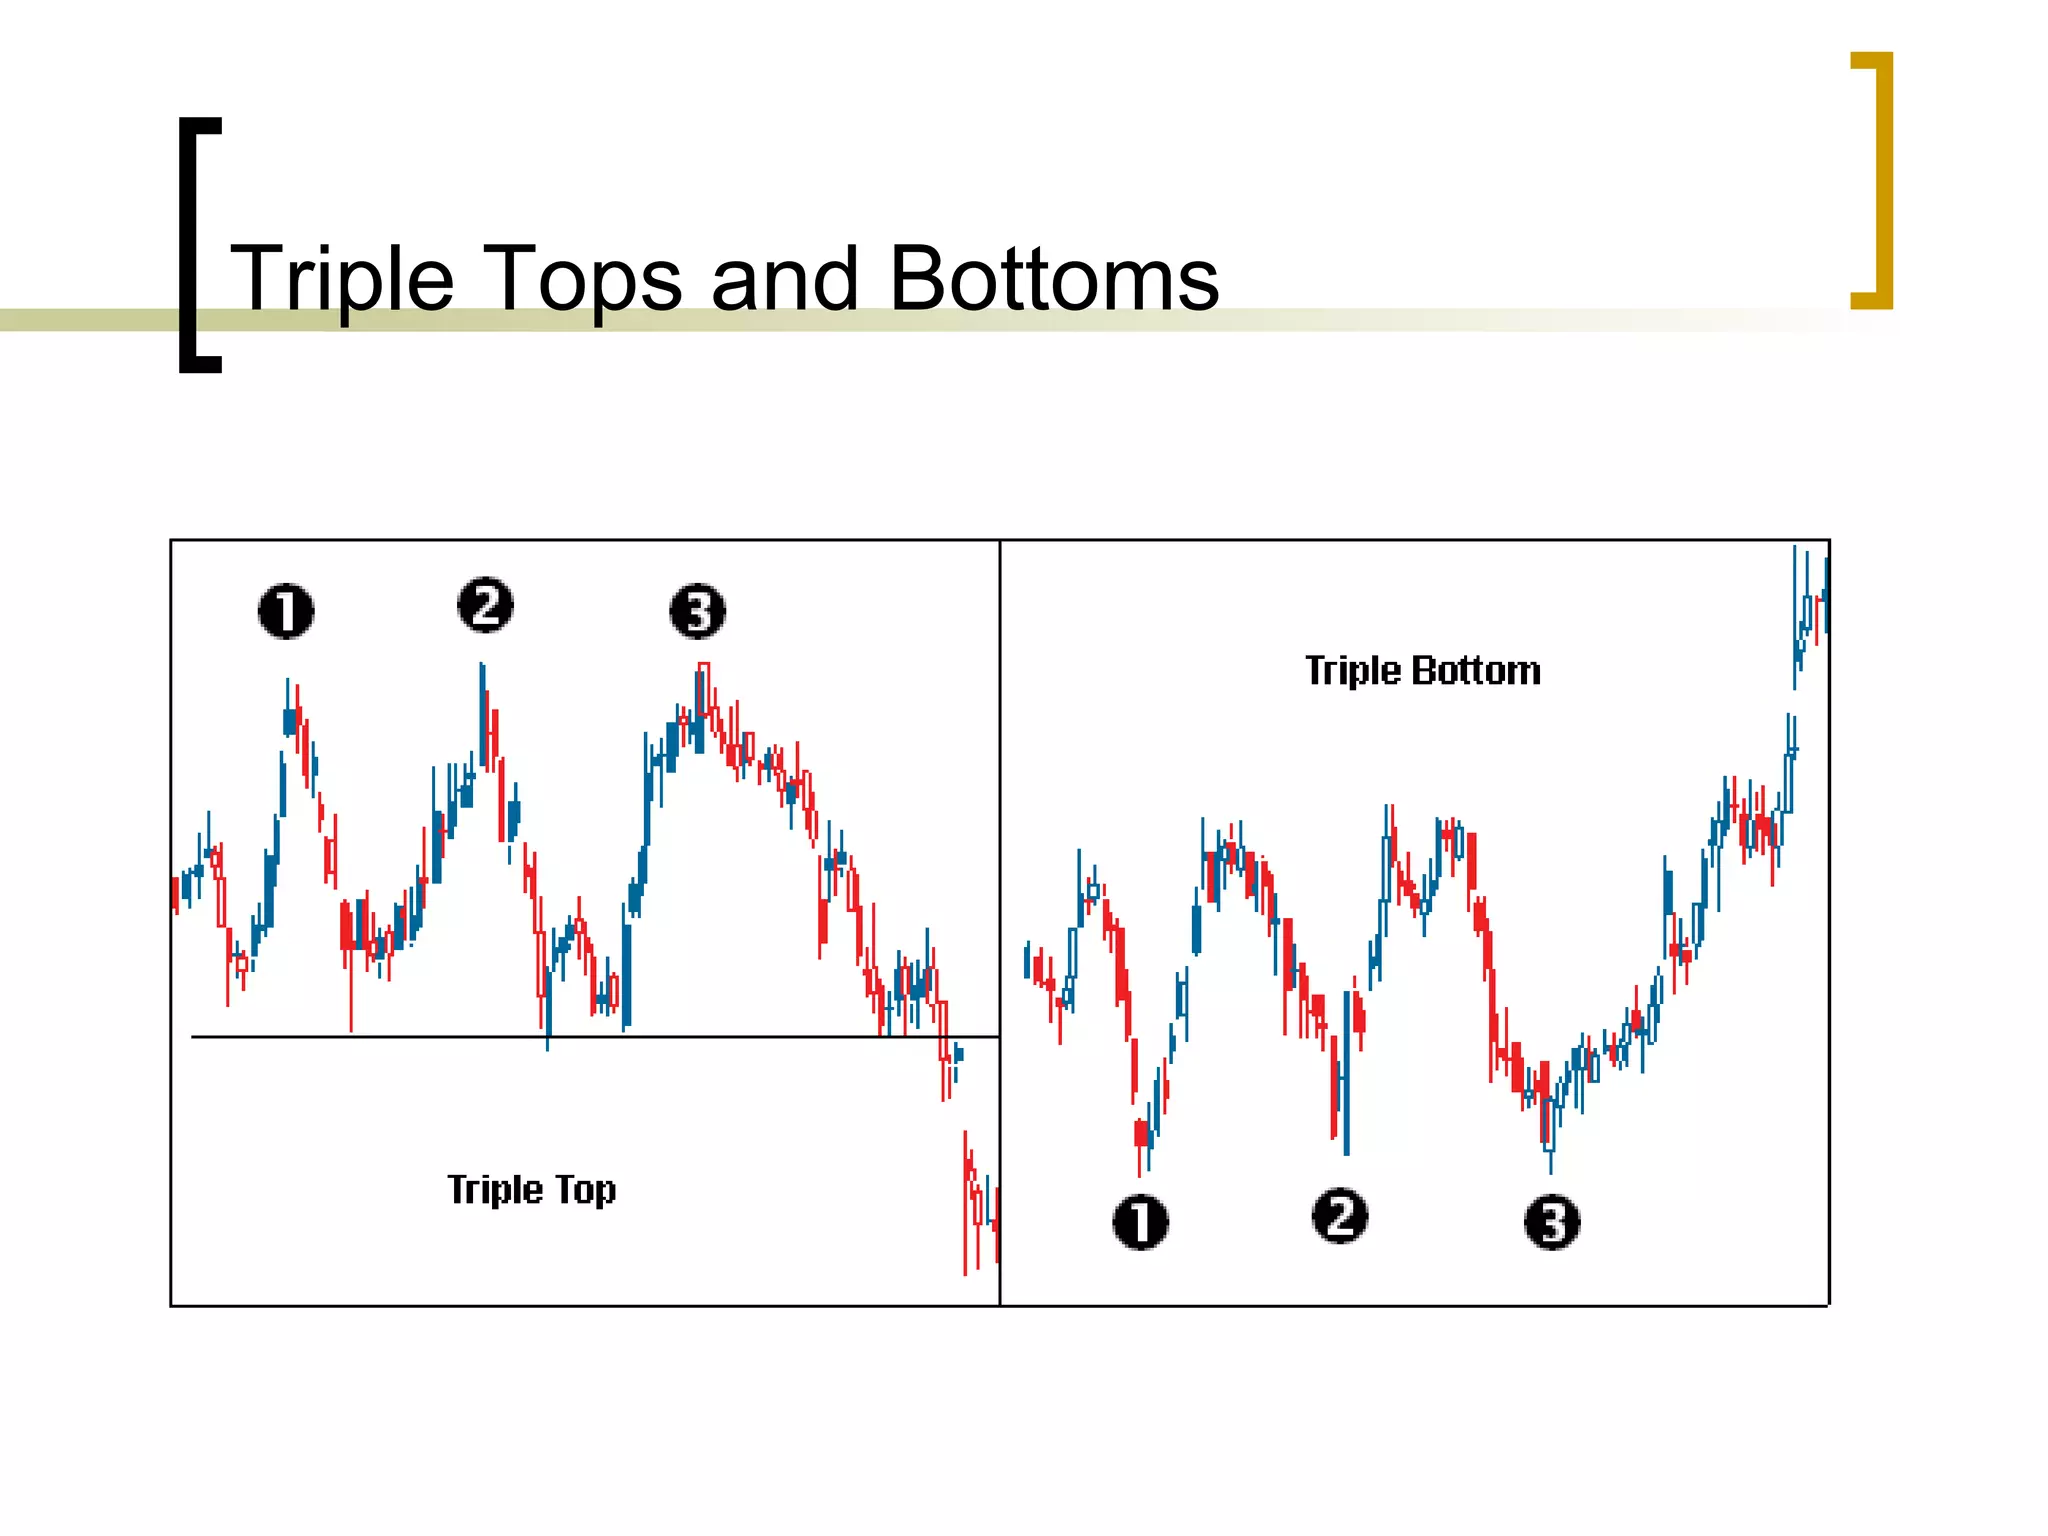
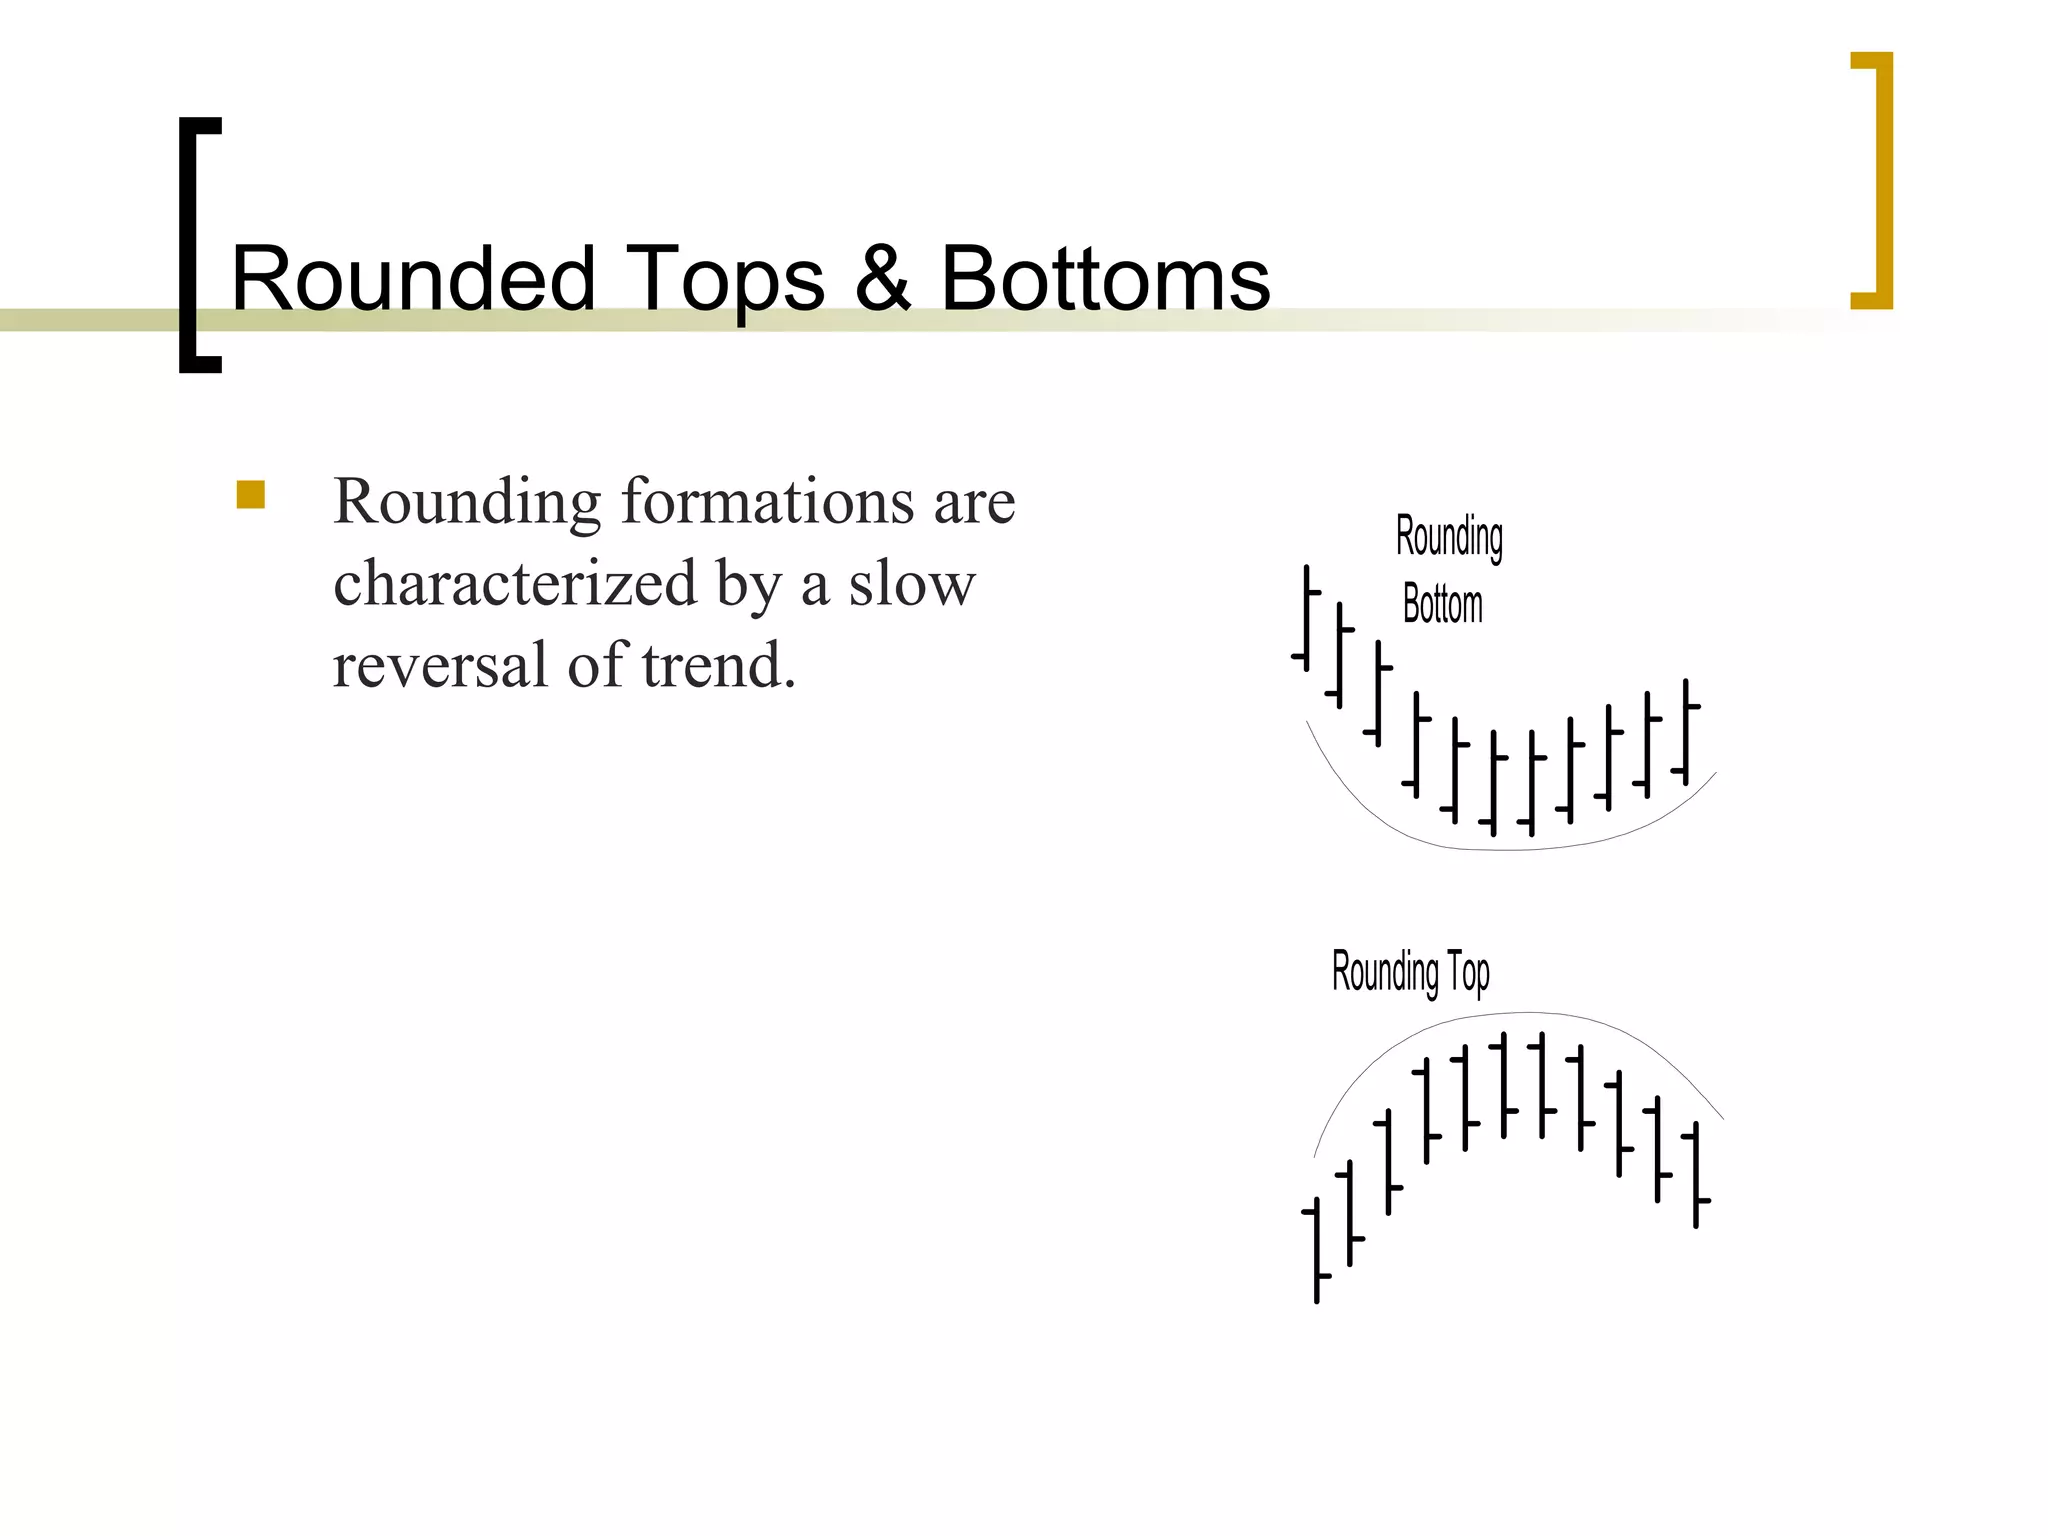
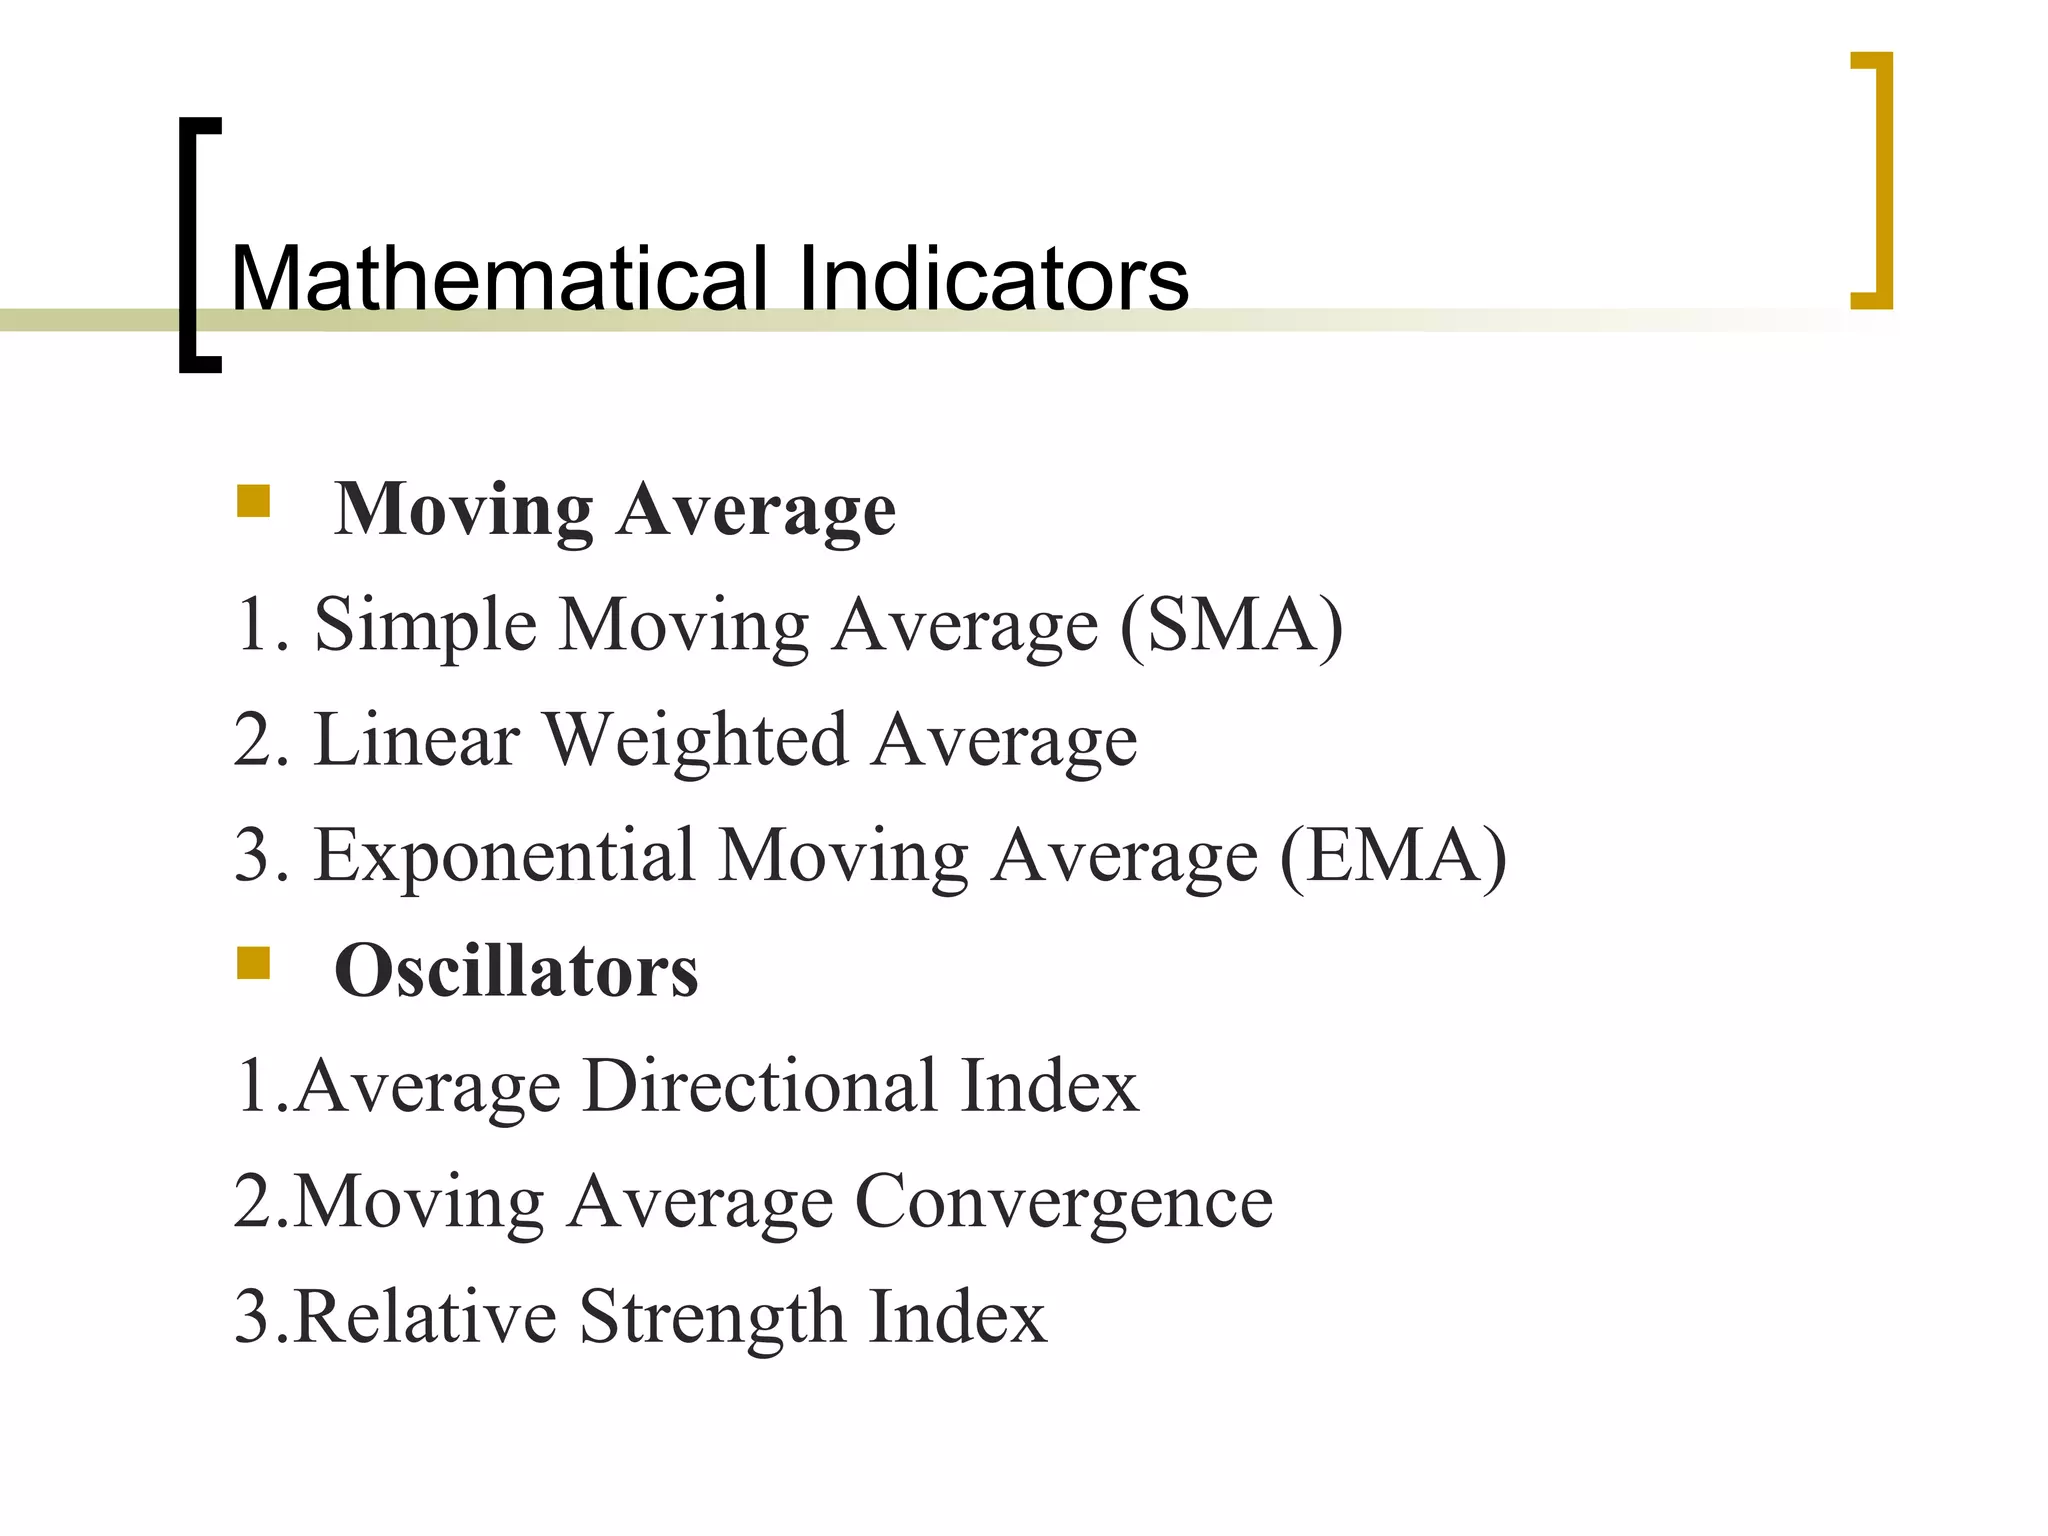
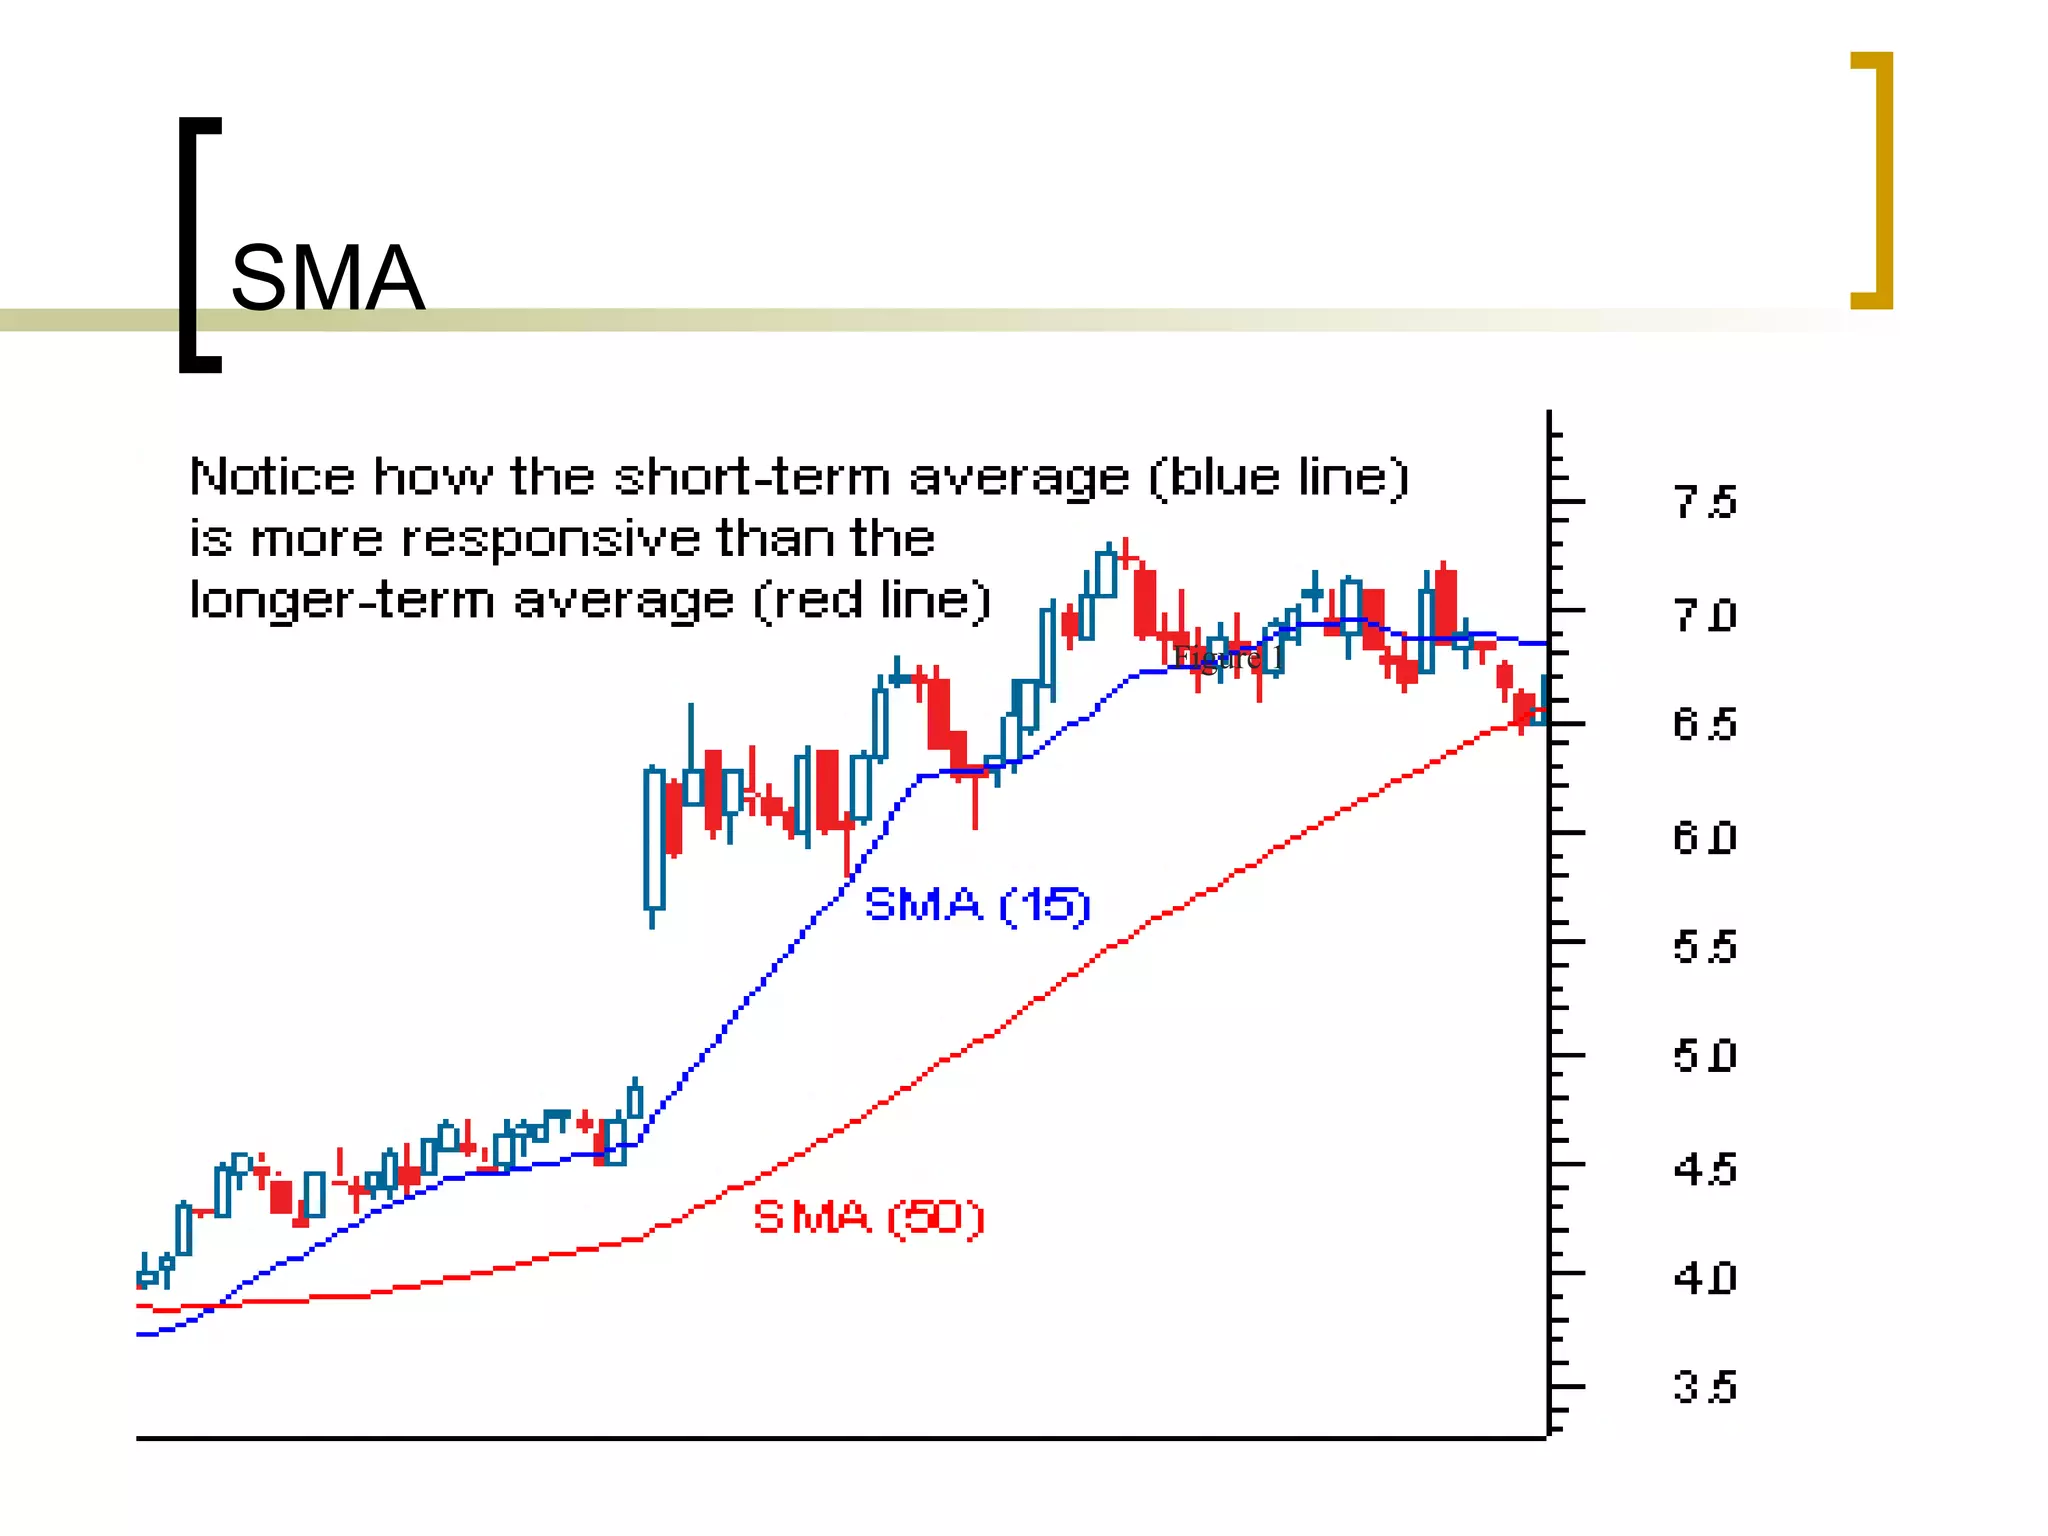
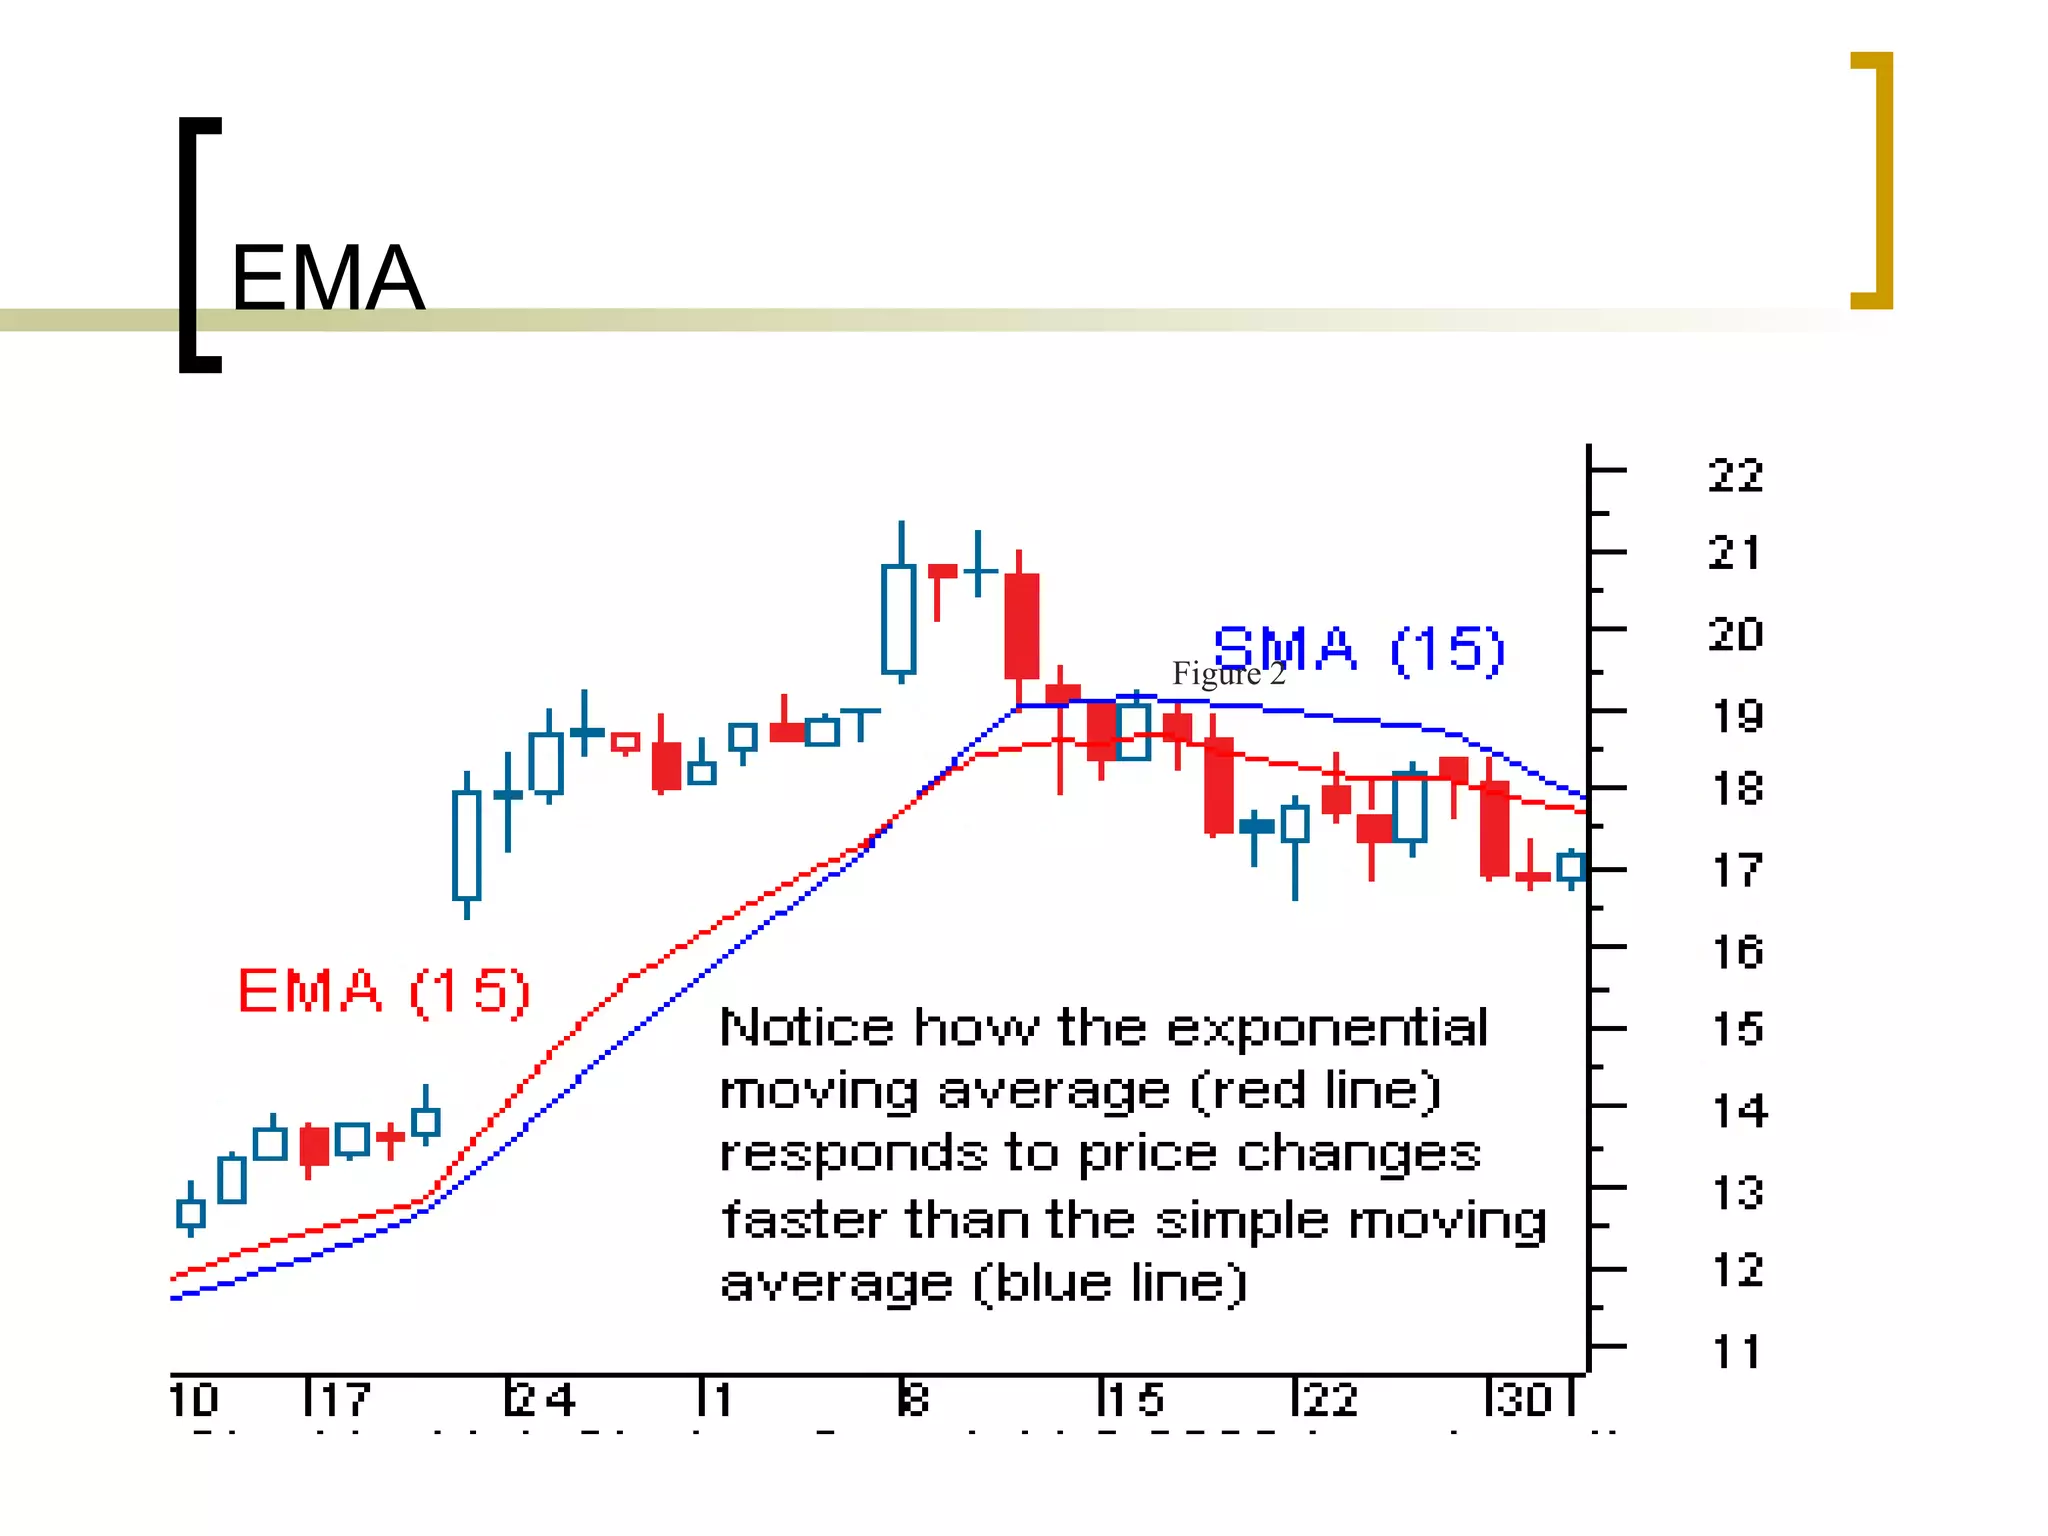
Technical analysis is a method of evaluating securities using market data like prices and volume to identify patterns that can predict future price movements. Key aspects of technical analysis include trends, support and resistance levels, volume, chart patterns, and mathematical indicators. Trends can be up, down, or sideways. Support and resistance levels indicate where prices are likely to stop or reverse. Volume is used to confirm patterns and trends. Common chart patterns include head and shoulders, triangles, and flags. Popular indicators include moving averages, MACD, and RSI. While technical analysis uses historical data, critics argue this approach cannot consistently predict future prices according to the efficient market hypothesis.