Downloaded 11 times
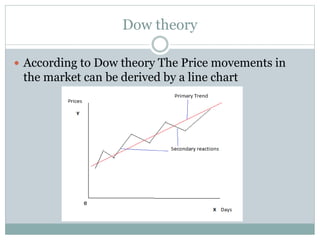
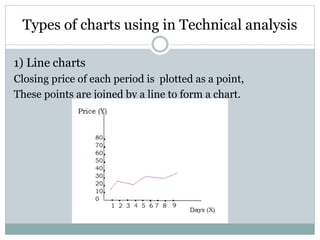
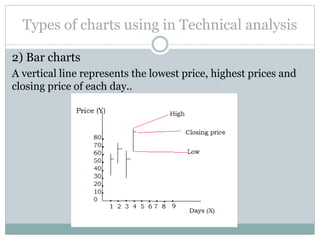

Technical analysis is a method of evaluating securities by analyzing statistics generated by market activity, such as past prices and volume. Charts are used to identify patterns in price movements and predict future trends. The basic premise is that prices tend to move in trends or waves that are upward or downward over time. Dow theory from the early 1900s laid the foundations for technical analysis and looked at primary, secondary and minor movements in stock prices. Common chart types used are line charts, bar charts, and pattern charts. Mathematical indicators like simple and exponential moving averages are also used to identify trends in price data.