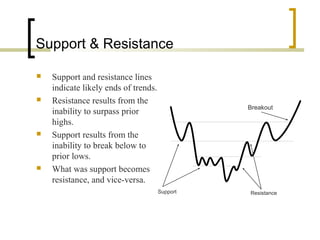
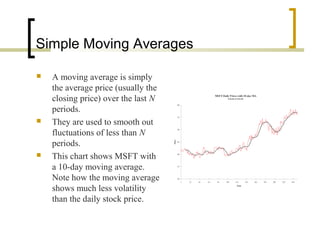
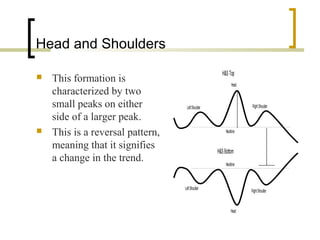
Technical analysis is the attempt to forecast stock prices based on historical market data like price, volume, and other indicators. Technicians look for trends and patterns that may indicate future price movements. They use various charts like bar charts, candlestick charts, and point and figure charts to analyze this data. Key technical tools include trend lines, moving averages, common chart patterns like head and shoulders and triangles, and indicators like MACD, RSI, on-balance volume, and Bollinger bands. Other technical approaches include Dow theory, which analyzes trends in the Dow Jones Industrial Average and Transportation Average, and Elliot wave theory, which looks for recurring wave patterns. While technical analysis is widely used, its efficacy is debated as patterns may