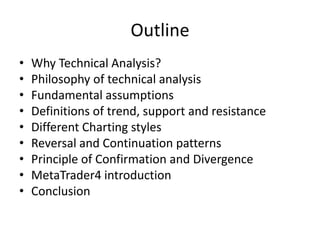
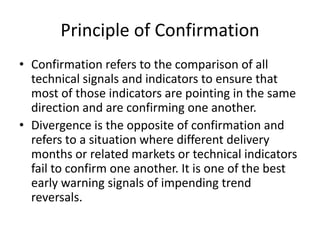
SlideShare a Scribd company logo
Understanding the market
Technical Analysis Approach: part I
Xiaoguang Wang
President, Purdue Quantitative Finance Club
PhD Candidate, Department of Statistics
Purdue University
wang913@purdue.edu
Outline
• Why Technical Analysis?
• Philosophy of technical analysis
• Fundamental assumptions
• Definitions of trend, support and resistance
• Different Charting styles
• Reversal and Continuation patterns
• Principle of Confirmation and Divergence
• MetaTrader4 introduction
• Conclusion
Question: How to trade successfully in
the market?
• Profits significantly out-beat risk-free rate or
the return of market index
• Statistically stable performance in a long run
• The “worst” loss is still affordable
“Trading formula”
• Expected profits = (Target price – entry
price)*P{success} – (Entry price – stop
price)*P{failure}
• Decision making:
Determine (Entry price, Target price, Stop
Price) such that the expected profits can be
maximized.
The role of Technical Analysis
• Help you make the selection among the three
choices at any fixed time t:
1. Open a position
2. Close a position
3. Do nothing
The history of Technical Analysis
• Dow Theory: Charles H. Dow published the first stock
market average on July 3, 1884.
The ABC of Stock Speculation, S.A. Nelson, 1903. (The first
book the term “Dow Theory” was used.)
Dow Theory, Robert Rhea, 1932.
• Elliott Wave Theory:
The wave principle was published in 1938 by Charles J.
Collins, which was based on the original work of Ralph Nelson
Elliott.
• William D. Gann: Geometric angels and percentages. Most
work was published during the 1950s and ’60s.
• For more information:
http://history.technicalanalysis.org.uk/
Philosophy of Technical Analysis
• Market action discounts everything.
• Prices move in trends: A trend in motion is
more likely to continue than to reverse. (An
adaptation of Newton’s first law of motion.)
• History repeats itself.
Basic foundations behind technical
analysis
• Price discounts everything
• Price movements are not totally random
• The market has Three trends (Dow)
• Major trends have three phase (Dow)
• Volume must confirm the trend
• A trend is assumed to be in effect until it gives
definite signals that it has reversed
• The market is more psychological than logical
Doubts and Criticisms
• The doubts and criticisms have a history as long
as that of the theory:
Can the past be used to predict the future?
Signals are always too late?
Analyst Bias: subjective interpretation; art vs.
science
Trader’s Remorse: Not all signals and patterns
work
Always another level: Bullish or Bearish?
Description vs. Prediction
• “What” is more important than “why”!
• Technical analysis at least is an effective
description of the market prices. It helps us
know what the market is saying at the
moment.
• It is a popular language used by traders to
describe the market.
Definitions
• Trend: An upper trend is a series of
successively higher peaks and troughs; a
downtrend is just the opposite, while
horizontal peaks and troughs would identify a
sideways price trend (trendless).
Remark: It is the direction of those peaks and
troughs that constitutes market trend.
Example of trends
Support and resistance
• Support is a level or area on the chart under the
market where buying interest is sufficiently strong to
overcome selling pressure and a decline is halted and
prices turn back up.
• Resistance is a level or area over the market where
selling pressure overcomes buying pressure and a price
advance is turned back.
• Tested support and resistance are more reliable.
• Previous peaks and troughs are potential supports and
resistances. Some other candidates can be those levels
or areas indicated by indicators such as MA, trend
channels, percentages and so on.
Examples of supports and resistances
More examples
Remarks on supports and resistance
• Finding supports and resistance plays the key role of
technical analysis. This is the hardest part in developing
a trading strategy based on technical analysis.
• All the indicators and tools are to help you in two
perspectives:
1. evaluate the strength of potential supports and
resistances.
2. evaluate the spot probability of price going up vs.
going down at the moment.
• Good trading opportunities are those levels that satisfy
the 3:1 rule and have a high odds ratio.
Charting
• Ways to describe or plot the market prices.
• Different types of charts:
Bar Chart
Candle-stick Chart
Point and Figure (OX chart)
Market profile
Pro-Sticks chart
• Goal: keep the basic trend or shape of historical
prices while omit most prices that not
“important” in technical analysis perspective.
Good references
• Candlestick:
http://www.blackswanfx.blogspot.com/
• OX Chart:
http://stockcharts.com/school/doku.php?id=chart_
school:chart_analysis:pnf_charts
• Market Profile
http://www.trading-naked.com/MarketProfile.htm
• ProStick
http://www.prosticks.com
Bar Chart and Candlestick Chart
Candle types
Summary for Candle types
• Long white candlesticks indicate that the Bulls controlled the ball (trading) for most of the
game.
• Long black candlesticks indicate that the Bears controlled the ball (trading) for most of the
game.
• Small candlesticks indicate that neither team could move the ball and prices finished about
where they started.
• A long lower shadow indicates that the Bears controlled the ball for part of the game, but lost
control by the end and the Bulls made an impressive comeback.
• A long upper shadow indicates that the Bulls controlled the ball for part of the game, but lost
control by the end and the Bears made an impressive comeback.
• A long upper and lower shadow indicates that the both the Bears and the Bulls had their
moments during the game, but neither could put the other away, resulting in a standoff.
Drawbacks of Candle Chart
• Omit all the information except for HLOC within a
time interval (one candle), some of which,
however, might be important, especially the
statistical information of the price magnitude
change (Market Profile), assigned volume
information such as the prices that most volume
concentrate on (Pro-Stick).
• Chart can be further contracted, especially when
price moves in a very narrow range for a long
time (OX Chart).
OX Chart
• Focus on the magnitude changes of prices
rather than the changes of prices on time
domain.
More on OX Chart
• You can apply similar patterns used in
candlesticks chart to the OX chart
OX chart used for target price
predictions
Bull trap and Bear trap
Bullish Catapult
Summary for OX Chart
• Filter insignificant price movements and noise
• Focus on important price movements
• Remove the time aspect from the analysis
process
• Make support/resistance levels much easier to
identify
• Provide automatic and subjective trendlines
Market Profile
• A chart that displays market data using Time
Price Opportunities (TPOs). A TPO is a price
that the market traded at during a specific
period. The typical market profile chart splits
the trading day into thirty minute segments or
periods. The market data for each period is
displayed on the basis of a normal
distribution.
Foundations behind
One can combine
the candle chart
together with the
Market Profile
Combination
Summary on Market Profile
• Focus on the time-based distributional
information of price changes within a time
interval
• More detailed version of Candle chart
• Still not directly reflect much on the assigned
volume information of the price changes
Pro-Stick
• The introduction of ProSticks attempts to
reduce the limitations of Market Profile and
other technical analysis and charting tools
while, at the same time, integrates the
elements of volume and time into traditional
technical analysis and charting.
• ProSticks has two variations: ProSticks-By-
Time and ProSticks-By-Volume
ProStick-by-Time & ProStick-by-Volume
• The Modal Point in a ProStick bar represents the most heavily transacted
price for the particular time interval.
• ProSticks-By-Time calculates the Modal Point similar to the way Market
Profile builds its bell-curve distribution. The Modal Point is then simply the
price with the most number of transacted 5-minute intervals for all
transacted prices in the trading interval
• ProSticks-By-Volume calculates the Modal Point simply by taking the most
heavily traded price for the trading day (or other trading intervals). The
Modal Point is thus the price that had the most shares traded for that
particular day.
• The Active Range for both ProSticks-By-Time and ProSticks-By-Volume is
computed by first calculating the mean of the entire distribution. Then the
first standard deviation away from the mean in either direction is added
together to form the Active Range. The Active Range equals approximately
68 percent of the entire distribution
ProStick vs. Candlestick
Summary for ProStick
• Combine the advantages of both Candlestick
and Market Profile
• Help to more accurately find support and
resistant points
• Can be used to confirm or deny signals
indicated by candlestick theories
• It is more reasonable to take Modal Point as
reference compared to close price or H/L price
when do technical analysis.
Price Patterns
• Classification and description of sideways market
movements
• Market price curve = trend_1 + pattern_1 +
trend_2 + pattern_2 +…+ trend_i + pattern_i +….
• Reversal Patterns & Continuation Patterns
• Volume often plays an important role in
determining the reliability of patterns
• Most price patterns also have certain measuring
techniques that help determine the minimum
price objectives.
Reversal Patterns
• A prerequisite for any reversal pattern is the existence
of a prior trend
• The first signal of an impending trend reversal is often
the breaking of an important trendlines
• The larger the pattern, the greater the subsequent
move
• Topping patterns are usually shorter in duration and
more volatile than bottoms
• Bottoms usually have smaller price ranges and take
longer to build
• Volume is usually more important on the upside
Major reversal patterns
• The Head and Shoulder (H&S)
• Triple tops and bottoms
• Double tops and bottoms
• Spike (V) tops and bottoms
• Rounding pattern
Head and Shoulder
Prices should not move across the Neckline again,
otherwise it would be treated as a failed head and
shoulder
Volume matters!
Non-standard head and shoulder
Triple Tops and Bottoms
• A slight variation of “head and shoulder”
• The volume tends to decline with each
successive peak at the top and should increase
at the breakdown point.
Double Tops and Bottoms
• The pattern has two peaks (A and C) at about the same level.
• The pattern is complete when the middle trough at point B is broken on a
closing basis.
• Volume is usually lighter on the second peak C and picks up on the
breakdown D.
• A return move back to the lower line is not unusual.
• The minimum measuring target is the height of the top projected
downward from the breakdown point.
Extensions: Divergence
• Sometimes the second or third peak can be
significantly higher than the previous peak,
thus a “double or triple top pattern” fails.
• But this still can be treated as a reversal
pattern as there is obvious evidence of
“divergence” between the price curve and
some indicator such as MACD.
Abuse of Double tops and bottoms
• Remark: The neckline must be crossed before
confirming a reversal double tops or bottoms
• The price levels should be high or low “enough”
to be considered as reversal patterns
Rounding tops or bottoms
Spike (V) Tops and Bottoms
Continuation patterns
• These patterns usually indicate that the
sideways price action on the chart in nothing
more than a pause in the prevailing trend and
the next move will be in the same direction as
the trend that preceded the formation.
• Continuation patterns are usually shorter-
term in duration and are more accurately
classified as near-term or intermediate
patterns.
Triangles
Triangles
Triangles
Volume matters!
Diamond pattern
• Broadening pattern + Triangle
• Mainly considered as continuation pattern,
but can show up at the bottom or top
• Bullish or Bearish prediction depends on the
breakout direction
• Profit target is the height of the diamond
Diamond pattern
Diamond pattern
Diamond pattern
Flag patterns
• Most frequently seen continuation patterns
• Volume increase at the breakout point
• Target profit depend on the flag pole
Flag Patterns
Pennant
Rectangle
• A flat flag sometimes can be treated as a
rectangle pattern.
• The rectangle pattern usually shows up on
long term chart (daily or monthly chart).
• The volume pattern of rectangle is different
from other continuation patterns since
rectangle usually have wider price swings.
Rectangle Patterns
Rectangle
Rectangle
Principle of Confirmation
• Confirmation refers to the comparison of all
technical signals and indicators to ensure that
most of those indicators are pointing in the same
direction and are confirming one another.
• Divergence is the opposite of confirmation and
refers to a situation where different delivery
months or related markets or technical indicators
fail to confirm one another. It is one of the best
early warning signals of impending trend
reversals.
Confirmation of price trends or
patterns
• Volume and open interest
• Technical signals
• Comparable market index or products
• Fundamental factors
• Other supports or resistances indicated by
some previous (historical) price patterns or
trends.
Technical Indicators
• Trend detective indicators:
Moving Average systems, Bollinger Bands,
parabolic SAR, Commodity Channel Index, ZigZag
• Oscillation indicators:
MACD, RSI, RVI, Stochastic Oscillator, William’s
percent range
• Volume indicators:
Volumes, On balance volume, Accumulation,
Distribution.
MetaTrader 4
• Download:
http://www.metatrader4.com/
• Technical analysis
• Simulation trading account
• Algorithmic Trading with MQL4
http://docs.mql4.com/
Part II: Preview
• More on indicators
• Real market practice: currency market
• X Trader introduction
• Algorithmic trading
• Comprehensive list of indicators
• Technical analysis based statistical Modeling
• Axiomatic thoughts on technical analysis
Thank you!
• Questions?
• PQFC: http://web.ics.purdue.edu/~quantit/
• Join us now!

More Related Content

What's hot

Support resistance trading strategies - a comparison
Support resistance trading strategies - a comparisonSupport resistance trading strategies - a comparison
Support resistance trading strategies - a comparison
Himanshu Patil
 
Magic Forex breakout
Magic Forex breakoutMagic Forex breakout
Magic Forex breakout
pipsumo traderfx
 
Follow the Money and short names.pdf
Follow the Money and short names.pdfFollow the Money and short names.pdf
Follow the Money and short names.pdf
HungLe593957
 
7 Basic Rules for Trading in Intraday
7 Basic Rules for Trading in Intraday7 Basic Rules for Trading in Intraday
7 Basic Rules for Trading in Intraday
Platinum Trading Systems
 
Technical analysis (2)
Technical analysis (2)Technical analysis (2)
Technical analysis (2)
Anand Verma
 
High Probability Trading Setups
High Probability Trading SetupsHigh Probability Trading Setups
High Probability Trading Setups
btrader
 
Price Action Trading.pdf
Price Action Trading.pdfPrice Action Trading.pdf
Price Action Trading.pdf
Shreya292338
 
Scalping in Day Trading
Scalping in Day TradingScalping in Day Trading
Scalping in Day Trading
InvestingTips
 
Learn A Simple Range Trading Strategy
Learn A Simple Range Trading StrategyLearn A Simple Range Trading Strategy
Learn A Simple Range Trading Strategy
NetpicksTrading
 
Best Swing Trading Indicators and Oscillators
Best Swing Trading Indicators and OscillatorsBest Swing Trading Indicators and Oscillators
Best Swing Trading Indicators and Oscillators
SwingTradingBootCamp
 
ORDER BLOCK ENTRY.pptx
ORDER BLOCK ENTRY.pptxORDER BLOCK ENTRY.pptx
ORDER BLOCK ENTRY.pptx
Tan Ngoc
 
Profit from trapped traders with 2 simple setups
Profit from trapped traders with 2 simple setupsProfit from trapped traders with 2 simple setups
Profit from trapped traders with 2 simple setups
NetpicksTrading
 
Section 2 - Chapter 9 Part II - Short Tem Pattern - Bar Chart Reversal Patterns
Section 2 - Chapter 9 Part II - Short Tem Pattern  - Bar Chart Reversal PatternsSection 2 - Chapter 9 Part II - Short Tem Pattern  - Bar Chart Reversal Patterns
Section 2 - Chapter 9 Part II - Short Tem Pattern - Bar Chart Reversal Patterns
Professional Training Academy
 
Price action trading1
Price action trading1Price action trading1
Price action trading1
labyo
 
Moving average -Technical Analysis
Moving average -Technical AnalysisMoving average -Technical Analysis
Moving average -Technical Analysis
Dr.Subhransu Sekhar Jena
 
Pull Back Swing Trading Strategy I The Only Way To Trade Stocks and E-Mini Re...
Pull Back Swing Trading Strategy I The Only Way To Trade Stocks and E-Mini Re...Pull Back Swing Trading Strategy I The Only Way To Trade Stocks and E-Mini Re...
Pull Back Swing Trading Strategy I The Only Way To Trade Stocks and E-Mini Re...
Marketgeekschannel
 
Linda Bradford Raschke - The Taylor Trading Technique.ppt
Linda Bradford Raschke - The Taylor Trading Technique.pptLinda Bradford Raschke - The Taylor Trading Technique.ppt
Linda Bradford Raschke - The Taylor Trading Technique.ppt
KennethAnderson58
 
Master trend-following
Master trend-followingMaster trend-following
Master trend-following
Varlei Rezer
 
Support resistance trading strategies
Support resistance trading strategiesSupport resistance trading strategies
Support resistance trading strategies
Himanshu Patil
 
How to Use Pivot Points in Day Trading
How to Use Pivot Points in Day TradingHow to Use Pivot Points in Day Trading
How to Use Pivot Points in Day Trading
Vivek Rattan
 

What's hot (20)

Support resistance trading strategies - a comparison
Support resistance trading strategies - a comparisonSupport resistance trading strategies - a comparison
Support resistance trading strategies - a comparison
 
Magic Forex breakout
Magic Forex breakoutMagic Forex breakout
Magic Forex breakout
 
Follow the Money and short names.pdf
Follow the Money and short names.pdfFollow the Money and short names.pdf
Follow the Money and short names.pdf
 
7 Basic Rules for Trading in Intraday
7 Basic Rules for Trading in Intraday7 Basic Rules for Trading in Intraday
7 Basic Rules for Trading in Intraday
 
Technical analysis (2)
Technical analysis (2)Technical analysis (2)
Technical analysis (2)
 
High Probability Trading Setups
High Probability Trading SetupsHigh Probability Trading Setups
High Probability Trading Setups
 
Price Action Trading.pdf
Price Action Trading.pdfPrice Action Trading.pdf
Price Action Trading.pdf
 
Scalping in Day Trading
Scalping in Day TradingScalping in Day Trading
Scalping in Day Trading
 
Learn A Simple Range Trading Strategy
Learn A Simple Range Trading StrategyLearn A Simple Range Trading Strategy
Learn A Simple Range Trading Strategy
 
Best Swing Trading Indicators and Oscillators
Best Swing Trading Indicators and OscillatorsBest Swing Trading Indicators and Oscillators
Best Swing Trading Indicators and Oscillators
 
ORDER BLOCK ENTRY.pptx
ORDER BLOCK ENTRY.pptxORDER BLOCK ENTRY.pptx
ORDER BLOCK ENTRY.pptx
 
Profit from trapped traders with 2 simple setups
Profit from trapped traders with 2 simple setupsProfit from trapped traders with 2 simple setups
Profit from trapped traders with 2 simple setups
 
Section 2 - Chapter 9 Part II - Short Tem Pattern - Bar Chart Reversal Patterns
Section 2 - Chapter 9 Part II - Short Tem Pattern  - Bar Chart Reversal PatternsSection 2 - Chapter 9 Part II - Short Tem Pattern  - Bar Chart Reversal Patterns
Section 2 - Chapter 9 Part II - Short Tem Pattern - Bar Chart Reversal Patterns
 
Price action trading1
Price action trading1Price action trading1
Price action trading1
 
Moving average -Technical Analysis
Moving average -Technical AnalysisMoving average -Technical Analysis
Moving average -Technical Analysis
 
Pull Back Swing Trading Strategy I The Only Way To Trade Stocks and E-Mini Re...
Pull Back Swing Trading Strategy I The Only Way To Trade Stocks and E-Mini Re...Pull Back Swing Trading Strategy I The Only Way To Trade Stocks and E-Mini Re...
Pull Back Swing Trading Strategy I The Only Way To Trade Stocks and E-Mini Re...
 
Linda Bradford Raschke - The Taylor Trading Technique.ppt
Linda Bradford Raschke - The Taylor Trading Technique.pptLinda Bradford Raschke - The Taylor Trading Technique.ppt
Linda Bradford Raschke - The Taylor Trading Technique.ppt
 
Master trend-following
Master trend-followingMaster trend-following
Master trend-following
 
Support resistance trading strategies
Support resistance trading strategiesSupport resistance trading strategies
Support resistance trading strategies
 
How to Use Pivot Points in Day Trading
How to Use Pivot Points in Day TradingHow to Use Pivot Points in Day Trading
How to Use Pivot Points in Day Trading
 

Similar to Technical Analysis 1.pdf

technical analysis stocks.pdf
technical analysis stocks.pdftechnical analysis stocks.pdf
technical analysis stocks.pdf
PRADEEPKR41
 
Chapter 4 notes 2012 08 02
Chapter 4 notes 2012 08 02Chapter 4 notes 2012 08 02
Chapter 4 notes 2012 08 02
finlogiq
 
Technical Analysis.pptx
Technical Analysis.pptxTechnical Analysis.pptx
Technical Analysis.pptx
SRCAS
 
Technical analysis
Technical analysisTechnical analysis
Technical analysis
Mohammed Arif Pasha
 
Security analysis (technical) and portfolio management
Security analysis (technical) and portfolio managementSecurity analysis (technical) and portfolio management
Security analysis (technical) and portfolio management
Harish Khan
 
Fundamental analysis
Fundamental analysisFundamental analysis
Fundamental analysis
John Pradeep
 
Chapter 17 technical analysis
Chapter 17 technical analysisChapter 17 technical analysis
Chapter 17 technical analysis
Mridu Sharma
 
Technical Analysis - Asif Poiserwala
Technical Analysis - Asif PoiserwalaTechnical Analysis - Asif Poiserwala
Technical Analysis - Asif Poiserwala
Axis Direct
 
technical analysis
technical analysistechnical analysis
technical analysis
Dhananjay Kumar
 
Tech analysis part 1
Tech analysis part 1Tech analysis part 1
Tech analysis part 1
Indranil Bhattacharjee
 
SECTION 1 - CHAPTER 1 - THE BASIC PRINCIPAL OF TECHNICAL ANALYSIS - THE TRENDS
SECTION 1 - CHAPTER 1 - THE BASIC PRINCIPAL OF TECHNICAL ANALYSIS - THE TRENDSSECTION 1 - CHAPTER 1 - THE BASIC PRINCIPAL OF TECHNICAL ANALYSIS - THE TRENDS
SECTION 1 - CHAPTER 1 - THE BASIC PRINCIPAL OF TECHNICAL ANALYSIS - THE TRENDS
Professional Training Academy
 
Basic Technical Analysis
Basic Technical AnalysisBasic Technical Analysis
Basic Technical Analysis
Australian Shareholders Association
 
Introduction to TA
Introduction to TAIntroduction to TA
Introduction to TA
fallond
 
Idiots guide to stocks
Idiots guide to stocksIdiots guide to stocks
Idiots guide to stocks
Raghu Kashyap
 
Technical Analysis
Technical AnalysisTechnical Analysis
Technical Analysis
University of the Punjab
 
Technical Analysis
Technical AnalysisTechnical Analysis
Technical Analysis
Ankit Gupta
 
Fundamental and Technical Analysis
Fundamental and Technical AnalysisFundamental and Technical Analysis
Fundamental and Technical Analysis
MACFAST
 
Invest systemically earn smartly03
Invest systemically  earn smartly03Invest systemically  earn smartly03
Invest systemically earn smartly03
Sanjay Lad
 
Technical Analysis Project
Technical Analysis ProjectTechnical Analysis Project
Technical Analysis Project
Rahul Prajapati
 
Group 1 technical analysis
Group 1 technical analysisGroup 1 technical analysis
Group 1 technical analysis
AkshayPhoto
 

Similar to Technical Analysis 1.pdf (20)

technical analysis stocks.pdf
technical analysis stocks.pdftechnical analysis stocks.pdf
technical analysis stocks.pdf
 
Chapter 4 notes 2012 08 02
Chapter 4 notes 2012 08 02Chapter 4 notes 2012 08 02
Chapter 4 notes 2012 08 02
 
Technical Analysis.pptx
Technical Analysis.pptxTechnical Analysis.pptx
Technical Analysis.pptx
 
Technical analysis
Technical analysisTechnical analysis
Technical analysis
 
Security analysis (technical) and portfolio management
Security analysis (technical) and portfolio managementSecurity analysis (technical) and portfolio management
Security analysis (technical) and portfolio management
 
Fundamental analysis
Fundamental analysisFundamental analysis
Fundamental analysis
 
Chapter 17 technical analysis
Chapter 17 technical analysisChapter 17 technical analysis
Chapter 17 technical analysis
 
Technical Analysis - Asif Poiserwala
Technical Analysis - Asif PoiserwalaTechnical Analysis - Asif Poiserwala
Technical Analysis - Asif Poiserwala
 
technical analysis
technical analysistechnical analysis
technical analysis
 
Tech analysis part 1
Tech analysis part 1Tech analysis part 1
Tech analysis part 1
 
SECTION 1 - CHAPTER 1 - THE BASIC PRINCIPAL OF TECHNICAL ANALYSIS - THE TRENDS
SECTION 1 - CHAPTER 1 - THE BASIC PRINCIPAL OF TECHNICAL ANALYSIS - THE TRENDSSECTION 1 - CHAPTER 1 - THE BASIC PRINCIPAL OF TECHNICAL ANALYSIS - THE TRENDS
SECTION 1 - CHAPTER 1 - THE BASIC PRINCIPAL OF TECHNICAL ANALYSIS - THE TRENDS
 
Basic Technical Analysis
Basic Technical AnalysisBasic Technical Analysis
Basic Technical Analysis
 
Introduction to TA
Introduction to TAIntroduction to TA
Introduction to TA
 
Idiots guide to stocks
Idiots guide to stocksIdiots guide to stocks
Idiots guide to stocks
 
Technical Analysis
Technical AnalysisTechnical Analysis
Technical Analysis
 
Technical Analysis
Technical AnalysisTechnical Analysis
Technical Analysis
 
Fundamental and Technical Analysis
Fundamental and Technical AnalysisFundamental and Technical Analysis
Fundamental and Technical Analysis
 
Invest systemically earn smartly03
Invest systemically  earn smartly03Invest systemically  earn smartly03
Invest systemically earn smartly03
 
Technical Analysis Project
Technical Analysis ProjectTechnical Analysis Project
Technical Analysis Project
 
Group 1 technical analysis
Group 1 technical analysisGroup 1 technical analysis
Group 1 technical analysis
 

Recently uploaded

BeMetals Investor Presentation_June 1, 2024.pdf
BeMetals Investor Presentation_June 1, 2024.pdfBeMetals Investor Presentation_June 1, 2024.pdf
BeMetals Investor Presentation_June 1, 2024.pdf
DerekIwanaka1
 
Top mailing list providers in the USA.pptx
Top mailing list providers in the USA.pptxTop mailing list providers in the USA.pptx
Top mailing list providers in the USA.pptx
JeremyPeirce1
 
Industrial Tech SW: Category Renewal and Creation
Industrial Tech SW:  Category Renewal and CreationIndustrial Tech SW:  Category Renewal and Creation
Industrial Tech SW: Category Renewal and Creation
Christian Dahlen
 
The Influence of Marketing Strategy and Market Competition on Business Perfor...
The Influence of Marketing Strategy and Market Competition on Business Perfor...The Influence of Marketing Strategy and Market Competition on Business Perfor...
The Influence of Marketing Strategy and Market Competition on Business Perfor...
Adam Smith
 
Evgen Osmak: Methods of key project parameters estimation: from the shaman-in...
Evgen Osmak: Methods of key project parameters estimation: from the shaman-in...Evgen Osmak: Methods of key project parameters estimation: from the shaman-in...
Evgen Osmak: Methods of key project parameters estimation: from the shaman-in...
Lviv Startup Club
 
Anny Serafina Love - Letter of Recommendation by Kellen Harkins, MS.
Anny Serafina Love - Letter of Recommendation by Kellen Harkins, MS.Anny Serafina Love - Letter of Recommendation by Kellen Harkins, MS.
Anny Serafina Love - Letter of Recommendation by Kellen Harkins, MS.
AnnySerafinaLove
 
ikea_woodgreen_petscharity_dog-alogue_digital.pdf
ikea_woodgreen_petscharity_dog-alogue_digital.pdfikea_woodgreen_petscharity_dog-alogue_digital.pdf
ikea_woodgreen_petscharity_dog-alogue_digital.pdf
agatadrynko
 
Best practices for project execution and delivery
Best practices for project execution and deliveryBest practices for project execution and delivery
Best practices for project execution and delivery
CLIVE MINCHIN
 
The 10 Most Influential Leaders Guiding Corporate Evolution, 2024.pdf
The 10 Most Influential Leaders Guiding Corporate Evolution, 2024.pdfThe 10 Most Influential Leaders Guiding Corporate Evolution, 2024.pdf
The 10 Most Influential Leaders Guiding Corporate Evolution, 2024.pdf
thesiliconleaders
 
Part 2 Deep Dive: Navigating the 2024 Slowdown
Part 2 Deep Dive: Navigating the 2024 SlowdownPart 2 Deep Dive: Navigating the 2024 Slowdown
Part 2 Deep Dive: Navigating the 2024 Slowdown
jeffkluth1
 
Best Forex Brokers Comparison in INDIA 2024
Best Forex Brokers Comparison in INDIA 2024Best Forex Brokers Comparison in INDIA 2024
Best Forex Brokers Comparison in INDIA 2024
Top Forex Brokers Review
 
2022 Vintage Roman Numerals Men Rings
2022 Vintage Roman  Numerals  Men  Rings2022 Vintage Roman  Numerals  Men  Rings
2022 Vintage Roman Numerals Men Rings
aragme
 
LA HUG - Video Testimonials with Chynna Morgan - June 2024
LA HUG - Video Testimonials with Chynna Morgan - June 2024LA HUG - Video Testimonials with Chynna Morgan - June 2024
LA HUG - Video Testimonials with Chynna Morgan - June 2024
Lital Barkan
 
Lundin Gold Corporate Presentation - June 2024
Lundin Gold Corporate Presentation - June 2024Lundin Gold Corporate Presentation - June 2024
Lundin Gold Corporate Presentation - June 2024
Adnet Communications
 
The Influence of Marketing Strategy and Market Competition on Business Perfor...
The Influence of Marketing Strategy and Market Competition on Business Perfor...The Influence of Marketing Strategy and Market Competition on Business Perfor...
The Influence of Marketing Strategy and Market Competition on Business Perfor...
Adam Smith
 
ikea_woodgreen_petscharity_cat-alogue_digital.pdf
ikea_woodgreen_petscharity_cat-alogue_digital.pdfikea_woodgreen_petscharity_cat-alogue_digital.pdf
ikea_woodgreen_petscharity_cat-alogue_digital.pdf
agatadrynko
 
Event Report - SAP Sapphire 2024 Orlando - lots of innovation and old challenges
Event Report - SAP Sapphire 2024 Orlando - lots of innovation and old challengesEvent Report - SAP Sapphire 2024 Orlando - lots of innovation and old challenges
Event Report - SAP Sapphire 2024 Orlando - lots of innovation and old challenges
Holger Mueller
 
3 Simple Steps To Buy Verified Payoneer Account In 2024
3 Simple Steps To Buy Verified Payoneer Account In 20243 Simple Steps To Buy Verified Payoneer Account In 2024
3 Simple Steps To Buy Verified Payoneer Account In 2024
SEOSMMEARTH
 
Creative Web Design Company in Singapore
Creative Web Design Company in SingaporeCreative Web Design Company in Singapore
Creative Web Design Company in Singapore
techboxsqauremedia
 
Chapter 7 Final business management sciences .ppt
Chapter 7 Final business management sciences .pptChapter 7 Final business management sciences .ppt
Chapter 7 Final business management sciences .ppt
ssuser567e2d
 

Recently uploaded (20)

BeMetals Investor Presentation_June 1, 2024.pdf
BeMetals Investor Presentation_June 1, 2024.pdfBeMetals Investor Presentation_June 1, 2024.pdf
BeMetals Investor Presentation_June 1, 2024.pdf
 
Top mailing list providers in the USA.pptx
Top mailing list providers in the USA.pptxTop mailing list providers in the USA.pptx
Top mailing list providers in the USA.pptx
 
Industrial Tech SW: Category Renewal and Creation
Industrial Tech SW:  Category Renewal and CreationIndustrial Tech SW:  Category Renewal and Creation
Industrial Tech SW: Category Renewal and Creation
 
The Influence of Marketing Strategy and Market Competition on Business Perfor...
The Influence of Marketing Strategy and Market Competition on Business Perfor...The Influence of Marketing Strategy and Market Competition on Business Perfor...
The Influence of Marketing Strategy and Market Competition on Business Perfor...
 
Evgen Osmak: Methods of key project parameters estimation: from the shaman-in...
Evgen Osmak: Methods of key project parameters estimation: from the shaman-in...Evgen Osmak: Methods of key project parameters estimation: from the shaman-in...
Evgen Osmak: Methods of key project parameters estimation: from the shaman-in...
 
Anny Serafina Love - Letter of Recommendation by Kellen Harkins, MS.
Anny Serafina Love - Letter of Recommendation by Kellen Harkins, MS.Anny Serafina Love - Letter of Recommendation by Kellen Harkins, MS.
Anny Serafina Love - Letter of Recommendation by Kellen Harkins, MS.
 
ikea_woodgreen_petscharity_dog-alogue_digital.pdf
ikea_woodgreen_petscharity_dog-alogue_digital.pdfikea_woodgreen_petscharity_dog-alogue_digital.pdf
ikea_woodgreen_petscharity_dog-alogue_digital.pdf
 
Best practices for project execution and delivery
Best practices for project execution and deliveryBest practices for project execution and delivery
Best practices for project execution and delivery
 
The 10 Most Influential Leaders Guiding Corporate Evolution, 2024.pdf
The 10 Most Influential Leaders Guiding Corporate Evolution, 2024.pdfThe 10 Most Influential Leaders Guiding Corporate Evolution, 2024.pdf
The 10 Most Influential Leaders Guiding Corporate Evolution, 2024.pdf
 
Part 2 Deep Dive: Navigating the 2024 Slowdown
Part 2 Deep Dive: Navigating the 2024 SlowdownPart 2 Deep Dive: Navigating the 2024 Slowdown
Part 2 Deep Dive: Navigating the 2024 Slowdown
 
Best Forex Brokers Comparison in INDIA 2024
Best Forex Brokers Comparison in INDIA 2024Best Forex Brokers Comparison in INDIA 2024
Best Forex Brokers Comparison in INDIA 2024
 
2022 Vintage Roman Numerals Men Rings
2022 Vintage Roman  Numerals  Men  Rings2022 Vintage Roman  Numerals  Men  Rings
2022 Vintage Roman Numerals Men Rings
 
LA HUG - Video Testimonials with Chynna Morgan - June 2024
LA HUG - Video Testimonials with Chynna Morgan - June 2024LA HUG - Video Testimonials with Chynna Morgan - June 2024
LA HUG - Video Testimonials with Chynna Morgan - June 2024
 
Lundin Gold Corporate Presentation - June 2024
Lundin Gold Corporate Presentation - June 2024Lundin Gold Corporate Presentation - June 2024
Lundin Gold Corporate Presentation - June 2024
 
The Influence of Marketing Strategy and Market Competition on Business Perfor...
The Influence of Marketing Strategy and Market Competition on Business Perfor...The Influence of Marketing Strategy and Market Competition on Business Perfor...
The Influence of Marketing Strategy and Market Competition on Business Perfor...
 
ikea_woodgreen_petscharity_cat-alogue_digital.pdf
ikea_woodgreen_petscharity_cat-alogue_digital.pdfikea_woodgreen_petscharity_cat-alogue_digital.pdf
ikea_woodgreen_petscharity_cat-alogue_digital.pdf
 
Event Report - SAP Sapphire 2024 Orlando - lots of innovation and old challenges
Event Report - SAP Sapphire 2024 Orlando - lots of innovation and old challengesEvent Report - SAP Sapphire 2024 Orlando - lots of innovation and old challenges
Event Report - SAP Sapphire 2024 Orlando - lots of innovation and old challenges
 
3 Simple Steps To Buy Verified Payoneer Account In 2024
3 Simple Steps To Buy Verified Payoneer Account In 20243 Simple Steps To Buy Verified Payoneer Account In 2024
3 Simple Steps To Buy Verified Payoneer Account In 2024
 
Creative Web Design Company in Singapore
Creative Web Design Company in SingaporeCreative Web Design Company in Singapore
Creative Web Design Company in Singapore
 
Chapter 7 Final business management sciences .ppt
Chapter 7 Final business management sciences .pptChapter 7 Final business management sciences .ppt
Chapter 7 Final business management sciences .ppt
 

Technical Analysis 1.pdf

  • 1. Understanding the market Technical Analysis Approach: part I Xiaoguang Wang President, Purdue Quantitative Finance Club PhD Candidate, Department of Statistics Purdue University wang913@purdue.edu
  • 2. Outline • Why Technical Analysis? • Philosophy of technical analysis • Fundamental assumptions • Definitions of trend, support and resistance • Different Charting styles • Reversal and Continuation patterns • Principle of Confirmation and Divergence • MetaTrader4 introduction • Conclusion
  • 3. Question: How to trade successfully in the market? • Profits significantly out-beat risk-free rate or the return of market index • Statistically stable performance in a long run • The “worst” loss is still affordable
  • 4. “Trading formula” • Expected profits = (Target price – entry price)*P{success} – (Entry price – stop price)*P{failure} • Decision making: Determine (Entry price, Target price, Stop Price) such that the expected profits can be maximized.
  • 5. The role of Technical Analysis • Help you make the selection among the three choices at any fixed time t: 1. Open a position 2. Close a position 3. Do nothing
  • 6. The history of Technical Analysis • Dow Theory: Charles H. Dow published the first stock market average on July 3, 1884. The ABC of Stock Speculation, S.A. Nelson, 1903. (The first book the term “Dow Theory” was used.) Dow Theory, Robert Rhea, 1932. • Elliott Wave Theory: The wave principle was published in 1938 by Charles J. Collins, which was based on the original work of Ralph Nelson Elliott. • William D. Gann: Geometric angels and percentages. Most work was published during the 1950s and ’60s. • For more information: http://history.technicalanalysis.org.uk/
  • 7. Philosophy of Technical Analysis • Market action discounts everything. • Prices move in trends: A trend in motion is more likely to continue than to reverse. (An adaptation of Newton’s first law of motion.) • History repeats itself.
  • 8. Basic foundations behind technical analysis • Price discounts everything • Price movements are not totally random • The market has Three trends (Dow) • Major trends have three phase (Dow) • Volume must confirm the trend • A trend is assumed to be in effect until it gives definite signals that it has reversed • The market is more psychological than logical
  • 9. Doubts and Criticisms • The doubts and criticisms have a history as long as that of the theory: Can the past be used to predict the future? Signals are always too late? Analyst Bias: subjective interpretation; art vs. science Trader’s Remorse: Not all signals and patterns work Always another level: Bullish or Bearish?
  • 10. Description vs. Prediction • “What” is more important than “why”! • Technical analysis at least is an effective description of the market prices. It helps us know what the market is saying at the moment. • It is a popular language used by traders to describe the market.
  • 11. Definitions • Trend: An upper trend is a series of successively higher peaks and troughs; a downtrend is just the opposite, while horizontal peaks and troughs would identify a sideways price trend (trendless). Remark: It is the direction of those peaks and troughs that constitutes market trend.
  • 13. Support and resistance • Support is a level or area on the chart under the market where buying interest is sufficiently strong to overcome selling pressure and a decline is halted and prices turn back up. • Resistance is a level or area over the market where selling pressure overcomes buying pressure and a price advance is turned back. • Tested support and resistance are more reliable. • Previous peaks and troughs are potential supports and resistances. Some other candidates can be those levels or areas indicated by indicators such as MA, trend channels, percentages and so on.
  • 14. Examples of supports and resistances
  • 16. Remarks on supports and resistance • Finding supports and resistance plays the key role of technical analysis. This is the hardest part in developing a trading strategy based on technical analysis. • All the indicators and tools are to help you in two perspectives: 1. evaluate the strength of potential supports and resistances. 2. evaluate the spot probability of price going up vs. going down at the moment. • Good trading opportunities are those levels that satisfy the 3:1 rule and have a high odds ratio.
  • 17. Charting • Ways to describe or plot the market prices. • Different types of charts: Bar Chart Candle-stick Chart Point and Figure (OX chart) Market profile Pro-Sticks chart • Goal: keep the basic trend or shape of historical prices while omit most prices that not “important” in technical analysis perspective.
  • 18. Good references • Candlestick: http://www.blackswanfx.blogspot.com/ • OX Chart: http://stockcharts.com/school/doku.php?id=chart_ school:chart_analysis:pnf_charts • Market Profile http://www.trading-naked.com/MarketProfile.htm • ProStick http://www.prosticks.com
  • 19. Bar Chart and Candlestick Chart
  • 21.
  • 22.
  • 23. Summary for Candle types • Long white candlesticks indicate that the Bulls controlled the ball (trading) for most of the game. • Long black candlesticks indicate that the Bears controlled the ball (trading) for most of the game. • Small candlesticks indicate that neither team could move the ball and prices finished about where they started. • A long lower shadow indicates that the Bears controlled the ball for part of the game, but lost control by the end and the Bulls made an impressive comeback. • A long upper shadow indicates that the Bulls controlled the ball for part of the game, but lost control by the end and the Bears made an impressive comeback. • A long upper and lower shadow indicates that the both the Bears and the Bulls had their moments during the game, but neither could put the other away, resulting in a standoff.
  • 24. Drawbacks of Candle Chart • Omit all the information except for HLOC within a time interval (one candle), some of which, however, might be important, especially the statistical information of the price magnitude change (Market Profile), assigned volume information such as the prices that most volume concentrate on (Pro-Stick). • Chart can be further contracted, especially when price moves in a very narrow range for a long time (OX Chart).
  • 25. OX Chart • Focus on the magnitude changes of prices rather than the changes of prices on time domain.
  • 26. More on OX Chart • You can apply similar patterns used in candlesticks chart to the OX chart
  • 27.
  • 28. OX chart used for target price predictions
  • 29. Bull trap and Bear trap
  • 31. Summary for OX Chart • Filter insignificant price movements and noise • Focus on important price movements • Remove the time aspect from the analysis process • Make support/resistance levels much easier to identify • Provide automatic and subjective trendlines
  • 32. Market Profile • A chart that displays market data using Time Price Opportunities (TPOs). A TPO is a price that the market traded at during a specific period. The typical market profile chart splits the trading day into thirty minute segments or periods. The market data for each period is displayed on the basis of a normal distribution.
  • 34.
  • 35. One can combine the candle chart together with the Market Profile
  • 37. Summary on Market Profile • Focus on the time-based distributional information of price changes within a time interval • More detailed version of Candle chart • Still not directly reflect much on the assigned volume information of the price changes
  • 38. Pro-Stick • The introduction of ProSticks attempts to reduce the limitations of Market Profile and other technical analysis and charting tools while, at the same time, integrates the elements of volume and time into traditional technical analysis and charting. • ProSticks has two variations: ProSticks-By- Time and ProSticks-By-Volume
  • 39. ProStick-by-Time & ProStick-by-Volume • The Modal Point in a ProStick bar represents the most heavily transacted price for the particular time interval. • ProSticks-By-Time calculates the Modal Point similar to the way Market Profile builds its bell-curve distribution. The Modal Point is then simply the price with the most number of transacted 5-minute intervals for all transacted prices in the trading interval • ProSticks-By-Volume calculates the Modal Point simply by taking the most heavily traded price for the trading day (or other trading intervals). The Modal Point is thus the price that had the most shares traded for that particular day. • The Active Range for both ProSticks-By-Time and ProSticks-By-Volume is computed by first calculating the mean of the entire distribution. Then the first standard deviation away from the mean in either direction is added together to form the Active Range. The Active Range equals approximately 68 percent of the entire distribution
  • 41.
  • 42.
  • 43. Summary for ProStick • Combine the advantages of both Candlestick and Market Profile • Help to more accurately find support and resistant points • Can be used to confirm or deny signals indicated by candlestick theories • It is more reasonable to take Modal Point as reference compared to close price or H/L price when do technical analysis.
  • 44. Price Patterns • Classification and description of sideways market movements • Market price curve = trend_1 + pattern_1 + trend_2 + pattern_2 +…+ trend_i + pattern_i +…. • Reversal Patterns & Continuation Patterns • Volume often plays an important role in determining the reliability of patterns • Most price patterns also have certain measuring techniques that help determine the minimum price objectives.
  • 45. Reversal Patterns • A prerequisite for any reversal pattern is the existence of a prior trend • The first signal of an impending trend reversal is often the breaking of an important trendlines • The larger the pattern, the greater the subsequent move • Topping patterns are usually shorter in duration and more volatile than bottoms • Bottoms usually have smaller price ranges and take longer to build • Volume is usually more important on the upside
  • 46. Major reversal patterns • The Head and Shoulder (H&S) • Triple tops and bottoms • Double tops and bottoms • Spike (V) tops and bottoms • Rounding pattern
  • 47. Head and Shoulder Prices should not move across the Neckline again, otherwise it would be treated as a failed head and shoulder
  • 50. Triple Tops and Bottoms • A slight variation of “head and shoulder” • The volume tends to decline with each successive peak at the top and should increase at the breakdown point.
  • 51. Double Tops and Bottoms • The pattern has two peaks (A and C) at about the same level. • The pattern is complete when the middle trough at point B is broken on a closing basis. • Volume is usually lighter on the second peak C and picks up on the breakdown D. • A return move back to the lower line is not unusual. • The minimum measuring target is the height of the top projected downward from the breakdown point.
  • 52.
  • 53. Extensions: Divergence • Sometimes the second or third peak can be significantly higher than the previous peak, thus a “double or triple top pattern” fails. • But this still can be treated as a reversal pattern as there is obvious evidence of “divergence” between the price curve and some indicator such as MACD.
  • 54.
  • 55. Abuse of Double tops and bottoms • Remark: The neckline must be crossed before confirming a reversal double tops or bottoms • The price levels should be high or low “enough” to be considered as reversal patterns
  • 56. Rounding tops or bottoms
  • 57. Spike (V) Tops and Bottoms
  • 58. Continuation patterns • These patterns usually indicate that the sideways price action on the chart in nothing more than a pause in the prevailing trend and the next move will be in the same direction as the trend that preceded the formation. • Continuation patterns are usually shorter- term in duration and are more accurately classified as near-term or intermediate patterns.
  • 63. Diamond pattern • Broadening pattern + Triangle • Mainly considered as continuation pattern, but can show up at the bottom or top • Bullish or Bearish prediction depends on the breakout direction • Profit target is the height of the diamond
  • 67. Flag patterns • Most frequently seen continuation patterns • Volume increase at the breakout point • Target profit depend on the flag pole
  • 70. Rectangle • A flat flag sometimes can be treated as a rectangle pattern. • The rectangle pattern usually shows up on long term chart (daily or monthly chart). • The volume pattern of rectangle is different from other continuation patterns since rectangle usually have wider price swings.
  • 74. Principle of Confirmation • Confirmation refers to the comparison of all technical signals and indicators to ensure that most of those indicators are pointing in the same direction and are confirming one another. • Divergence is the opposite of confirmation and refers to a situation where different delivery months or related markets or technical indicators fail to confirm one another. It is one of the best early warning signals of impending trend reversals.
  • 75. Confirmation of price trends or patterns • Volume and open interest • Technical signals • Comparable market index or products • Fundamental factors • Other supports or resistances indicated by some previous (historical) price patterns or trends.
  • 76. Technical Indicators • Trend detective indicators: Moving Average systems, Bollinger Bands, parabolic SAR, Commodity Channel Index, ZigZag • Oscillation indicators: MACD, RSI, RVI, Stochastic Oscillator, William’s percent range • Volume indicators: Volumes, On balance volume, Accumulation, Distribution.
  • 77. MetaTrader 4 • Download: http://www.metatrader4.com/ • Technical analysis • Simulation trading account • Algorithmic Trading with MQL4 http://docs.mql4.com/
  • 78. Part II: Preview • More on indicators • Real market practice: currency market • X Trader introduction • Algorithmic trading • Comprehensive list of indicators • Technical analysis based statistical Modeling • Axiomatic thoughts on technical analysis
  • 79. Thank you! • Questions? • PQFC: http://web.ics.purdue.edu/~quantit/ • Join us now!