Downloaded 179 times


![86
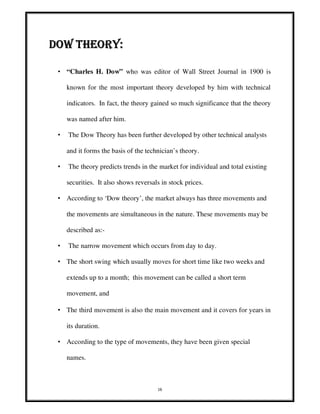
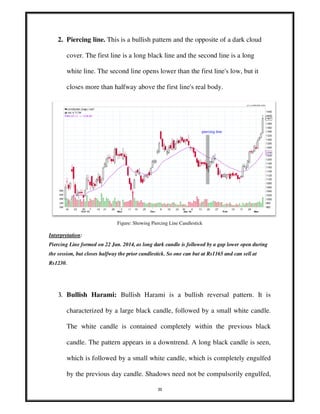
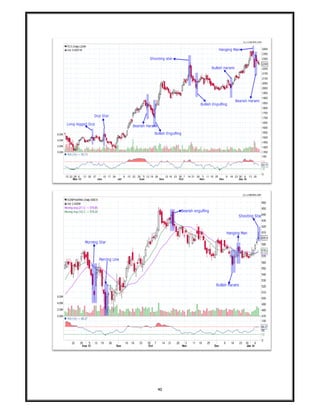
This chart shows how the OBV line can be used as confirmation of a price
trend. The peak in September was followed by lower price movements that
corresponded with volume spikes, thus implying that the downtrend was going
to continue.
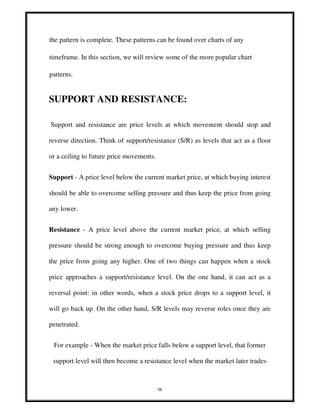
William %R:
Developed by Larry Williams, William % R is a momentum indicator that
works much like the Stochastic Oscillator. It is especially popular for measuring
overbought and oversold levels. The scale ranges from 0 to -100 with readings
from 0 to -20 considered overbought, and readings from -80 to -100 considered
oversold.
William %R, sometimes referred to as %R, shows the relationship of the close
relative to the high-low range over a set period of time. The nearer the close is
to the top of the range, the nearer to zero (higher) the indicator will be. The
nearer the close is to the bottom of the range, the nearer to -100 (lower) the
indicator will be. If the close equals the high of the high-low range, then the
indicator will show 0 (the highest reading). If the close equals the low of the
high-low range, then the result will be -100 (the lowest reading).
Calculation
%R = [(highest high over? periods - close) / (highest high over? periods -
lowest low over? periods)] * -100](https://image.slidesharecdn.com/technicalanalysisharshal-150227145312-conversion-gate01/85/Technical-analysis-86-320.jpg)


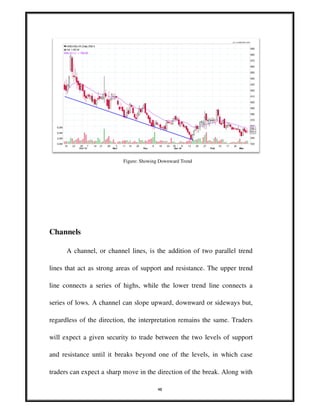
![89
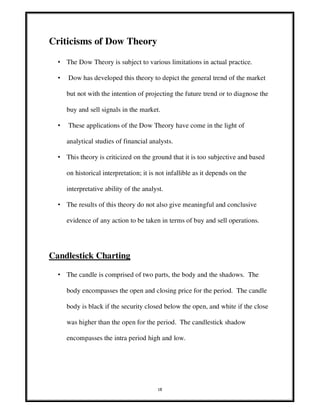
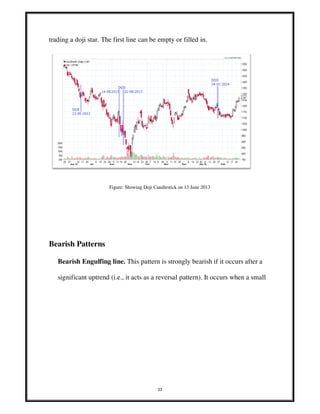
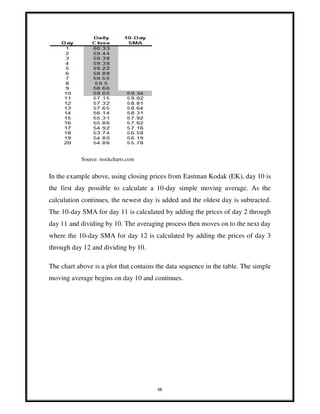
o Some good entry signals were given with the 28-day %R by waiting for a
move above or below -50 for confirmation.
Relative strength index (RSI):
There are a few different tools that can be used to interpret the strength of a
stock. One of these is the Relative Strength Index (RSI), which is a comparison
between the days that a stock finishes up and the days it finishes down. This
indicator is a big tool in momentum trading.
The RSI is a reasonably simple model that anyone can use. It is calculated using
the following formula.
RSI = 100 - [100/(1 + RS)]
RS = (Avg. of n-day up closes)/(Avg. of n-day down closes)
n = days (most analysts use 9 - 15 day RSI)
The RSI ranges from 0 to 100. At around the 70 levels, a stock is considered
overbought and you should consider selling. In a bull market some believe that
80 is a better level to indicate an overbought stock since stocks often trade at
higher valuations during bull markets. Likewise, if the RSI approaches 30, a
stock is considered oversold and you should consider buying. Again, make the
adjustment to 20 in a bear market.](https://image.slidesharecdn.com/technicalanalysisharshal-150227145312-conversion-gate01/85/Technical-analysis-89-320.jpg)


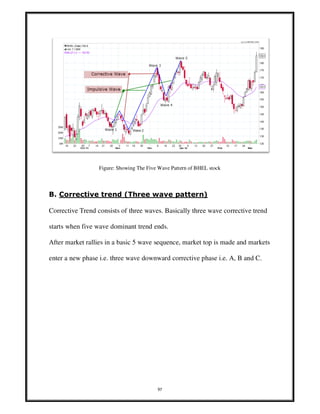
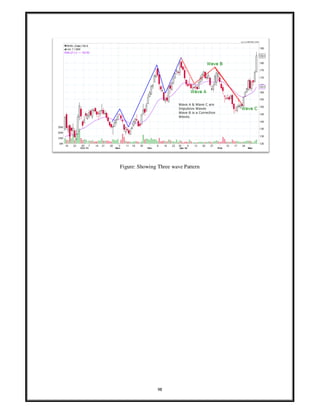


The document is a project report on 'Technical Analysis' prepared by MBA student Haarshal under the guidance of Lect. Amit Bagga at the Indian Institute of Financial Planning. It covers various aspects of technical analysis, including its principles, assumptions, tools, and methods, along with a comparison to fundamental analysis and an overview of Dow Theory. Additionally, the report includes definitions, chart types, and the history and criticisms of technical analysis, emphasizing its significance for short-term traders.