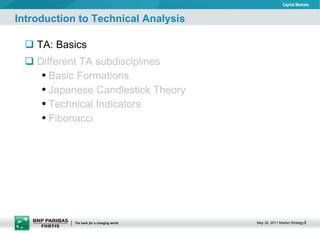
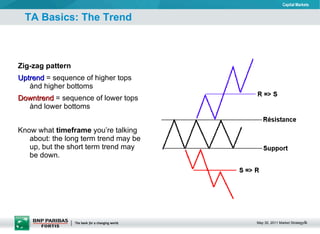
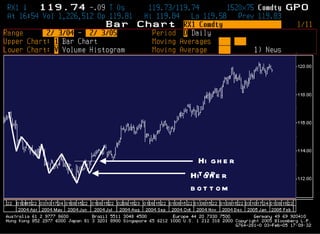
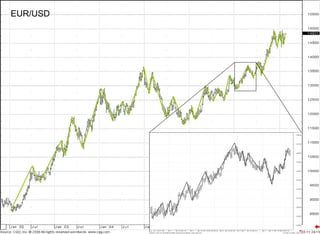
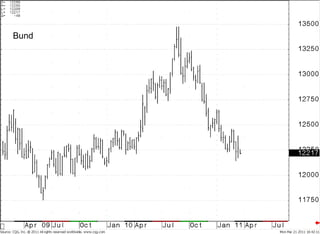
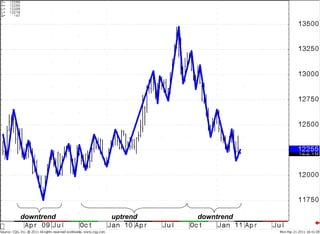
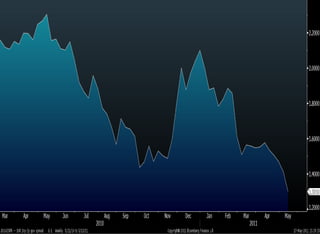
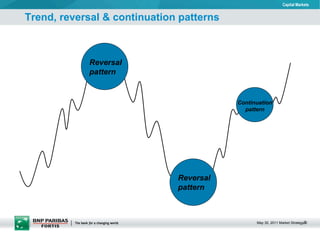
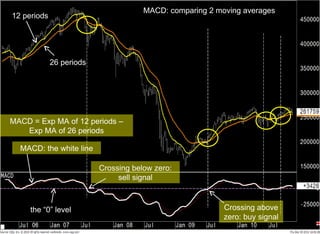
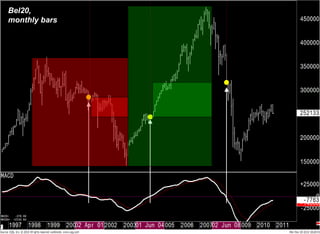
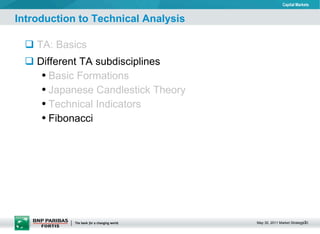
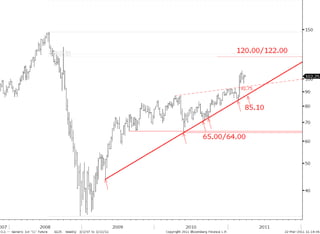
Introduction to Technical Analysis Karel De Bie Market Strategist BNP Paribas Fortis Global Markets FI Research. Blanmont, May 18, 2011
Introduction to Technical Analysis TA: Basics Different TA subdisciplines Basic Formations Japanese Candlestick Theory Technical Indicators Fibonacci
TA vs FA Michigan Confidence Indicator New Home Sales Durable Goods Orders Jobless Claims ISM Manufacturng Change in Nonfarm Payrolls Unemplyment Rate Trade Balance CPI P(fa) P(fa)>P=> buy P(fa)<P=> sell 
 FA A fundamental analyst only analyzes a handful of stocks or currencies Geopolitical Situation TA Basics
Technical analysts only look at the price (sometimes also at volumes). TA Basics PRICE CHART
John J. Murphy: TA is the study of market action, primarily through the use of charts, for the purpose of forecasting future price trends.  We look at price formations and technical indicators (which are all based on price and/or volume) in order to know whether to enter the market or not, and if yes: to go long or short. TA Definition PRICE CHART
Loss of information : per period just the close (no OHL), the H&L are important when drawing resistance/support lines The chart: line chart
The chart: bar chart Bar = 1 period, 1 min to 1 year
The chart: candle stick chart Candle = 1 period, 1 min to 1 year Advantage: Jap candlestick clearly visible
TA basic assumptions We assume that all the relevant information regarding the price  (political, economic, fundamental, 
 )  is already priced in or discounted in the price and that the (mass)psychology of the market participants produces recognisable recurring formations.
TA can be applied on
 Virtually all markets, provided that there is enough liquidity, volume and that there are enough market participants.  Stock indices, individual stocks, currencies, commodities, interest rates, futures

TA advantages Allows us to  quickly assess the market : is the market bullish, bearish or neutral? Allows us to spot  opportunities . Can be applied on virtually all markets:  Stock indices, individual stocks, currencies, commodities, interest rates, futures
 Applicable on all timeframes : the same techniques can be applied from intraday time frames all the way up to multi-year timeframes. Is pretty much  simple  and straight forward.
 
 
TA Basics: The Trend Zig-zag pattern Uptrend  = sequence of higher tops ànd higher bottoms Downtrend  = sequence of lower tops ànd lower bottoms Know what  timeframe  you’re talking about: the long term trend may be up, but the short term trend may be down.
Higher bottom Higher top
EUR/USD
Bund
downtrend uptrend downtrend
 
Trend, reversal & continuation patterns Reversal pattern Reversal pattern Continuation pattern
Introduction to Technical Analysis TA: Basics Different TA subdisciplines Basic Formations Japanese Candlestick Theory Technical Indicators Elliott Wave Theory Fibonacci
Basic Formations: Trend Line Simplest tool within TA Connects the  lows  in an  uptrend Below every 2 bottoms, it is possible to fine such a line, but it needs 3 points to be a valid one = support line
connects the tops in a downtrend 3 tops needed to make it a valid trendline Basic Formations: Trend Line = resistance line
Uptrend Support Line 3 & 4: buying opportunities 5: selling opportunity pull-back possible: previous support line becomes resistance
Downtrend Resistance Line similar
AEX 1 december 2010: long or short?
AEX : another buy signal
 AEX : and now?
 
20.90 13.70 24.25 28.50 25.50
 
EUR/PLZ, weekly bars
EUR/USD, weekly bars chart buy sell
EUR/GBP, monthly bars
Basic Formations: Channel Uptrend channel resistance line over the tops, parallel to the uptrendline at least 2 Ă  3 times touched channel break-out => expect a move into the same direction with as target the vertical width of the channel projected from the break-out level.  downtrend channel similar
(analogous for downtrend channel) Basic Formations: Channel Target Target Break-out Break-out Uptrend channel, break-out and target
Bund 125.40 124.00 122.05 fibo target
 
 
Channel
71.50 67.00 63.00 58.00
Reversal Formation: Head & Shoulders
 
 
S&P 500, daily bars
 
 
Reversal Formation: Double & Triple Top Similar for a double (or triple) bottom  No previous top in the double top space
Brent Oil
 
Dollar index
Reversal Formation: Falling/Rising wedge at the end of a trend : a reliable pattern break-out is most often powerful and targets the beginning of the wedge
 
 
(Key) Reversal day & Island reversal
 
S&P 500 daily bars bearish key reversal bullish key reversal bullish key reversal
EUR/USD, daily candlesticks Bullish key reversal day Bearish reversal day
Gold, weekly bars Bullish reversal weeks Bearish reversal week
Continuation Pattern: Flags Uptrend during a  strong  trend buy the break-out in the same direction as the underlying trend flag hangs “half way” exists out of 5 to max 15 bars or candlesticks  Downtrend   similar
1.4144 1.4225 1.4122 25 tics risk for 80 tics potential profit
Example
EUR/USD, 30min bars, Oct 5th 2010 long stop loss target 20 tics ris vs 100 tics potential profit
 
 
EUR/USD
 
Triangle: Reversal or Continuation Pattern
Triangle Formation Result of doubt in the market in    2/3 of the cases : continuation pattern, in    1/3 of the cases: reversal pattern volumes should decrease during the formation break-out must happen with strong volume pull-back is possible break-out between 2/3 & 3/4 are the most reliable
 
EUR/GBP, 60min bars
Driehoek
 
 
Bund voorbeelden
Bund voorbeelden
Introduction to Technical Analysis TA: Basics Different TA subdisciplines Basic Formations Japanese Candlestick Theory Technical Indicators Fibonacci
The Candlestick
Hammer & Hanging Man
Japanese Candlestick Theory
Engulfing Pattern
Japanese Candlestick Theory
 
EUR/USD, 60 min bars
Introduction to Technical Analysis TA: Basics Different TA subdisciplines Basic Formations Japanese Candlestick Theory Technical Indicators Fibonacci
Technical   Indicators    1.500  Keep it simple  all based on price (sometimes also on volume) Moving Average MACD RSI Slow Stochastics
Moving Average 3 kinds of MA :  the simple MA the weighted MA the exponential MA simple MA is most used takes the prices of the X last periods and devides them by X.  Frequently used periods are 20/50/100/200.
Moving Average the movement of the MA is less capricious gives the direction of the trend the further prices move from the MA, the bigger the oversold/overbought character. Buy/sell signal when price crosses (or closes above/below) the MA.
Moving Averages are the building blocks of the MACD Different kinds of Moving Averages exist:  simple MA : takes the prices of the X last periods and devides them by X weighted MA : cfr simple MA, but more weight is given to the more recent closing prices exponential MA : cfr simple MA, but the more recent prices get exponentially more weight. Frequently used periods are 20/50/100/200.
How could a MA be used? A moving average gives the direction of the trend The further price moves away from its MA, the bigger the overbought/oversold character Possible ways to trade the moving average: If price crosses above the MA on a closing basis: long, if price crosses below the MA on a closing basis: short If the MA is rising: long, if the MA is falling: short
Long if closing price is above MA (a 25 period simple MA), short if  closing price is below MA. Bel20, weekly bars Example of using the MA
Long if closing price is above MA (a 25 period simple MA), short if  closing price is below MA. Bel20, daily bars Example of using the MA
Criticism on the MA  It works very nice when the market is in an uptrend or in a downtrend. But, when the market is trading sideways, you will lose money using MAs.  Which MA to use? A 20/50/100/200 period? The simple/exponential
 ? In hindsight it is always easy to tell which one we should have used.
100 days MA MA: great results when the market is in a clear up- or downtrend  Sideways trading: you lose money when trading the MA signals
100 days MA 50 days MA 20 days MA Which MA to use? Afterwards, it is always clear

Moving Average Convergene Divergence Purpose = to generate less false signals Instead of looking at the crossings of price with a MA, one looks at the crossings of 2 MAs with a different timeframe A short term exponential MA of 12 periods is compared with a longer term exponential MA of 26 periods. MACD = Exp MA (12) – Exp MA (26) The original use of the MACD was:  to buy when the MACD crosses above the zero line (i.e. when the short term MA crosses above the longer term MA) to sell when the MACD crosses below the zero line (i.e. when the short term MA crosses below the longer term MA) MACD: calculation
12 periods 26 periods the “0” level MACD: comparing 2 moving averages MACD = Exp MA of 12 periods – Exp MA of 26 periods MACD: the white line Crossing below zero: sell signal Crossing above zero: buy signal
Problem This looks nice, but in reality, the results of using the MACD this way are pretty poor.
Bel20, monthly bars
Solution On the MACD line (white), a exponential moving average of 9 periods is calculated. This line is called the signal line. Crossings of the MACD with the signal line in general give earlier and better signals than crossings of the MACD with the zero line.
Bel20, monthly bars
So, how is the MACD nowadays used? MACD crosses the signal line to the upside: buy signal MACD crosses the signal line to the downside: sell signal
Positive and negative divergence   Positive divergence: price is still making new lows while the indicator is not making new lows Negative divergence: price is still making new highs while the indicator is not making new highs
Positive divergence: a rise is very probable   Positive divergence: announces a rise
Positive divergence: a rise is very probable Positive divergence: announces a rise
 
Negative divergence: a decline is very probable   Negative divergence: announces a decline
Negative divergence: a decline is very probable Negative divergence: announces a decline
 
Combining timeframes Weekly MACD & signal line are both rising => watch the bullish signals on the daily MACD. Weekly MACD & signal line are both falling => watch the bearish signals on the daily MACD.
Daily MACD WEEKLY MACD EUR/USD, daily bars
Bel20, monthly bars
Donc, comment utiliser le MACD? Ligne blanche croise au dessous de la ligne rouge:  signal de vente . Ligne blanche croise au dessus de la ligne rouge:  signal d’achat .
Mais, on peut encore faire mieux
  divergence positive divergence négative
Divergence positive: hausse trĂšs probable  Divergence positive: annonce une hausse
Divergence negative: baisse trĂšs probable  Divergence negative: annonce une baisse
 
Introduction to Technical Analysis TA: Basics Different TA subdisciplines Basic Formations Japanese Candlestick Theory Technical Indicators Fibonacci
1170-1250 Fibonacci
Fibonacci
.618 2  = 1 - .618,  .618 3  = .618 - .618 2 ,  .618 4  = .618 2  - .618 3 ,  .618 5  = .618 3  - .618 4 , etc.  1.618 2  = 1 + 1.618,  1.618 3  = 1.618 + 1.618 2 ,  1.618 4  = 1.618 2  + 1.618 3 ,  1.618 5  = 1.618 3  + 1.618 4 , etc.  1.618 - .618 = 1,  1.618 x .618 = 1,  1 - .618 = .382,  .618 x .618 = .382,  2.618 - 1.618 = 1,  2.618 x .382 = 1,  2.618 x .618 = 1.618,  1.618 x 1.618 = 2.618.  Fibonacci: 0.618 & 0.382
Fibonacci: 1 + 0.618 => golden spiral
Fibonacci: universal ratio
Fibonacci in the finacial markets
Fibonacci retracements are calculated relative to a previous move. Fibonacci retracements
 
S&P 500
BEL 20
Fibonacci extensions A A*1.618 B B*1.618 C C*1.618


Introduction to Technical Analysis

  • 1.
    Introduction to TechnicalAnalysis Karel De Bie Market Strategist BNP Paribas Fortis Global Markets FI Research. Blanmont, May 18, 2011
  • 2.
    Introduction to TechnicalAnalysis TA: Basics Different TA subdisciplines Basic Formations Japanese Candlestick Theory Technical Indicators Fibonacci
  • 3.
    TA vs FAMichigan Confidence Indicator New Home Sales Durable Goods Orders Jobless Claims ISM Manufacturng Change in Nonfarm Payrolls Unemplyment Rate Trade Balance CPI P(fa) P(fa)>P=> buy P(fa)<P=> sell 
 FA A fundamental analyst only analyzes a handful of stocks or currencies Geopolitical Situation TA Basics
  • 4.
    Technical analysts onlylook at the price (sometimes also at volumes). TA Basics PRICE CHART
  • 5.
    John J. Murphy:TA is the study of market action, primarily through the use of charts, for the purpose of forecasting future price trends. We look at price formations and technical indicators (which are all based on price and/or volume) in order to know whether to enter the market or not, and if yes: to go long or short. TA Definition PRICE CHART
  • 6.
    Loss of information: per period just the close (no OHL), the H&L are important when drawing resistance/support lines The chart: line chart
  • 7.
    The chart: barchart Bar = 1 period, 1 min to 1 year
  • 8.
    The chart: candlestick chart Candle = 1 period, 1 min to 1 year Advantage: Jap candlestick clearly visible
  • 9.
    TA basic assumptionsWe assume that all the relevant information regarding the price (political, economic, fundamental, 
 ) is already priced in or discounted in the price and that the (mass)psychology of the market participants produces recognisable recurring formations.
  • 10.
    TA can beapplied on
 Virtually all markets, provided that there is enough liquidity, volume and that there are enough market participants. Stock indices, individual stocks, currencies, commodities, interest rates, futures

  • 11.
    TA advantages Allowsus to quickly assess the market : is the market bullish, bearish or neutral? Allows us to spot opportunities . Can be applied on virtually all markets: Stock indices, individual stocks, currencies, commodities, interest rates, futures
 Applicable on all timeframes : the same techniques can be applied from intraday time frames all the way up to multi-year timeframes. Is pretty much simple and straight forward.
  • 12.
  • 13.
  • 14.
    TA Basics: TheTrend Zig-zag pattern Uptrend = sequence of higher tops ànd higher bottoms Downtrend = sequence of lower tops ànd lower bottoms Know what timeframe you’re talking about: the long term trend may be up, but the short term trend may be down.
  • 15.
  • 16.
  • 17.
  • 18.
  • 19.
  • 20.
    Trend, reversal &continuation patterns Reversal pattern Reversal pattern Continuation pattern
  • 21.
    Introduction to TechnicalAnalysis TA: Basics Different TA subdisciplines Basic Formations Japanese Candlestick Theory Technical Indicators Elliott Wave Theory Fibonacci
  • 22.
    Basic Formations: TrendLine Simplest tool within TA Connects the lows in an uptrend Below every 2 bottoms, it is possible to fine such a line, but it needs 3 points to be a valid one = support line
  • 23.
    connects the topsin a downtrend 3 tops needed to make it a valid trendline Basic Formations: Trend Line = resistance line
  • 24.
    Uptrend Support Line3 & 4: buying opportunities 5: selling opportunity pull-back possible: previous support line becomes resistance
  • 25.
  • 26.
    AEX 1 december2010: long or short?
  • 27.
    AEX : anotherbuy signal
  • 28.
     AEX :and now?
  • 29.
  • 30.
    20.90 13.70 24.2528.50 25.50
  • 31.
  • 32.
  • 33.
    EUR/USD, weekly barschart buy sell
  • 34.
  • 35.
    Basic Formations: ChannelUptrend channel resistance line over the tops, parallel to the uptrendline at least 2 Ă  3 times touched channel break-out => expect a move into the same direction with as target the vertical width of the channel projected from the break-out level. downtrend channel similar
  • 36.
    (analogous for downtrendchannel) Basic Formations: Channel Target Target Break-out Break-out Uptrend channel, break-out and target
  • 37.
    Bund 125.40 124.00122.05 fibo target
  • 38.
  • 39.
  • 40.
  • 41.
  • 42.
  • 43.
  • 44.
  • 45.
  • 46.
  • 47.
  • 48.
    Reversal Formation: Double& Triple Top Similar for a double (or triple) bottom No previous top in the double top space
  • 49.
  • 50.
  • 51.
  • 52.
    Reversal Formation: Falling/Risingwedge at the end of a trend : a reliable pattern break-out is most often powerful and targets the beginning of the wedge
  • 53.
  • 54.
  • 55.
    (Key) Reversal day& Island reversal
  • 56.
  • 57.
    S&P 500 dailybars bearish key reversal bullish key reversal bullish key reversal
  • 58.
    EUR/USD, daily candlesticksBullish key reversal day Bearish reversal day
  • 59.
    Gold, weekly barsBullish reversal weeks Bearish reversal week
  • 60.
    Continuation Pattern: FlagsUptrend during a strong trend buy the break-out in the same direction as the underlying trend flag hangs “half way” exists out of 5 to max 15 bars or candlesticks Downtrend similar
  • 61.
    1.4144 1.4225 1.412225 tics risk for 80 tics potential profit
  • 62.
  • 63.
    EUR/USD, 30min bars,Oct 5th 2010 long stop loss target 20 tics ris vs 100 tics potential profit
  • 64.
  • 65.
  • 66.
  • 67.
  • 68.
    Triangle: Reversal orContinuation Pattern
  • 69.
    Triangle Formation Resultof doubt in the market in  2/3 of the cases : continuation pattern, in  1/3 of the cases: reversal pattern volumes should decrease during the formation break-out must happen with strong volume pull-back is possible break-out between 2/3 & 3/4 are the most reliable
  • 70.
  • 71.
  • 72.
  • 73.
  • 74.
  • 75.
  • 76.
  • 77.
    Introduction to TechnicalAnalysis TA: Basics Different TA subdisciplines Basic Formations Japanese Candlestick Theory Technical Indicators Fibonacci
  • 78.
  • 79.
  • 80.
  • 81.
  • 82.
  • 83.
  • 84.
  • 85.
    Introduction to TechnicalAnalysis TA: Basics Different TA subdisciplines Basic Formations Japanese Candlestick Theory Technical Indicators Fibonacci
  • 86.
    Technical Indicators  1.500 Keep it simple all based on price (sometimes also on volume) Moving Average MACD RSI Slow Stochastics
  • 87.
    Moving Average 3kinds of MA : the simple MA the weighted MA the exponential MA simple MA is most used takes the prices of the X last periods and devides them by X. Frequently used periods are 20/50/100/200.
  • 88.
    Moving Average themovement of the MA is less capricious gives the direction of the trend the further prices move from the MA, the bigger the oversold/overbought character. Buy/sell signal when price crosses (or closes above/below) the MA.
  • 89.
    Moving Averages arethe building blocks of the MACD Different kinds of Moving Averages exist: simple MA : takes the prices of the X last periods and devides them by X weighted MA : cfr simple MA, but more weight is given to the more recent closing prices exponential MA : cfr simple MA, but the more recent prices get exponentially more weight. Frequently used periods are 20/50/100/200.
  • 90.
    How could aMA be used? A moving average gives the direction of the trend The further price moves away from its MA, the bigger the overbought/oversold character Possible ways to trade the moving average: If price crosses above the MA on a closing basis: long, if price crosses below the MA on a closing basis: short If the MA is rising: long, if the MA is falling: short
  • 91.
    Long if closingprice is above MA (a 25 period simple MA), short if closing price is below MA. Bel20, weekly bars Example of using the MA
  • 92.
    Long if closingprice is above MA (a 25 period simple MA), short if closing price is below MA. Bel20, daily bars Example of using the MA
  • 93.
    Criticism on theMA It works very nice when the market is in an uptrend or in a downtrend. But, when the market is trading sideways, you will lose money using MAs. Which MA to use? A 20/50/100/200 period? The simple/exponential
 ? In hindsight it is always easy to tell which one we should have used.
  • 94.
    100 days MAMA: great results when the market is in a clear up- or downtrend Sideways trading: you lose money when trading the MA signals
  • 95.
    100 days MA50 days MA 20 days MA Which MA to use? Afterwards, it is always clear

  • 96.
    Moving Average ConvergeneDivergence Purpose = to generate less false signals Instead of looking at the crossings of price with a MA, one looks at the crossings of 2 MAs with a different timeframe A short term exponential MA of 12 periods is compared with a longer term exponential MA of 26 periods. MACD = Exp MA (12) – Exp MA (26) The original use of the MACD was: to buy when the MACD crosses above the zero line (i.e. when the short term MA crosses above the longer term MA) to sell when the MACD crosses below the zero line (i.e. when the short term MA crosses below the longer term MA) MACD: calculation
  • 97.
    12 periods 26periods the “0” level MACD: comparing 2 moving averages MACD = Exp MA of 12 periods – Exp MA of 26 periods MACD: the white line Crossing below zero: sell signal Crossing above zero: buy signal
  • 98.
    Problem This looksnice, but in reality, the results of using the MACD this way are pretty poor.
  • 99.
  • 100.
    Solution On theMACD line (white), a exponential moving average of 9 periods is calculated. This line is called the signal line. Crossings of the MACD with the signal line in general give earlier and better signals than crossings of the MACD with the zero line.
  • 101.
  • 102.
    So, how isthe MACD nowadays used? MACD crosses the signal line to the upside: buy signal MACD crosses the signal line to the downside: sell signal
  • 103.
    Positive and negativedivergence Positive divergence: price is still making new lows while the indicator is not making new lows Negative divergence: price is still making new highs while the indicator is not making new highs
  • 104.
    Positive divergence: arise is very probable Positive divergence: announces a rise
  • 105.
    Positive divergence: arise is very probable Positive divergence: announces a rise
  • 106.
  • 107.
    Negative divergence: adecline is very probable Negative divergence: announces a decline
  • 108.
    Negative divergence: adecline is very probable Negative divergence: announces a decline
  • 109.
  • 110.
    Combining timeframes WeeklyMACD & signal line are both rising => watch the bullish signals on the daily MACD. Weekly MACD & signal line are both falling => watch the bearish signals on the daily MACD.
  • 111.
    Daily MACD WEEKLYMACD EUR/USD, daily bars
  • 112.
  • 113.
    Donc, comment utiliserle MACD? Ligne blanche croise au dessous de la ligne rouge: signal de vente . Ligne blanche croise au dessus de la ligne rouge: signal d’achat .
  • 114.
    Mais, on peutencore faire mieux
 divergence positive divergence négative
  • 115.
    Divergence positive: haussetrĂšs probable Divergence positive: annonce une hausse
  • 116.
    Divergence positive: haussetrĂšs probable Divergence positive: annonce une hausse
  • 117.
    Divergence negative: baissetrĂšs probable Divergence negative: annonce une baisse
  • 118.
    Divergence negative: baissetrĂšs probable Divergence negative: annonce une baisse
  • 119.
  • 120.
    Introduction to TechnicalAnalysis TA: Basics Different TA subdisciplines Basic Formations Japanese Candlestick Theory Technical Indicators Fibonacci
  • 121.
  • 122.
  • 123.
    .618 2 = 1 - .618, .618 3 = .618 - .618 2 , .618 4 = .618 2 - .618 3 , .618 5 = .618 3 - .618 4 , etc. 1.618 2 = 1 + 1.618, 1.618 3 = 1.618 + 1.618 2 , 1.618 4 = 1.618 2 + 1.618 3 , 1.618 5 = 1.618 3 + 1.618 4 , etc. 1.618 - .618 = 1, 1.618 x .618 = 1, 1 - .618 = .382, .618 x .618 = .382, 2.618 - 1.618 = 1, 2.618 x .382 = 1, 2.618 x .618 = 1.618, 1.618 x 1.618 = 2.618. Fibonacci: 0.618 & 0.382
  • 124.
    Fibonacci: 1 +0.618 => golden spiral
  • 125.
  • 126.
  • 127.
    Fibonacci in thefinacial markets
  • 128.
    Fibonacci retracements arecalculated relative to a previous move. Fibonacci retracements
  • 129.
  • 130.
  • 131.
  • 132.
    Fibonacci extensions AA*1.618 B B*1.618 C C*1.618
  • 133.
  • 134.
  • 135.
  • 136.
  • 137.
  • 138.
  • 139.
  • 140.
  • 141.
  • 142.

Editor's Notes

  • #3 Market capitalization has increased from EUR 2.6 billion in 1990 to EUR 20 billion at 30 June 2003. Fortis ranks among the 20 largest financial institutions in Europe. First bank in Belgium, fourth bank in the Netherlands. First insurer in the Benelux countries, second insurer via intermediaries in the Netherlands. In the United States Fortis has become number 2 in the field of &amp;quot;Preneed&amp;quot;, in other words funeral insurance. The acquisition of the voluntary dental insurance division of Protective Life in 2001 makes Fortis number one in the United States in this specific market. Fortis is very successful in the bancassurance market. Bancassurance is the sale of insurance products via the banking channel and banking products via the insurance channel. The joint venture of Maybank in 2001 underscores Fortis&apos; intention to further expand its expertise in the field of bancassurance in Asia.
  • #22 Market capitalization has increased from EUR 2.6 billion in 1990 to EUR 20 billion at 30 June 2003. Fortis ranks among the 20 largest financial institutions in Europe. First bank in Belgium, fourth bank in the Netherlands. First insurer in the Benelux countries, second insurer via intermediaries in the Netherlands. In the United States Fortis has become number 2 in the field of &amp;quot;Preneed&amp;quot;, in other words funeral insurance. The acquisition of the voluntary dental insurance division of Protective Life in 2001 makes Fortis number one in the United States in this specific market. Fortis is very successful in the bancassurance market. Bancassurance is the sale of insurance products via the banking channel and banking products via the insurance channel. The joint venture of Maybank in 2001 underscores Fortis&apos; intention to further expand its expertise in the field of bancassurance in Asia.
  • #78 Market capitalization has increased from EUR 2.6 billion in 1990 to EUR 20 billion at 30 June 2003. Fortis ranks among the 20 largest financial institutions in Europe. First bank in Belgium, fourth bank in the Netherlands. First insurer in the Benelux countries, second insurer via intermediaries in the Netherlands. In the United States Fortis has become number 2 in the field of &amp;quot;Preneed&amp;quot;, in other words funeral insurance. The acquisition of the voluntary dental insurance division of Protective Life in 2001 makes Fortis number one in the United States in this specific market. Fortis is very successful in the bancassurance market. Bancassurance is the sale of insurance products via the banking channel and banking products via the insurance channel. The joint venture of Maybank in 2001 underscores Fortis&apos; intention to further expand its expertise in the field of bancassurance in Asia.
  • #86 Market capitalization has increased from EUR 2.6 billion in 1990 to EUR 20 billion at 30 June 2003. Fortis ranks among the 20 largest financial institutions in Europe. First bank in Belgium, fourth bank in the Netherlands. First insurer in the Benelux countries, second insurer via intermediaries in the Netherlands. In the United States Fortis has become number 2 in the field of &amp;quot;Preneed&amp;quot;, in other words funeral insurance. The acquisition of the voluntary dental insurance division of Protective Life in 2001 makes Fortis number one in the United States in this specific market. Fortis is very successful in the bancassurance market. Bancassurance is the sale of insurance products via the banking channel and banking products via the insurance channel. The joint venture of Maybank in 2001 underscores Fortis&apos; intention to further expand its expertise in the field of bancassurance in Asia.
  • #121 Market capitalization has increased from EUR 2.6 billion in 1990 to EUR 20 billion at 30 June 2003. Fortis ranks among the 20 largest financial institutions in Europe. First bank in Belgium, fourth bank in the Netherlands. First insurer in the Benelux countries, second insurer via intermediaries in the Netherlands. In the United States Fortis has become number 2 in the field of &amp;quot;Preneed&amp;quot;, in other words funeral insurance. The acquisition of the voluntary dental insurance division of Protective Life in 2001 makes Fortis number one in the United States in this specific market. Fortis is very successful in the bancassurance market. Bancassurance is the sale of insurance products via the banking channel and banking products via the insurance channel. The joint venture of Maybank in 2001 underscores Fortis&apos; intention to further expand its expertise in the field of bancassurance in Asia.