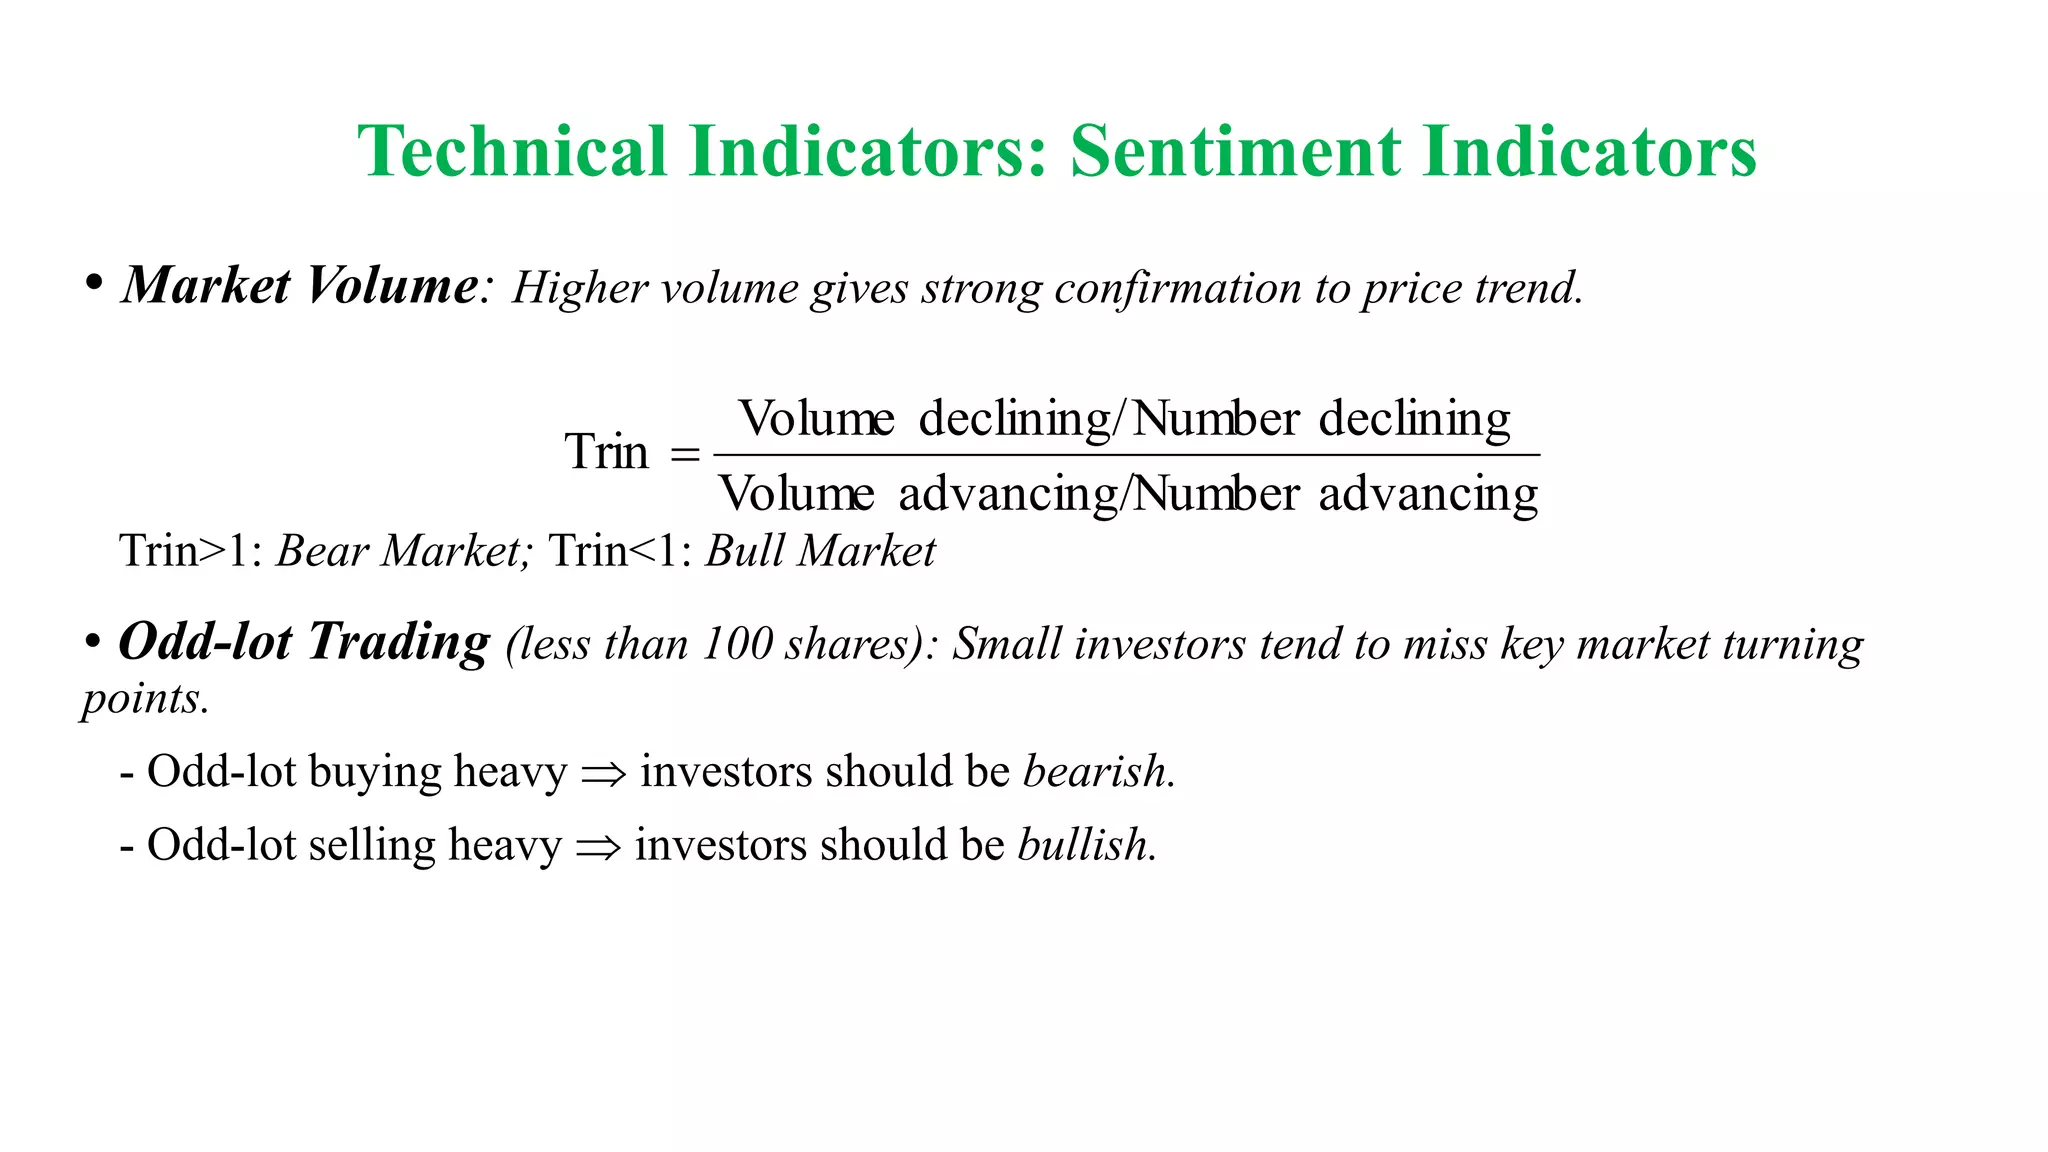
The document discusses technical analysis and its key concepts. It defines technical analysis as identifying trend reversals using indicators to analyze relationships between price, volume, and demand/supply. The assumptions of technical analysis are that the market discounts all information and moves in trends. Charting techniques discussed include Dow theory, identifying primary/secondary trends, and support/resistance levels. Technical indicators examined include moving averages, where crossing the average provides buy/sell signals. Sentiment indicators like volume and odd-lot trading are also summarized.
Technical analysis uses charts of market action to detect trends and predict future prices based on the idea that history repeats itself. Various technical indicators are used to analyze price, time, volume, and market breadth to identify trend changes. Dow theory analyzes market averages to identify primary bull and bear markets through confirmation between averages. Charts like line charts, bar charts, and point and figure charts along with common patterns like triangles, head and shoulders, and rectangles are used to identify trends and signals.
An overview of technical analysis and its common techniques (Candlestick , MACD, Parabolic SAR, RSI, Bolinger Bands etc) - given to brokers and managers of Nepal Derivative Exchange (NDEX) by Mr. Sohan Khatri (Resource person - Management Association of Nepal, Adjunct Faculty - Ace Institute of Management, Kathmandu College of Management)
The document provides an overview of technical analysis techniques used to analyze stock price movements and identify trends. It discusses concepts like trend identification, support and resistance levels, moving averages, chart patterns, candlestick patterns, and indicators like pivot points and gaps. The origin and key assumptions of technical analysis are explained. Different chart types are described, including line charts, bar charts, and candlestick charts. Common patterns like head and shoulders, triangles, and flags are also outlined.
Financial markets facilitate the buying and selling of financial instruments between savers and investors. They act as intermediaries that allow households to deposit surplus funds with banks or purchase securities from businesses, and allow businesses to access funds from households. Financial markets have several key functions, including mobilizing savings, facilitating price discovery, providing liquidity to financial assets, and reducing transaction costs. The major financial markets in India are the money market, stock market, and bond market. The money market deals in short-term debt instruments with maturities of up to one year and includes sub-markets for call money, treasury bills, commercial paper, and certificates of deposit.
Technical indicators are mathematical representations of market patterns and behavior that are used to generate buy and sell signals and confirm price movements. Some common leading indicators that precede price movement include RSI, Parabolic SAR, Stochastic, and Williams %R. Lagging indicators like MACD and moving averages follow price movement. Technical analysis uses indicators like RSI, Stochastic, and Bollinger Bands to identify overbought and oversold markets. Divergences between indicators and prices also signal potential trend reversals.
Technical analysis OF STOCK MARKET presentation of mba 4 sem FINANCE PPTBabasab Patil
Technical analysis is the forecasting of security prices based on past price movements. It uses various charts like line charts, bar charts, and candlestick charts to identify trends and patterns in prices over time. Key assumptions of technical analysis include that markets move in trends, and that history repeats itself. Common techniques include analyzing support and resistance levels, moving averages, and identifying continuation and reversal patterns. The goal is to anticipate future price movements based on historical price data.
This document provides an overview of security analysis, which involves analyzing tradeable financial instruments like stocks, bonds, and derivatives. It discusses the main approaches to security analysis: fundamental analysis and technical analysis. Fundamental analysis examines underlying business and economic factors, while technical analysis focuses on price trends and momentum. The document then goes into more detail about fundamental analysis and the three steps involved: economic analysis, industry analysis, and company analysis. It provides examples of key variables to consider in each type of analysis.
These are the slides used during the seminar "Introduction to Technical analysis". Will be blogging more about them in detail in further posts. Check out my blog http://trilokhg.blogspot.com for more.
This document provides an overview of bonds, including their meaning, classifications, issuance procedures, and important terms. It discusses government bonds, corporate bonds, secured/unsecured bonds, and bond yields. It also covers international bonds such as Eurobonds, foreign bonds, and bond markets. Examples are given of debt crises in Pakistan and Sri Lanka related to rising external debt levels.
Technical analysis is an approach to security analysis that attempts to predict stock price movements by examining historical price data. It believes that stock prices are influenced by both rational and irrational demand and supply factors reflected in the price trends. The basic principles of technical analysis are that stock prices move in trends, shifts in demand and supply can be detected through price charts, and these patterns can be used to forecast future price movements. Dow theory, the roots of modern technical analysis, proposes that the stock market has primary long-term trends, secondary counter-trends, and minor day-to-day fluctuations.
The document traces the evolution of derivatives markets in India from 1950 to present day. It discusses how commodities futures trading began in 1950 but declined in the 1960s when many markets were closed due to price speculation. The government then banned derivatives trading in 1969 but revived markets in the late 1990s. Since then, various commodity and financial derivatives have been introduced and are regulated by organizations like SEBI and FMC. Key developments included the introduction of stock index futures and options in 2000. The document also outlines the benefits, categories, and regulatory aspects of derivatives trading in India.
This document discusses different types of fundamental analysis used to evaluate investments including economic analysis, industry analysis, and company analysis. It outlines factors considered in each type of analysis such as macroeconomic factors for economic analysis, the industry life cycle and competitive conditions for industry analysis, and financial and non-financial internal and external factors for company analysis. The goal of fundamental analysis is to evaluate the past and expected future performance of economies, industries, and companies to inform investment decisions.
Technical analysis is a method of forecasting the direction of prices through studying past market data like price and volume. It assumes that market patterns repeat and prices move in trends. The key tenets of technical analysis are that: 1) Price movement is determined by supply and demand forces, 2) Trends persist but also reverse, 3) Price patterns repeat. Technical analysis uses charts and patterns to identify trends and predict future price behavior, in contrast to fundamental analysis which examines financial statements.
This document discusses methods for valuing equity shares based on capitalizing dividends and earnings. It describes dividend valuation models including no growth, constant growth, and supernormal growth cases. The constant growth model values shares based on infinite streams of dividends growing at a constant rate. The supernormal growth model accounts for high initial dividend growth transitioning to normal long-term growth.
This presentation discusses foreign exchange (FOREX) markets. It begins by defining FOREX as the global market for trading currencies, and explains that fluctuations in exchange rates are influenced by economic, political, and social factors among countries. It then compares currency trading to stock trading, noting benefits of currency trading like lower costs, higher liquidity, and opportunities to profit from both rising and falling exchange rates. The document also covers nominal vs real exchange rates, and theories for determining exchange rates in the long run like purchasing power parity and interest rate parity.
This document summarizes the efficient market hypothesis (EMH) in three sentences:
The EMH states that market prices fully reflect all available public information and adjust instantly to new information. It has three forms - weak, semi-strong, and strong - with each form incorporating more types of information. Most research supports the weak and semi-strong forms, finding that historical data and public information are reflected in prices, but the strong form is not supported as non-public information can be used to earn excess returns.
Technical analysis is a method of forecasting the direction of prices through the study of past market data, such as historical prices and trading volumes. It assumes that market behavior repeats itself, and that current prices already reflect all known information. Technical analysts use various methods and tools like charts, indicators and patterns to identify trends and trend reversals in the market. Some of the common technical analysis techniques include Dow theory, Elliott wave theory, and the use of charts like line charts, bar charts and Japanese candlestick charts to identify patterns in price movements over time.
Introduction
Concepts of technical analysis
Principles of technical analysis
Techniques of technical analysis
Daily Volumes of transactions
Floating Stock
Price Trends
Rate of change Method (ROC)
Japanese Candle Stick Method
Dow Theory
Elliot Wave Theory
Advance and Decline Lines Method
Relative Strength Index
This document provides an overview of the structure and components of the capital market. It defines the capital market as the market for securities where companies and governments can raise long-term funds, including the stock and bond markets. The capital market has major elements such as financial assets/instruments, financial intermediaries that channel savings to investments, and financial markets that facilitate transactions. It also describes the primary market where new stock is issued and the secondary market where existing stock is traded, such as the Bombay Stock Exchange in India.
The document provides an overview of the commodity market in India, including:
1) It discusses what commodities are, traces of commodity trading in Indian history, and the significance of the commodity market in India, which involves over 50% of GDP.
2) It describes how commodity trading is controlled by national and regional exchanges regulated by the Forward Markets Commission (FMC), with the top 3 national exchanges holding over 90% of the market share.
3) It briefly outlines how commodity trading is done through various instruments on the exchanges and provides some tips for making money in the commodity market by investing in funds.
The document discusses various technical chart patterns and formations that can be used for analysis, including reversal patterns like rounding bottoms, double bottoms, and double tops. It also mentions continuation patterns like three white soldiers and three black crows. Specific candlestick reversal patterns like bullish engulfing and bearish engulfing are listed. The document provides examples of analyzing the Energy Development Corporation stock using reversal patterns over 6 months. It also outlines other patterns like head and shoulders, flags and pennants, and Elliot wave theory.
This document provides an overview of Elliott Wave analysis for investments. It explains that Elliott Waves consist of impulse waves, which move in the direction of the trend, and corrective waves, which move against the trend. Impulse waves have 5 sub-waves, while corrective waves have 3 sub-waves. The document defines different Elliott Wave patterns like zigzags, flats, and triangles as well as extensions, truncations, and ending diagonals. An example wave pattern is provided.
The document discusses various aspects of foreign exchange including:
- The forex market trades over $4 trillion daily, more than the entire US GDP annually.
- Foreign exchange refers to trading one country's currency for another at exchange rates.
- In India, forex trading by individuals is considered illegal and punishable by imprisonment.
This document provides an overview of technical analysis. It defines technical analysis as the study of market behavior by analyzing price action and volume data over time. The key principles of technical analysis are that price discounts all factors, the market moves in identifiable patterns and cycles, and trends tend to persist until clear signals indicate a reversal. Technical analysis uses various chart types like line charts, bar charts and volume charts to identify patterns in historical market data and make predictions about future price movements. The document outlines some basic terminology and chart types used in technical analysis.
- Dow theory was formulated from a series of editorials by Charles Dow, who believed the stock market could be used to measure business conditions.
- The theory uses trend analysis to determine the overall market direction by identifying primary, secondary, and minor trends. A primary trend remains in effect until a confirmed reversal occurs through peak-and-trough analysis.
- The theory also outlines bull and bear market phases including accumulation, public participation, and excess/panic phases. Market indexes must confirm each other's trends and volume must support price movements.
Fundamental analysis is a method of evaluating securities that involves performing an analysis of the underlying company and industry. It examines factors like the overall economy, industry conditions, and the financial condition and management of companies to determine a company's intrinsic value. The analysis involves evaluating economic, industry, and company-specific factors to estimate future earnings and stock prices. Some key aspects of fundamental analysis include analyzing the economy, industry life cycles, and individual company financials and operations.
- Technical analysis uses indicators like trends, chart patterns, and support/resistance levels to identify trading opportunities. It studies how market forces like supply and demand interact with price.
- Key concepts include identifying primary, secondary, and minor trends in prices; recognizing common chart patterns like head and shoulders, double tops/bottoms; and determining pivot points, gaps, and support/resistance levels.
- Charts like line charts, bar charts, and point and figure charts are used to visualize price movements over time and identify trends and trading signals. Technical analysis assumes past price movement predicts future prices.
Dow Theory is based on articles published by Charles Dow in the early 1900s. It describes market trends and uses trends in stock averages to predict market movements. There are three types of trends - primary, secondary, and minor. For a trend to be confirmed, stock indices must move in the same direction and volume must confirm the trend. Trends persist until a clear reversal is seen. Dow Theory has been criticized for only recognizing trend changes after they occur.
Security analysis (technical) and portfolio managementHarish Khan
This document provides an overview of technical analysis tools and concepts used in portfolio management. It discusses Dow theory, trends in bull and bear markets, chart patterns like head and shoulders and symmetrical triangles, and the efficient market hypothesis. It also summarizes the phases of portfolio management including security analysis, portfolio analysis models like BCG, portfolio selection using Markowitz theory, and portfolio revision and evaluation. Technical analysis tools and modern portfolio theory principles are used to construct optimal portfolios balancing risk and return.
Axis Direct offers a introductory course on Technical Analysis. It will cover the background and basic aspects of technical analysis
For more information visit :
https://simplehai.axisdirect.in/learn/eclasses
The document provides an overview of technical and statistical analysis concepts such as charts, patterns, momentum, Dow theory, Elliott wave theory, cycle theory, random walk theory, and contrarian theory. It explains tools like moving averages, support and resistance levels, and common chart patterns that technical analysts use to identify trends and time entries into the market. The goal of technical analysis is to forecast future price movements by quantitatively studying historical price data, trading volume, and open interest.
Technical analysis is the study of stock price movements by analyzing historical price data like charts and indicators. It assumes market prices reflect all known information and historical trends will repeat. Common techniques include analyzing price patterns, support/resistance levels, candlestick/line charts, moving averages, and indicators like RSI. Reversal patterns like head and shoulders or double tops signal trend changes, while continuation patterns like flags/triangles suggest pause before trend resumes. Technical analysis has weaknesses like requiring experience, potential bias, and inability to predict new phenomena.
This document provides an overview of technical analysis. It discusses how technical analysis is used to identify trend reversals and formulate buying and selling strategies using indicators to analyze relationships between price and volume. The assumptions of technical analysis are that the market is determined by supply and demand, discounts all information, and moves in trends. The main theories discussed are Dow theory, which analyzes primary, secondary, and minor trends similar to tides, waves, and ripples in water. Primary trends can be bull or bear markets lasting 1-2 years, secondary trends correct the primary trend over 3 weeks to months, and minor trends are daily price fluctuations. Charts are provided to illustrate the different trend patterns.
This document provides an overview of technical analysis approaches for understanding the market. It discusses the philosophy and assumptions behind technical analysis, including that prices move in trends and history repeats itself. It defines key concepts like trends, support and resistance, and different charting styles. It also covers reversal and continuation patterns, the principle of confirmation and divergence, and introduces MetaTrader 4 platform and indicators. The document is the first part of an outline on technical analysis and previews topics to be covered in more depth in part two.
This document provides an overview of technical analysis. It defines technical analysis as attempting to forecast stock prices based on market data like price and volume over time. Technicians look for trends and patterns that may indicate future price movements. The document discusses various chart types, patterns, indicators, and theories used in technical analysis like moving averages, MACD, RSI, Dow Theory and Elliott Wave. It also notes some of the potential benefits of market timing but challenges of doing so successfully. In summary, the document introduces the key concepts and techniques of the technical analysis approach to analyzing financial markets.
Technical analysis is the attempt to forecast stock prices based on historical market data like price, volume, and other indicators. Technicians look for trends and patterns in this data that may indicate future price movements. They use various charts like bar charts and candlestick charts to analyze this data and look for patterns. Technical analysts do not consider fundamental factors like financial statements. The goal is to predict short-term price movements through analysis of historical price patterns and indicators.
The document provides an overview of technical analysis. It defines technical analysis as identifying trend reversals using indicators such as price, volume, support/resistance levels, and chart patterns. It discusses various technical analysis tools like moving averages, oscillators, and chart patterns that are used to identify trends and potential reversals. The key difference between technical and fundamental analysis is that technical analysis focuses on internal market data like price and volume, while fundamental analysis considers external factors like the economy and company performance.
Rectangles are consolidation patterns that signify indecision between buyers and sellers. They form when price ranges between high and low barriers with alternating highs and lows, and volume tapers off over time. The breakout from the rectangle is reliable, with prices unlikely to return once broken. Target price moves are usually the height of the rectangle. Flags are short, slight price trends within a larger movement that last 1-2 weeks. Rounding bottoms form at market bottoms as investor interest wanes, signaling a reversal from bearish to bullish.
This document provides information on different types of financial market analysis, including fundamental analysis and technical analysis. Fundamental analysis studies factors like economic conditions and company financials, while technical analysis focuses solely on price patterns and trends. Several technical analysis techniques are described, including trend lines, support and resistance levels, consolidation and breakouts. Common chart types for technical analysis like line charts, bar charts, and candlestick charts are also mentioned. The document aims to explain the basic concepts and approaches of both fundamental and technical analysis.
This presentation gives you an overview of technical analysis. Technical Analysis basically suggests us "WHEN" to invest. This presentation will give a brief idea of Dow's Theory and different types of graphs used in share market to demonstrate a specific stock (5 types of graphs).
Technical analysis uses statistical data from market activity, past prices and trading volumes to identify patterns and indicators that can predict a security's future performance. Hundreds of techniques exist, including chart patterns like bar charts, candlestick charts and point and figure charts that consolidate supply and demand forces into a visual representation. Technicians believe prices move in predictable trends and patterns until a change causes the trend to reverse, and chart analysis helps identify support and resistance price levels as well as common patterns like double tops/bottoms and head and shoulders formations that can signal trend reversals.
This document provides an overview of technical analysis. It begins by explaining the philosophy behind technical analysis, which is that all known information is reflected in market prices and that prices tend to move in trends and repeat patterns due to human psychology. It then contrasts technical analysis with fundamental analysis. The rest of the document describes various technical tools used to analyze market trends and patterns, including charts (line, bar, candlestick), trend lines, support and resistance levels, moving averages, common patterns like head and shoulders and triangles, and indicators like MACD, RSI, Bollinger Bands, and stochastic oscillators. Fibonacci retracements are also discussed.
This document provides an overview of fundamental and technical analysis techniques used to analyze stocks. It discusses macroeconomic, industry, and company analysis as part of fundamental analysis. Key factors are analyzed for the economy, industry classifications, and individual companies. Technical analysis techniques covered include charts, trends, support/resistance levels, moving averages, oscillators, and Dow theory. Mathematical indicators are used to smooth price movements and identify overbought and oversold conditions.
Fundamental analysis examines factors like a company's financial statements, management, and competitors to determine a security's intrinsic value. Technical analysis uses historical stock price movements and trading volume to identify patterns and predict future price movements. This presentation discusses both fundamental and technical analysis approaches. It defines concepts like moving averages, support/resistance levels, and patterns like head and shoulders and double bottoms that technical analysts use to identify trends and make trading decisions.
Strategies for Effective Upskilling is a presentation by Chinwendu Peace in a Your Skill Boost Masterclass organisation by the Excellence Foundation for South Sudan on 08th and 09th June 2024 from 1 PM to 3 PM on each day.
How to Setup Warehouse & Location in Odoo 17 InventoryCeline George
In this slide, we'll explore how to set up warehouses and locations in Odoo 17 Inventory. This will help us manage our stock effectively, track inventory levels, and streamline warehouse operations.
A review of the growth of the Israel Genealogy Research Association Database Collection for the last 12 months. Our collection is now passed the 3 million mark and still growing. See which archives have contributed the most. See the different types of records we have, and which years have had records added. You can also see what we have for the future.
How to Add Chatter in the odoo 17 ERP ModuleCeline George
In Odoo, the chatter is like a chat tool that helps you work together on records. You can leave notes and track things, making it easier to talk with your team and partners. Inside chatter, all communication history, activity, and changes will be displayed.
Exploiting Artificial Intelligence for Empowering Researchers and Faculty, In...Dr. Vinod Kumar Kanvaria
Exploiting Artificial Intelligence for Empowering Researchers and Faculty,
International FDP on Fundamentals of Research in Social Sciences
at Integral University, Lucknow, 06.06.2024
By Dr. Vinod Kumar Kanvaria
it describes the bony anatomy including the femoral head , acetabulum, labrum . also discusses the capsule , ligaments . muscle that act on the hip joint and the range of motion are outlined. factors affecting hip joint stability and weight transmission through the joint are summarized.
Main Java[All of the Base Concepts}.docxadhitya5119
This is part 1 of my Java Learning Journey. This Contains Custom methods, classes, constructors, packages, multithreading , try- catch block, finally block and more.
ISO/IEC 27001, ISO/IEC 42001, and GDPR: Best Practices for Implementation and...PECB
Denis is a dynamic and results-driven Chief Information Officer (CIO) with a distinguished career spanning information systems analysis and technical project management. With a proven track record of spearheading the design and delivery of cutting-edge Information Management solutions, he has consistently elevated business operations, streamlined reporting functions, and maximized process efficiency.
Certified as an ISO/IEC 27001: Information Security Management Systems (ISMS) Lead Implementer, Data Protection Officer, and Cyber Risks Analyst, Denis brings a heightened focus on data security, privacy, and cyber resilience to every endeavor.
His expertise extends across a diverse spectrum of reporting, database, and web development applications, underpinned by an exceptional grasp of data storage and virtualization technologies. His proficiency in application testing, database administration, and data cleansing ensures seamless execution of complex projects.
What sets Denis apart is his comprehensive understanding of Business and Systems Analysis technologies, honed through involvement in all phases of the Software Development Lifecycle (SDLC). From meticulous requirements gathering to precise analysis, innovative design, rigorous development, thorough testing, and successful implementation, he has consistently delivered exceptional results.
Throughout his career, he has taken on multifaceted roles, from leading technical project management teams to owning solutions that drive operational excellence. His conscientious and proactive approach is unwavering, whether he is working independently or collaboratively within a team. His ability to connect with colleagues on a personal level underscores his commitment to fostering a harmonious and productive workplace environment.
Date: May 29, 2024
Tags: Information Security, ISO/IEC 27001, ISO/IEC 42001, Artificial Intelligence, GDPR
-------------------------------------------------------------------------------
Find out more about ISO training and certification services
Training: ISO/IEC 27001 Information Security Management System - EN | PECB
ISO/IEC 42001 Artificial Intelligence Management System - EN | PECB
General Data Protection Regulation (GDPR) - Training Courses - EN | PECB
Webinars: https://pecb.com/webinars
Article: https://pecb.com/article
-------------------------------------------------------------------------------
For more information about PECB:
Website: https://pecb.com/
LinkedIn: https://www.linkedin.com/company/pecb/
Facebook: https://www.facebook.com/PECBInternational/
Slideshare: http://www.slideshare.net/PECBCERTIFICATION
Walmart Business+ and Spark Good for Nonprofits.pdfTechSoup
"Learn about all the ways Walmart supports nonprofit organizations.
You will hear from Liz Willett, the Head of Nonprofits, and hear about what Walmart is doing to help nonprofits, including Walmart Business and Spark Good. Walmart Business+ is a new offer for nonprofits that offers discounts and also streamlines nonprofits order and expense tracking, saving time and money.
The webinar may also give some examples on how nonprofits can best leverage Walmart Business+.
The event will cover the following::
Walmart Business + (https://business.walmart.com/plus) is a new shopping experience for nonprofits, schools, and local business customers that connects an exclusive online shopping experience to stores. Benefits include free delivery and shipping, a 'Spend Analytics” feature, special discounts, deals and tax-exempt shopping.
Special TechSoup offer for a free 180 days membership, and up to $150 in discounts on eligible orders.
Spark Good (walmart.com/sparkgood) is a charitable platform that enables nonprofits to receive donations directly from customers and associates.
Answers about how you can do more with Walmart!"
LAND USE LAND COVER AND NDVI OF MIRZAPUR DISTRICT, UPRAHUL
This Dissertation explores the particular circumstances of Mirzapur, a region located in the
core of India. Mirzapur, with its varied terrains and abundant biodiversity, offers an optimal
environment for investigating the changes in vegetation cover dynamics. Our study utilizes
advanced technologies such as GIS (Geographic Information Systems) and Remote sensing to
analyze the transformations that have taken place over the course of a decade.
The complex relationship between human activities and the environment has been the focus
of extensive research and worry. As the global community grapples with swift urbanization,
population expansion, and economic progress, the effects on natural ecosystems are becoming
more evident. A crucial element of this impact is the alteration of vegetation cover, which plays a
significant role in maintaining the ecological equilibrium of our planet.Land serves as the foundation for all human activities and provides the necessary materials for
these activities. As the most crucial natural resource, its utilization by humans results in different
'Land uses,' which are determined by both human activities and the physical characteristics of the
land.
The utilization of land is impacted by human needs and environmental factors. In countries
like India, rapid population growth and the emphasis on extensive resource exploitation can lead
to significant land degradation, adversely affecting the region's land cover.
Therefore, human intervention has significantly influenced land use patterns over many
centuries, evolving its structure over time and space. In the present era, these changes have
accelerated due to factors such as agriculture and urbanization. Information regarding land use and
cover is essential for various planning and management tasks related to the Earth's surface,
providing crucial environmental data for scientific, resource management, policy purposes, and
diverse human activities.
Accurate understanding of land use and cover is imperative for the development planning
of any area. Consequently, a wide range of professionals, including earth system scientists, land
and water managers, and urban planners, are interested in obtaining data on land use and cover
changes, conversion trends, and other related patterns. The spatial dimensions of land use and
cover support policymakers and scientists in making well-informed decisions, as alterations in
these patterns indicate shifts in economic and social conditions. Monitoring such changes with the
help of Advanced technologies like Remote Sensing and Geographic Information Systems is
crucial for coordinated efforts across different administrative levels. Advanced technologies like
Remote Sensing and Geographic Information Systems
9
Changes in vegetation cover refer to variations in the distribution, composition, and overall
structure of plant communities across different temporal and spatial scales. These changes can
occur natural.
2. Concept of Technical Analysis
•Technical Analysis is the process of identifying trend
reversals at an earlier stage
• to formulate the buying and selling strategy with the help of
several indicators
• to analyze the relationship between Price, volume of supply-
demand for the overall market and the individual stock.
•Attempts to exploit stock price patterns for profit.
•Assumes prices adjust slowly to their true equilibrium values
3. Assumptions of Technical Analysis
1) The market value is determined by interaction of demand
and supply.
2) The market discounts everything. (fears, hopes, inside
information, right issue, bonus shares, earnings, loss etc.)
3) The market always moves in a trend. (increasing or
decreasing)
4) In rising market, prices move up and falling markets, prices
fall.
5) It assumes that past prices predict the future.
4.
5.
6. The Dow Theory
•Uses price and volume trends to predict stock prices.
•Identifies primary, secondary, and tertiary trends.
•Predicts support and resistance price levels.
The theory has three types of market movements
• the primary trend, the intermediate trend and the short term trend.
• The primary trend may be the broad upward or downward movement which
can often last a year or more.
• The intermediate trend is corrective movement, which can move against the
primary trend and may last for one month to several months.
• The short term trend refers to day to day price movements testing for few
hours to few days.
• These trends are compared to tide waves and ripples of the sea, which are
called fluctuations.
7. The Dow Theory
• It employs two of the Dow Jones averages,
• the industrial average and
• the transportation average.
• The theory is based on the assertion that
• measures of stock prices tend to move together.
• If the Dow Jones industrial average is rising, then the transportation
average should also be rising. Such simultaneously price movements
suggest a strong bull market.
• Conversely, a decline in both industrial and transportation averages
moving in the opposite direction, the market is uncertain as to the
direction of future stock prices.
9. Hypothesis of Dow Theory
Charles Dow developed this theory to explain the movement of indices on the
basis of certain hypothesis.
1) No single individual can influence the major trend of the market.
2) Market discounts every thing (calamities, fire etc.)
3) It is not a tool but provides way to understand the theory better.
10. LIMITATIONS OF DOW THEORY
Following are the limitations of Dow Theory:
• It is not a theory but only an interpretation of known data.
• A theory should be able to explain why a phenomenon occurs.
• No attempt is made to explain why the two averages should be able
to forecast future prices.
• Since it does not explain why two averages to forecast future stock
prices, it is not acceptable in its forecast.
• Because there was a considerable lag between the actual turning
points and those indicated by the forecast.
• The Dow Theory has poor predictive power and lack accuracy.
• Therefore it has been subject to much criticism, as the results are less
accurate.
11. Trend
• A trend is a direction of movement.
• Share prices can either increase or fall or remain flat
• These directions are known as rising, falling and flat trend
• But share prices do not rise or fall in straight line
• The rise or fall in price experiences a counter move
• If a share price increase, the counter move will be a fall in price and vice versa.
• The share prices move in a zig zag manner
13. PRIMARY TREND
• The prices of a stock may be either move up or come down.
• Upward trend in the market is called “bull market” which shows three peaks.
• Each peak is higher then the previous one.
• Similarly the downward trend.
• The reactions after peak halts before the previous bottom leading to revival after
three peaks.
• The upward trend is characterized by three stages namely
• accumulative, gig and excess.
• The phases leading to peaks improve the corporate profit margin and encourage
more investors to buy stocks and attract speculation.
•
• Similarly in second phase, the corporate prices rise further and in the third phase,
prices advance due to speculation and inflation.
• The three phases of bull market are shown in the chart below,
• If the market shows a downward trend, it is called “bear market” in the case of bear
market, the reverse will happen.
15. Bull Market
Y
T3
P T2
R
I Speculation
C Phase 3
E T1
B2
Good corporate
earning Phase -2
B1
Revival of Market confidence Phase – 1
X
DAYS
16. Bear Market
The first phase of fall begins with loss of hopes where the increase in prices is much lower
than previous high forcing the investors to sell the securities.
In the second phase companies report low profits and declare lesser dividend which lead to
selling pressure. In the final phase there is heavy sale of shares.
The primary bear market is characterized by three stages namely distribution, big move and
despair.
Y
LOSS OF HOPE (PHASE – 1)
T1
RECESSION IN BUSINESS (PHASE -2)
T2
B1 DISTRESS
SELLING
PHASE – 3)
B2
B3
X
DAYS
17. SECONDARY OR INTERMEDIATE TREND
The intermediate trend moves against the main trend and leads to correction.
In the bull market, the intermediate trend results in fall while in the bear market, the intermediate trend carries the
price upward and corrects the primary trend and the correction would be 33% to 66% of the earlier rise or fall.
The intermediate trend is quicker compared to primary trend.
SHORT TERM TREND
The short term trend is the daily price fluctuation which tries to correct the intermediary trend movements, it
should be noted that the investors should concentrate more on primary and intermediate trends and not on the
minor trends.
The above three are the three stages of primary bull market and primary bear market.
Y BULL MARKET
P
R B
I A
C 33% to 66% of ‘B’
E 33% to 66% of ‘A’
X
DAYS
18. SUPPORT AND RESISTANCE LEVEL
• Anybody who is interested in technical analysis should possess the knowledge
of support and resistance level.
• A support level exists at a price where considerable demand for that stock is
expected to prevent further fall in the price level.
• The fall in the price may be halted for the time being or it may result even in
price reversal.
• In the support level, demand for the particular scrip is expected.
• In the resistance level, the supply of scrip would be greater than the demand
and further rise in price is prevented.
• The selling pressure is greater and the increase in the price is halted for the
time being.
20. RESISTANCE LEVEL
Y
P
R
I RESISTANCE LEVEL
C
E
X
DAYS
Support and resistance usually occur whenever the turnover of a large number of shares tends to be concentrated
at several price levels.
When the stock touches a certain level and then drops, this is called resistance and if the stock reaches down to
certain level and then rises there exists a support.
The levels can switch from resistance to support or from support to resistance.
21. Technical Analysis and EMH
• Technical analysis clashes with the EMH hypothesis.
• EMH predicts rapid adjustment of prices with the onset of new
information.
• Evidence for the success of technical analysis is poor.
22. Charting: Elliott Wave Theory
• Stock prices can be described by a set of wave patterns
• Long-term and short-term wave cycles are super imposed on each other
• By interpreting the cycles, one can predict broad movements
25. Charting: A Warning
• Seeing patterns that don’t exists
• After the fact, one can always find patterns and trading rules that would
have generated enormous profits
• What has worked in the past may not work in the future.
27. Technical Indicators: Sentiment Indicators
• Market Volume: Higher volume gives strong confirmation to price trend.
Trin>1: Bear Market; Trin<1: Bull Market
• Odd-lot Trading (less than 100 shares): Small investors tend to miss key market turning
points.
- Odd-lot buying heavy investors should be bearish.
- Odd-lot selling heavy investors should be bullish.
advancing
Number
advancing/
Volume
declining
Number
declining/
Volume
Trin
28. Market Structure Indicators
Moving Averages
• Average price over some historical period (5 weeks or 200 days)
• When current price crosses the average, a trading signal occurs
• Bullish signal when the current price rises above the moving average
• Bearish sign when the current price falls below the moving average
29. Technical Indicators: Market Structure
Moving Average: Average over a given interval,
continuously updated.
Price
And
M.A.
Time
Price
Moving Average
Averaging interval
Bearish Signal
Bullish Signal
Dow theory -- A technique that attempts to discern long- and short-term trends in stock market prices.
The primary trend is the long-term movement of prices, lasting from several moths to several years.
Secondary or intermediate trends are caused by short-term deviations of prices from the underlying trend line. (These deviations are eliminated via corrections when prices revert back to trend values).
Tertiary or minor trends are daily fluctuations of little importance.
Support level -- A price level below which it is supposedly unlikely for a stock or stock index to fall.
Resistance level -- A price level above which it is supposedly unlikely for a stock or stock index to rise.
Perspective: Expect the question, “If you’re so smart, why don’t you make the money technical analysts make?” The answer is that many people will pay for the illusion of certainty. After all, palm readers have been around for a long time.
Kontradieff wave theory: Market moves in cycles of 50yrs…yeah right!
Show coin toss pattern.
Show movie about who wins the superbowl.
Perspective: An old exercise that Burton Malkiel has used might be helpful here. Have the students construct a chart of a hypothetical stock’s price changes using coin tosses. Start with a stock price of $50. Let the price rise by a dollar if a head is tossed. Let the price fall by a dollar if a tail is tossed. Construct these charts for 30 to 50 “days” (one toss per day). With 15 or more students in the class, the chances are good for getting some ”classic” patterns. (See A Random Walk Down Wall Street).
Market advances are a more favorable omen of continued price increases when they are associated with increased trading volume (see homework problem 2). Market reversals are considered more bearish when associated with higher volume.
The trin statistic is the ratio of the average volume of a declining issue divided by the average volume of an advancing issue.
Odd-lot trading – Assumes that small investor are stupid! The theory that net buying of small investors is a bearish signal for a stock.
Assumption is that odd-lot traders don’t know what they are doing.
Odd lot is fewer than a round lot of 100 shares.
When the market price breaks thorugh the moving average line from below, it is taken as a bullish signal .
When prices fall below the moving average, it is considered time to sell.
MA piercing price from below: bullish signal (shift from falling to raising)
Price piercing MA from above: bearish signal (shift from raising to falling)
Two popular moving averages are the 200-day and the 53 -week moving averages.