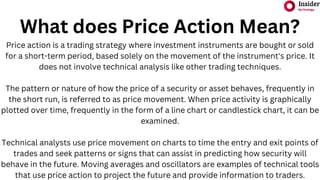
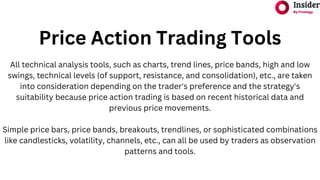
What does Price Action Mean?
Price action is a trading strategy where investment instruments are bought or sold
for a short-term period, based solely on the movement of the instrument's price. It
does not involve technical analysis like other trading techniques.
The pattern or nature of how the price of a security or asset behaves, frequently in
the short run, is referred to as price movement. When price activity is graphically
plotted over time, frequently in the form of a line chart or candlestick chart, it can be
examined.
Technical analysts use price movement on charts to time the entry and exit points of
trades and seek patterns or signs that can assist in predicting how security will
behave in the future. Moving averages and oscillators are examples of technical tools
that use price action to project the future and provide information to traders.
All technical analysis tools, such as charts, trend lines, price bands, high and low
swings, technical levels (of support, resistance, and consolidation), etc., are taken
into consideration depending on the trader's preference and the strategy's
suitability because price action trading is based on recent historical data and
previous price movements.
Simple price bars, price bands, breakouts, trendlines, or sophisticated combinations
like candlesticks, volatility, channels, etc., can all be used by traders as observation
patterns and tools.
Price Action Trading Tools
What distinguishes price action from
technical analysis indicators?
The appearance of a trend is indicated by price action indicators, which are flashes of
activity on a trading chart. Experienced traders may quickly identify these signs and
use them to make well-informed real-time market wagers.
Future price fluctuations are predicted using various methods in technical analysis.
Price action, in contrast, solely considers changes in an asset's price that occur
during the trading term you have chosen.
While price action enables traders to adopt a more conventional gut-based trading
approach by detecting price movement indications and acting on them, technical
analysis attempts to bring order to the seemingly chaotic world of trading.
Price Action Trading Strategies
1) Finding a scenario, such as when a stock price enters a bullish or
bearish phase, a channel range, a breakout, etc.
2) Identifying trading opportunities within the scenario can involve
determining whether a stock is likely to (a) overreach or (b) recede
once it enters a bull run. It is a wholly arbitrary decision that can
differ from trader to trader, even in the case of an identical event.
Limitations of Price Action
Price movement is frequently arbitrary, and traders may have somewhat
different interpretations of the same chart or price history, leading to varying
outcomes. Another drawback is that pricing history is not always a reliable
indicator of future results. Technical traders should therefore use a variety of
instruments to confirm indicators and be ready to promptly quit transactions
if their predictions turn out to be inaccurate.
Thank-You

Price Action Trading.pdf

  • 2.
    What does PriceAction Mean? Price action is a trading strategy where investment instruments are bought or sold for a short-term period, based solely on the movement of the instrument's price. It does not involve technical analysis like other trading techniques. The pattern or nature of how the price of a security or asset behaves, frequently in the short run, is referred to as price movement. When price activity is graphically plotted over time, frequently in the form of a line chart or candlestick chart, it can be examined. Technical analysts use price movement on charts to time the entry and exit points of trades and seek patterns or signs that can assist in predicting how security will behave in the future. Moving averages and oscillators are examples of technical tools that use price action to project the future and provide information to traders.
  • 3.
    All technical analysistools, such as charts, trend lines, price bands, high and low swings, technical levels (of support, resistance, and consolidation), etc., are taken into consideration depending on the trader's preference and the strategy's suitability because price action trading is based on recent historical data and previous price movements. Simple price bars, price bands, breakouts, trendlines, or sophisticated combinations like candlesticks, volatility, channels, etc., can all be used by traders as observation patterns and tools. Price Action Trading Tools
  • 4.
    What distinguishes priceaction from technical analysis indicators? The appearance of a trend is indicated by price action indicators, which are flashes of activity on a trading chart. Experienced traders may quickly identify these signs and use them to make well-informed real-time market wagers. Future price fluctuations are predicted using various methods in technical analysis. Price action, in contrast, solely considers changes in an asset's price that occur during the trading term you have chosen. While price action enables traders to adopt a more conventional gut-based trading approach by detecting price movement indications and acting on them, technical analysis attempts to bring order to the seemingly chaotic world of trading.
  • 5.
    Price Action TradingStrategies 1) Finding a scenario, such as when a stock price enters a bullish or bearish phase, a channel range, a breakout, etc. 2) Identifying trading opportunities within the scenario can involve determining whether a stock is likely to (a) overreach or (b) recede once it enters a bull run. It is a wholly arbitrary decision that can differ from trader to trader, even in the case of an identical event.
  • 6.
    Limitations of PriceAction Price movement is frequently arbitrary, and traders may have somewhat different interpretations of the same chart or price history, leading to varying outcomes. Another drawback is that pricing history is not always a reliable indicator of future results. Technical traders should therefore use a variety of instruments to confirm indicators and be ready to promptly quit transactions if their predictions turn out to be inaccurate.
  • 7.