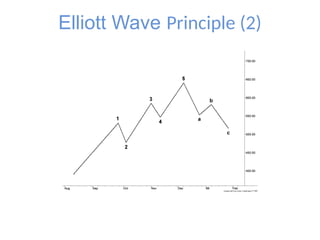
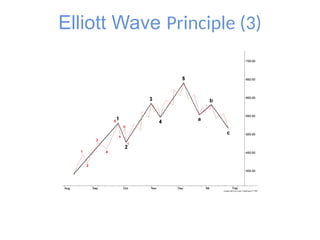
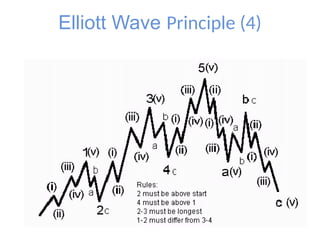
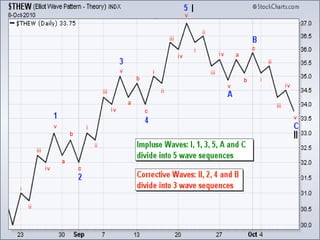
Technical Analysis
Part II
Technical analysis….few more methods 
• Market breadth analysis
• Odd lot trading
• Volume analysis
• Roc
• Elliot wave analysis
Market breadth
• Market breadth, or stock-market breadth, is used
in technical analysis to gauge the general direction of
the stock market based on all traded stock. Market breadth
divides the number of stocks that have experienced gains
by the number of stocks that have experienced losses.
• A ratio greater than one (Market Breadth > 1) indicates
overall stock market gains or a bullish sentiment. By
contrast, ratios less than one (Market Breadth < 1) indicate
overall losses or a bearish entiment.
Odd lot trading
• An odd lot is an order for anything less than 100 shares . This is the
opposite of a “round lot ," which are orders in multiples of 100 shares.
However,
• Investors, particularly individuals, are frequently unable or unwilling
to bear the expense of trading shares in even round lots . Nearly
all broker accept odd-lot trades, but some may charge a higher commission
for doing so. However, the advent of electronic and online trading platforms
has reduced, and in some cases eliminated, these odd-lot premiums.
• WHY IT MATTERS:
• Odd-lot orders tend to be placed by small personal investors rather than
institutional traders. Thus, the ratio of odd-lot buying to odd-lot selling is
often used to evaluate small-investor sentiment. The controversial odd lot
theory states that odd-lot traders are poor market timers and that profits
can therefore be made by trading contrary to odd-lot trading patterns.
Volume analysis
• Volume records the number of transactions taking place during a
period of time. It is a direct measure of liquidity in a market. The
major exchanges report volume figures on a daily basis, both for
individual securities and for the total amount of trades executed
on the exchange.
• For example, let's assume a buyer of stock purchases
500 shares from a seller. The volume then increases by 500
shares for that period of time.
• Volume also reflects pricing momentum. When market activity --
i.e., volume -- is low, investors anticipate slower moving (or
declining) prices. When market activity goes up, pricing typically
moves in the same direction.
ROC
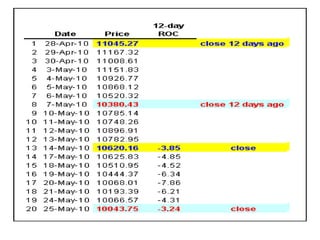
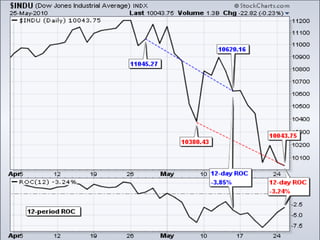
• The Rate-of-Change (ROC) indicator, which is also referred to as simply
Momentum, is a pure oscillator that measures the percent change in price from
one period to the next. The ROC calculation compares the current price with the
price "n" periods ago. The plot forms an oscillator that fluctuates above and
below the zero line as the Rate-of-Change moves from positive to negative. As a
momentum oscillator, ROC signals include centerline crossovers, divergences and
overbought-oversold readings. Divergences fail to foreshadow reversals
more often than not so this article will forgo a discussion on divergences. Even
though centerline crossovers are prone to whipsaw, especially short-term, these
crossovers can be used to identify the overall trend. Identifying overbought or
oversold extremes comes natural to the Rate-of-Change oscillator.
• Calculation
• ROC = [(Close - Close n periods ago) / (Close n periods ago)] * 100
Elliot Wave Principle (1)
 R.N. Elliot formulated this idea in a series of articles in Financial
World in 1939.
 Elliot believed that the market has a rhythmic regularity that can be
used to predict future prices.
 The Elliot Wave Principle is based on a repeating 8-wave cycle, and
each cycle is made up of similar shorter-term cycles.
 5 waves in direction of main trend
 3 corrective waves
 The underlying 5-3 pattern remains constant, though the time span
of each may vary.
 This theory asserts that crowd behavior ebbs and flows in clear
trends. Based on this ebb and flow, Elliott identified a certain
structure to price movements in the financial markets.
Elliott Wave Theory gets much more complicated than this 5-3
combination….
The upper case Roman numerals represent the large degree waves, the simple
numbers represent the medium degree waves and the small-case Roman numerals
represent the small degree waves. The trends start with the largest degree (Grand
Super cycle) and work their way down to waves of lesser degree. For example, the
Cycle wave is one larger degree than the Primary wave. Conversely, the
Primary wave is one lesser degree than the Cycle wave. Wave 1 of (1) would indicate
that Wave 1 is part of a larger degree Wave (1). Wave 1 is a lesser degree
than Wave(1).
.
Elliott Wave Principle (2)
Elliott Wave Principle (3)
Elliott Wave Principle (4)
Stock Market technical analysis part 2.pptx

Stock Market technical analysis part 2.pptx

  • 1.
  • 2.
    Technical analysis….few moremethods  • Market breadth analysis • Odd lot trading • Volume analysis • Roc • Elliot wave analysis
  • 3.
    Market breadth • Marketbreadth, or stock-market breadth, is used in technical analysis to gauge the general direction of the stock market based on all traded stock. Market breadth divides the number of stocks that have experienced gains by the number of stocks that have experienced losses. • A ratio greater than one (Market Breadth > 1) indicates overall stock market gains or a bullish sentiment. By contrast, ratios less than one (Market Breadth < 1) indicate overall losses or a bearish entiment.
  • 4.
    Odd lot trading •An odd lot is an order for anything less than 100 shares . This is the opposite of a “round lot ," which are orders in multiples of 100 shares. However, • Investors, particularly individuals, are frequently unable or unwilling to bear the expense of trading shares in even round lots . Nearly all broker accept odd-lot trades, but some may charge a higher commission for doing so. However, the advent of electronic and online trading platforms has reduced, and in some cases eliminated, these odd-lot premiums. • WHY IT MATTERS: • Odd-lot orders tend to be placed by small personal investors rather than institutional traders. Thus, the ratio of odd-lot buying to odd-lot selling is often used to evaluate small-investor sentiment. The controversial odd lot theory states that odd-lot traders are poor market timers and that profits can therefore be made by trading contrary to odd-lot trading patterns.
  • 5.
    Volume analysis • Volumerecords the number of transactions taking place during a period of time. It is a direct measure of liquidity in a market. The major exchanges report volume figures on a daily basis, both for individual securities and for the total amount of trades executed on the exchange. • For example, let's assume a buyer of stock purchases 500 shares from a seller. The volume then increases by 500 shares for that period of time. • Volume also reflects pricing momentum. When market activity -- i.e., volume -- is low, investors anticipate slower moving (or declining) prices. When market activity goes up, pricing typically moves in the same direction.
  • 6.
    ROC • The Rate-of-Change(ROC) indicator, which is also referred to as simply Momentum, is a pure oscillator that measures the percent change in price from one period to the next. The ROC calculation compares the current price with the price "n" periods ago. The plot forms an oscillator that fluctuates above and below the zero line as the Rate-of-Change moves from positive to negative. As a momentum oscillator, ROC signals include centerline crossovers, divergences and overbought-oversold readings. Divergences fail to foreshadow reversals more often than not so this article will forgo a discussion on divergences. Even though centerline crossovers are prone to whipsaw, especially short-term, these crossovers can be used to identify the overall trend. Identifying overbought or oversold extremes comes natural to the Rate-of-Change oscillator. • Calculation • ROC = [(Close - Close n periods ago) / (Close n periods ago)] * 100
  • 9.
    Elliot Wave Principle(1)  R.N. Elliot formulated this idea in a series of articles in Financial World in 1939.  Elliot believed that the market has a rhythmic regularity that can be used to predict future prices.  The Elliot Wave Principle is based on a repeating 8-wave cycle, and each cycle is made up of similar shorter-term cycles.  5 waves in direction of main trend  3 corrective waves  The underlying 5-3 pattern remains constant, though the time span of each may vary.  This theory asserts that crowd behavior ebbs and flows in clear trends. Based on this ebb and flow, Elliott identified a certain structure to price movements in the financial markets. Elliott Wave Theory gets much more complicated than this 5-3 combination….
  • 10.
    The upper caseRoman numerals represent the large degree waves, the simple numbers represent the medium degree waves and the small-case Roman numerals represent the small degree waves. The trends start with the largest degree (Grand Super cycle) and work their way down to waves of lesser degree. For example, the Cycle wave is one larger degree than the Primary wave. Conversely, the Primary wave is one lesser degree than the Cycle wave. Wave 1 of (1) would indicate that Wave 1 is part of a larger degree Wave (1). Wave 1 is a lesser degree than Wave(1). .
  • 11.
  • 12.
  • 13.