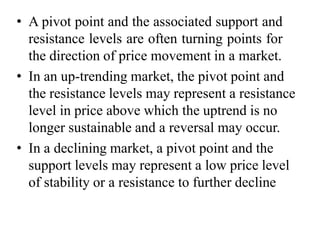
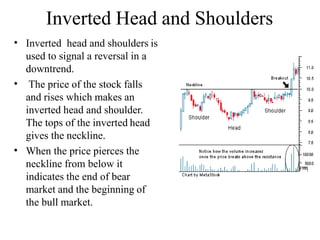
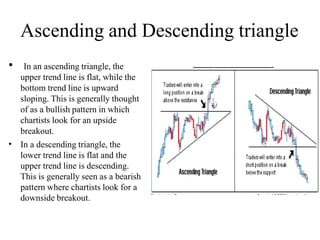
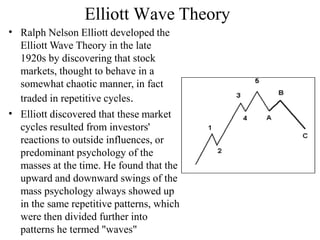
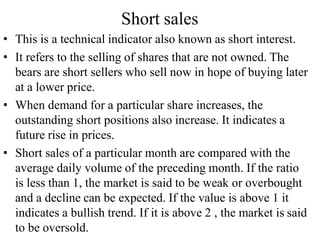
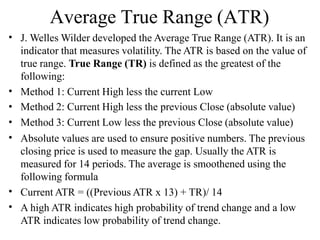
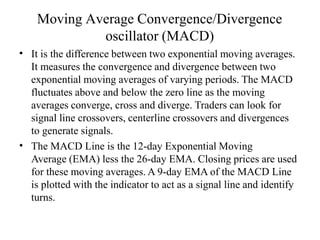
- Technical analysis uses indicators like trends, chart patterns, and support/resistance levels to identify trading opportunities. It studies how market forces like supply and demand interact with price.
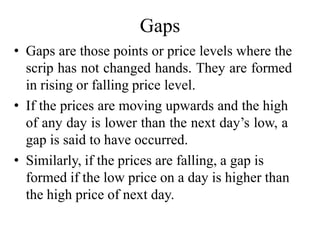
- Key concepts include identifying primary, secondary, and minor trends in prices; recognizing common chart patterns like head and shoulders, double tops/bottoms; and determining pivot points, gaps, and support/resistance levels.
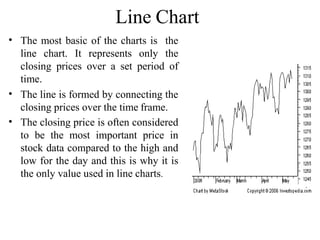
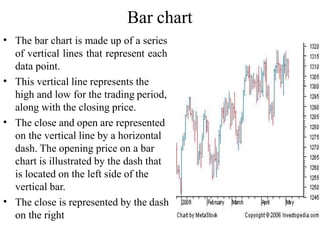
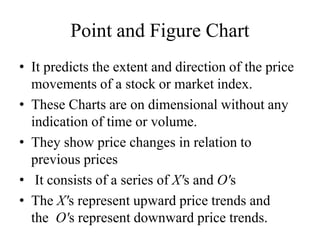
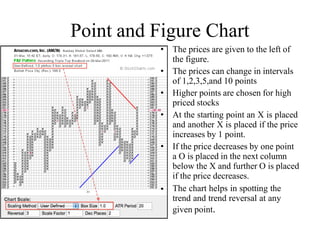
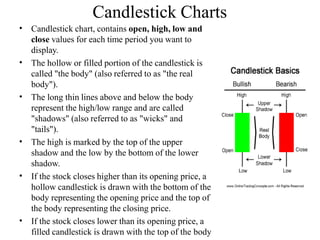
- Charts like line charts, bar charts, and point and figure charts are used to visualize price movements over time and identify trends and trading signals. Technical analysis assumes past price movement predicts future prices.

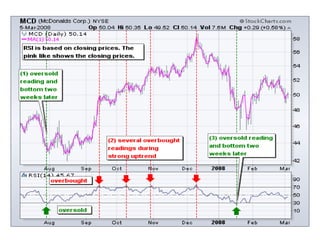
![Relative Strength Index (RSI)
•
•
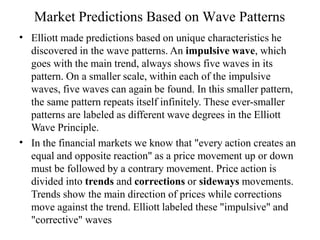
RSI was developed by Wells Wilder.
It identifies the inherent technical strength and weakness of a
particular scrip or market. RSI can be calculated for a scrip by
adopting the following formula. RSI can be calculated for 5,7,9 and
14 days.
RSI = 100 – [100 / (1 + RS)]
Rs =
Average gain per day
Average loss per day
• If RSI crosses 70 there may be down turn. If RSI falls below
30, there may be an uptrend.
• If the share price is falling and RSI is rising, a divergence is said
to have occurred. Divergence indicates the turning point of the
market.
• If RSI is rising in overbought zone, it indicates a fall in prices.
• If RSI is in oversold zone, it indicates a rise in prices.](https://image.slidesharecdn.com/technicalanalysis-210315010121/85/Technical-analysis-65-320.jpg)