Downloaded 11 times
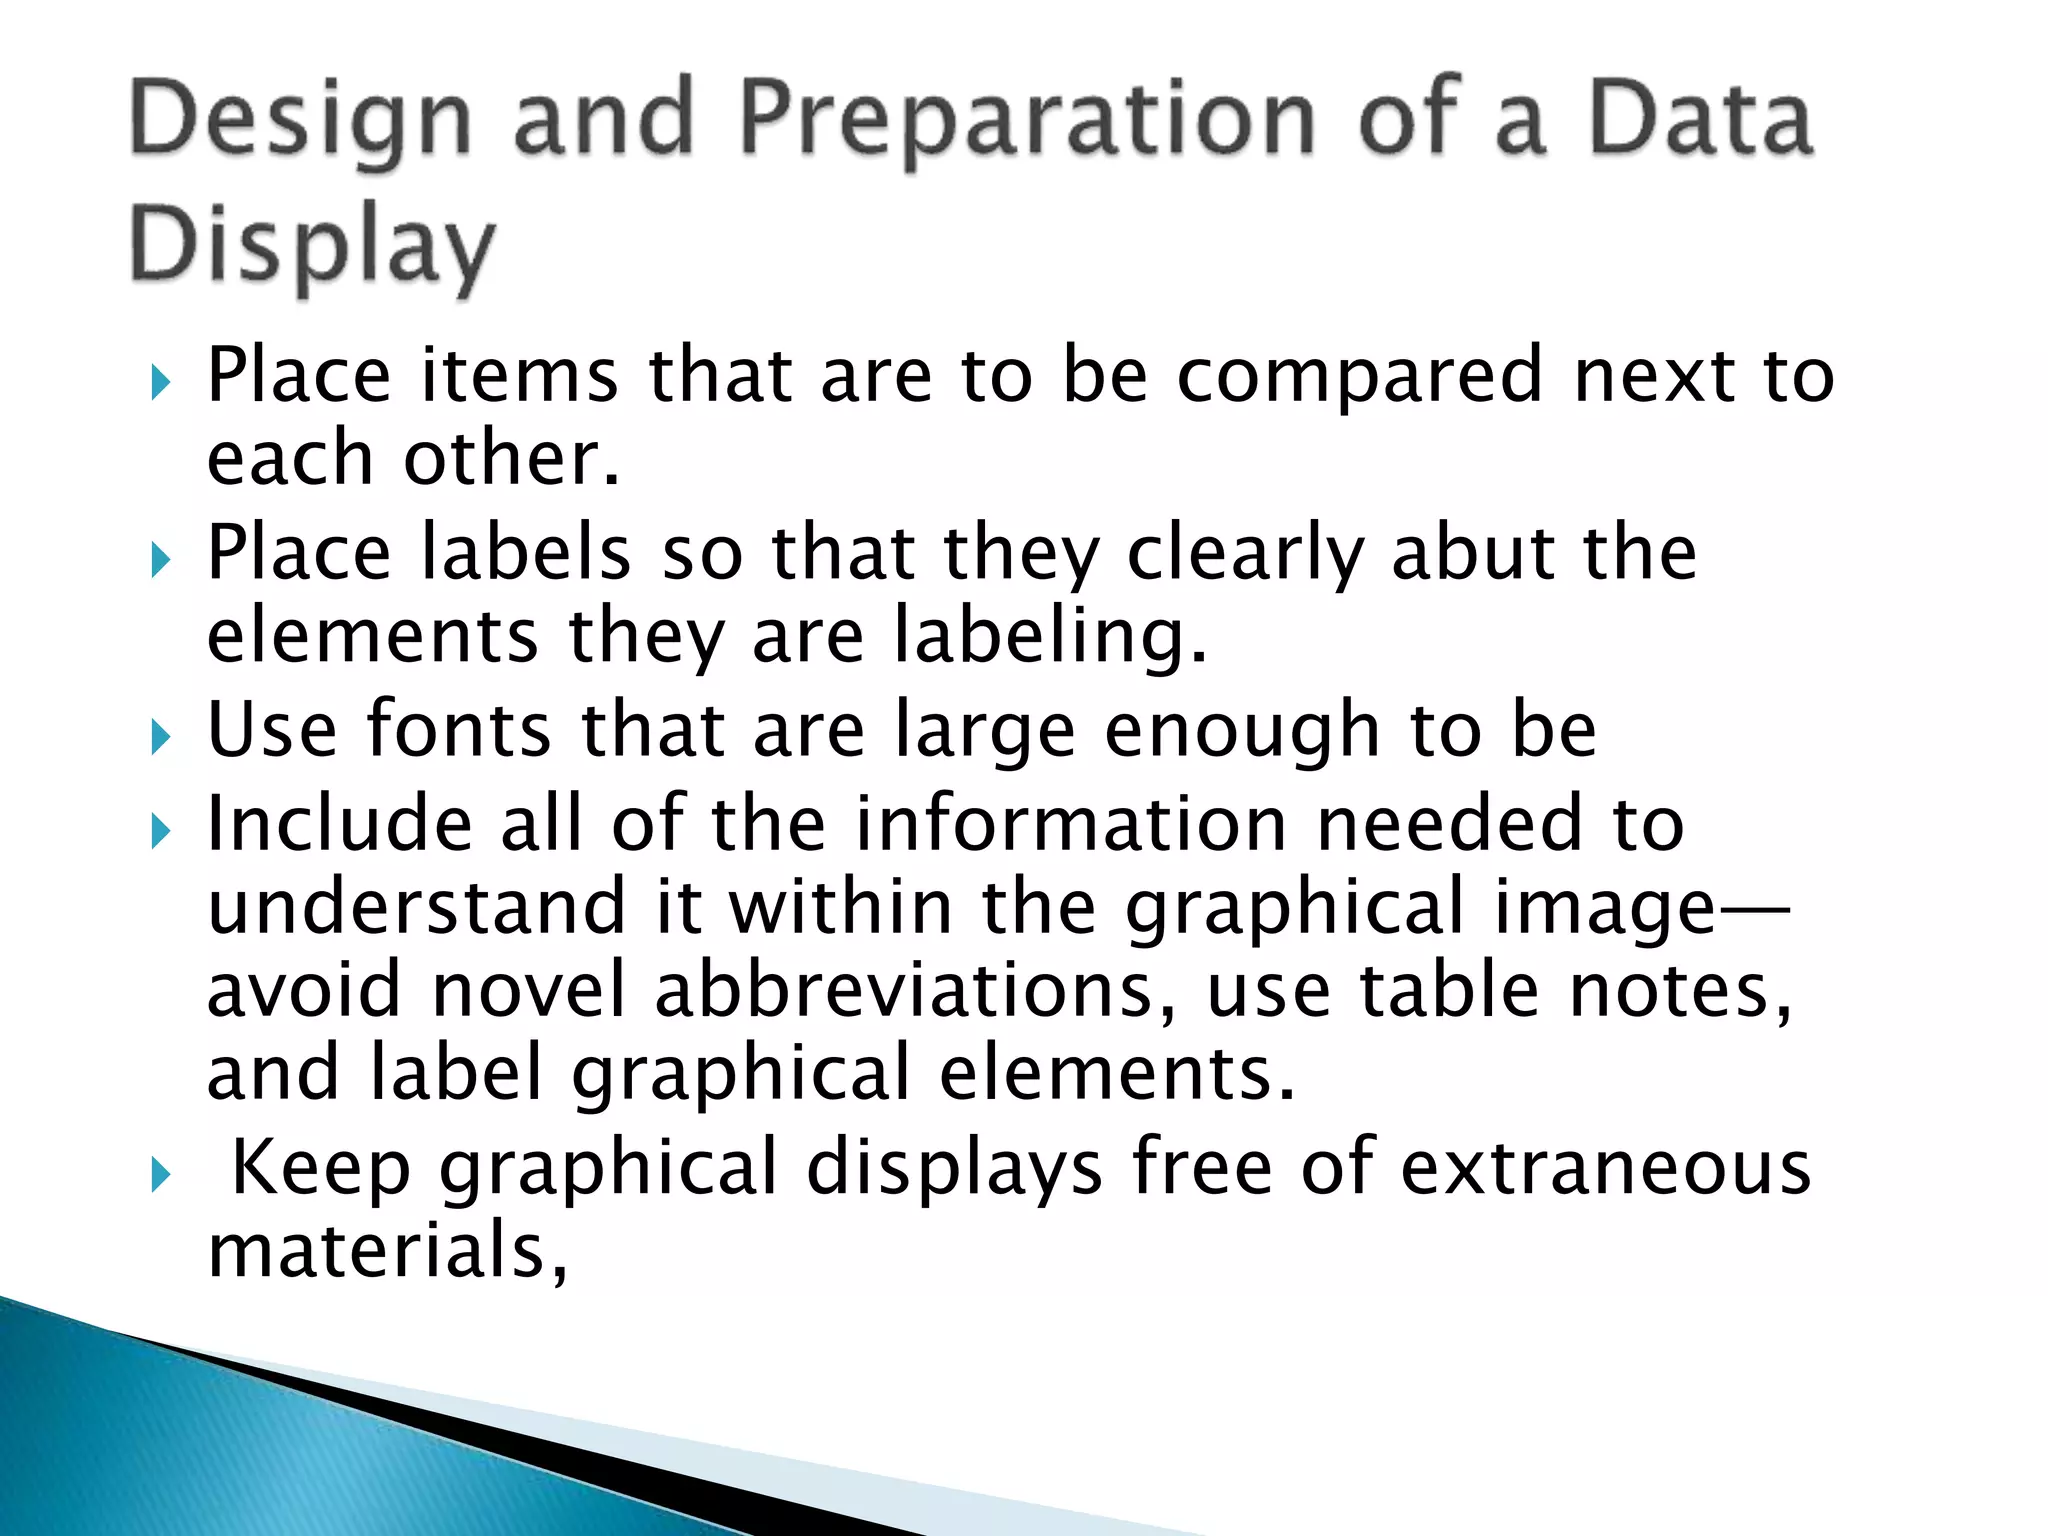

The document provides guidance on effectively presenting data through tables and figures in manuscripts. It discusses best practices for labeling, formatting, and discussing tables and figures to ensure clarity and reproducibility. Key recommendations include placing items to be compared next to each other, using large readable fonts, avoiding abbreviations, and obtaining permission to reuse copyrighted materials. Notes should be used to provide additional context and explanations. Graphs typically show relationships between quantitative variables while charts often display subject flows.


![Improve classroom performance with modern tools [Autosaved].pptx](https://cdn.slidesharecdn.com/ss_thumbnails/improveclassroomperformancewithmoderntoolsautosaved-221128055044-8a832929-thumbnail.jpg?width=640&height=640&fit=bounds)