Download to read offline


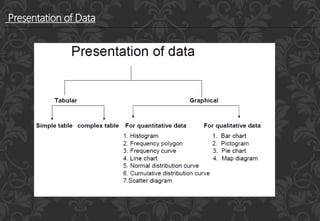
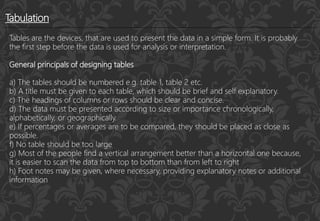
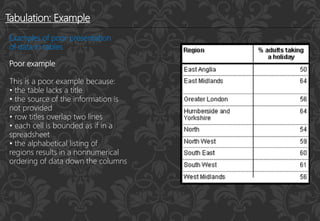
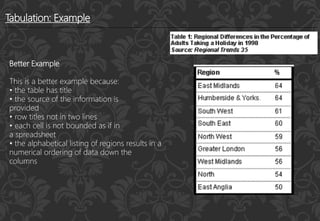
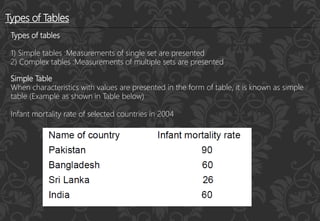
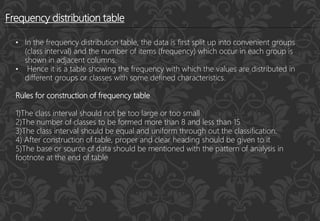
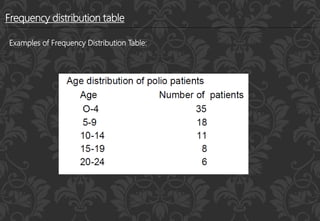
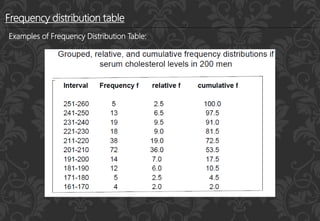


This document discusses various techniques for presenting numerical data, including incorporation into text, tables, and graphs. It describes the principles of effective data presentation, such as arranging data to create interest, presenting information compactly and concisely without losing details, and enabling further statistical analysis. Tables are presented as a common method, with examples of good and poor table design. The document outlines general principles for tables, such as numbering, titling, clear headings, and ordering data numerically or chronologically. It also differentiates between simple tables presenting a single data set and complex tables presenting multiple data sets. Frequency distribution tables are provided as a specific type of table that splits data into class intervals and shows the frequency of values within each interval.


