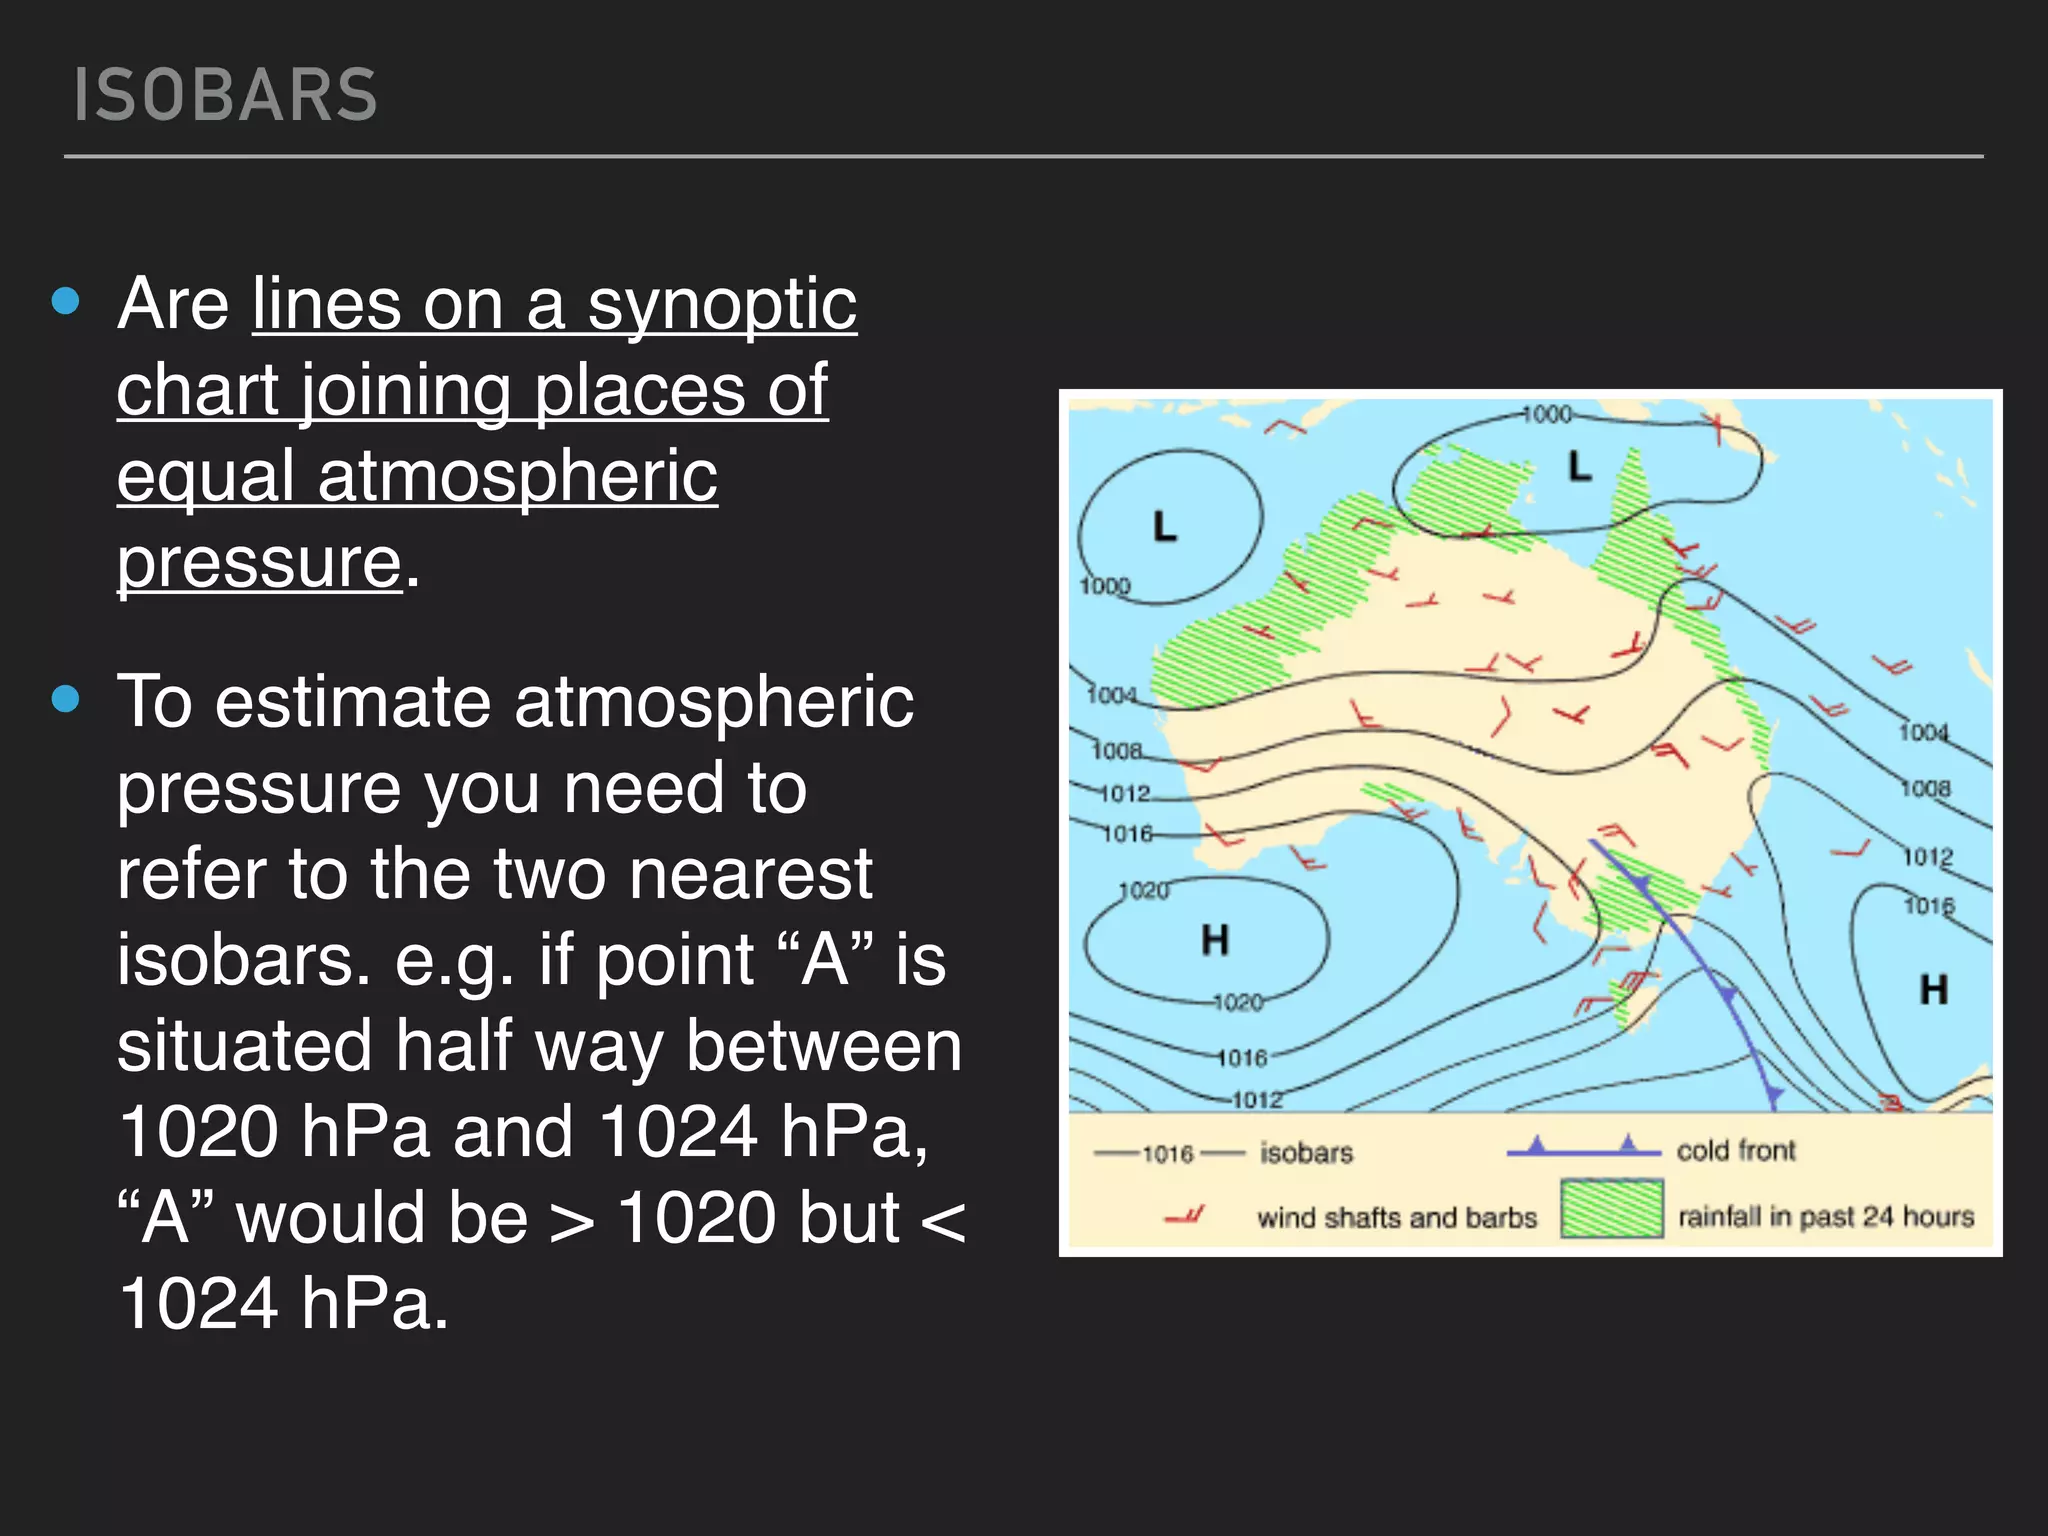
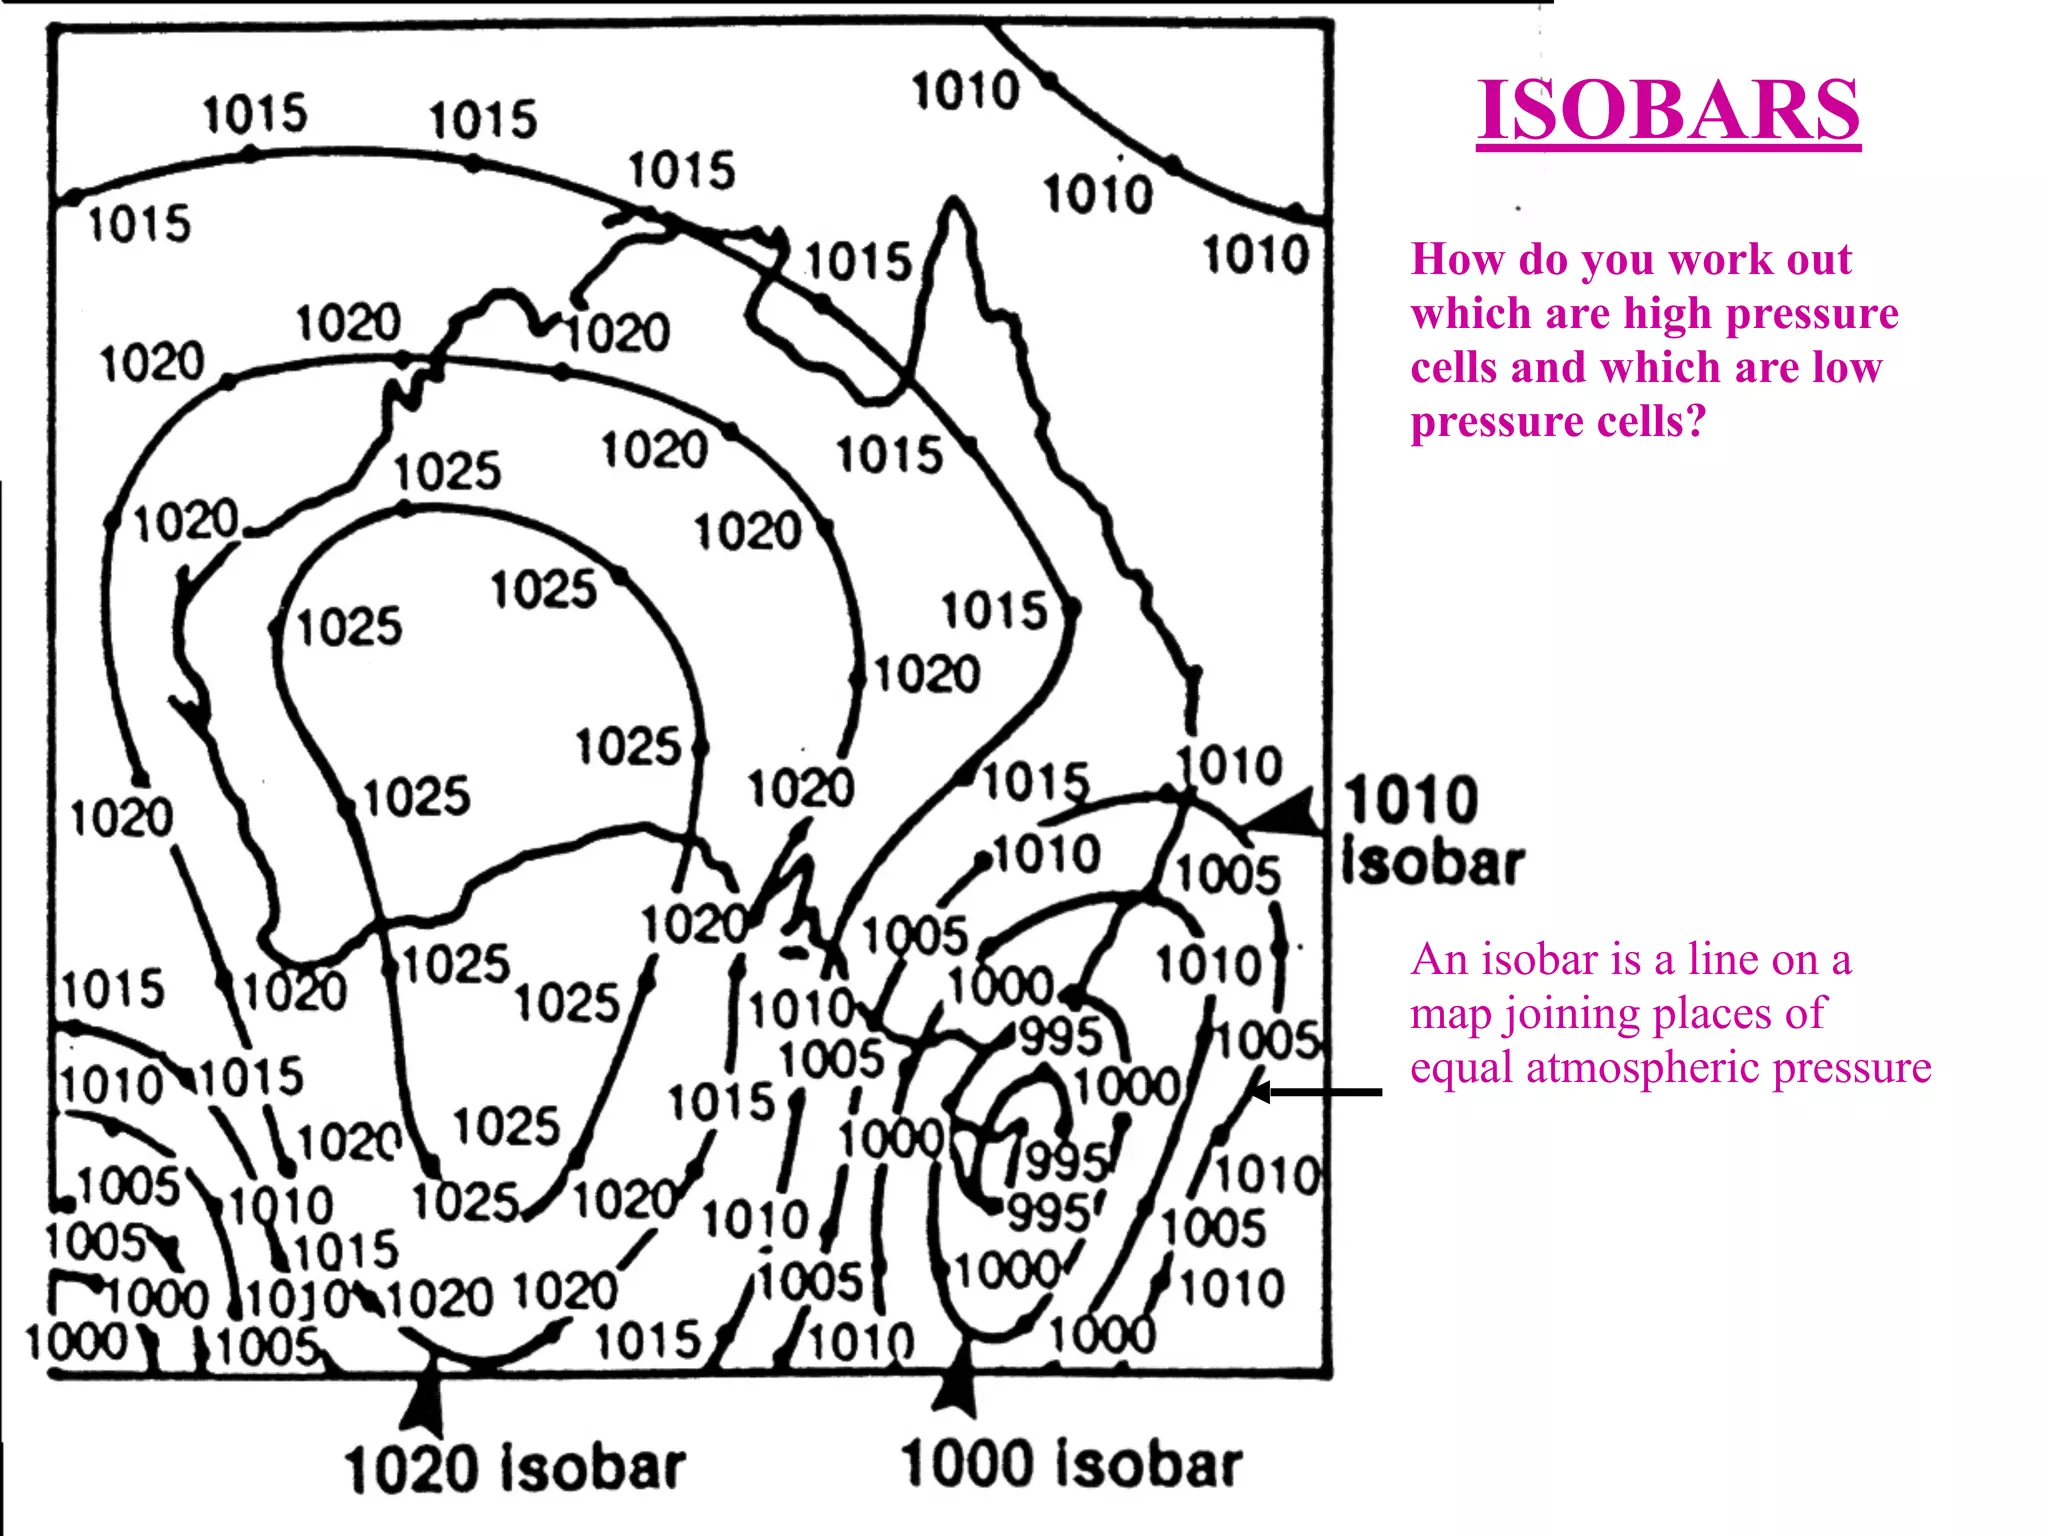
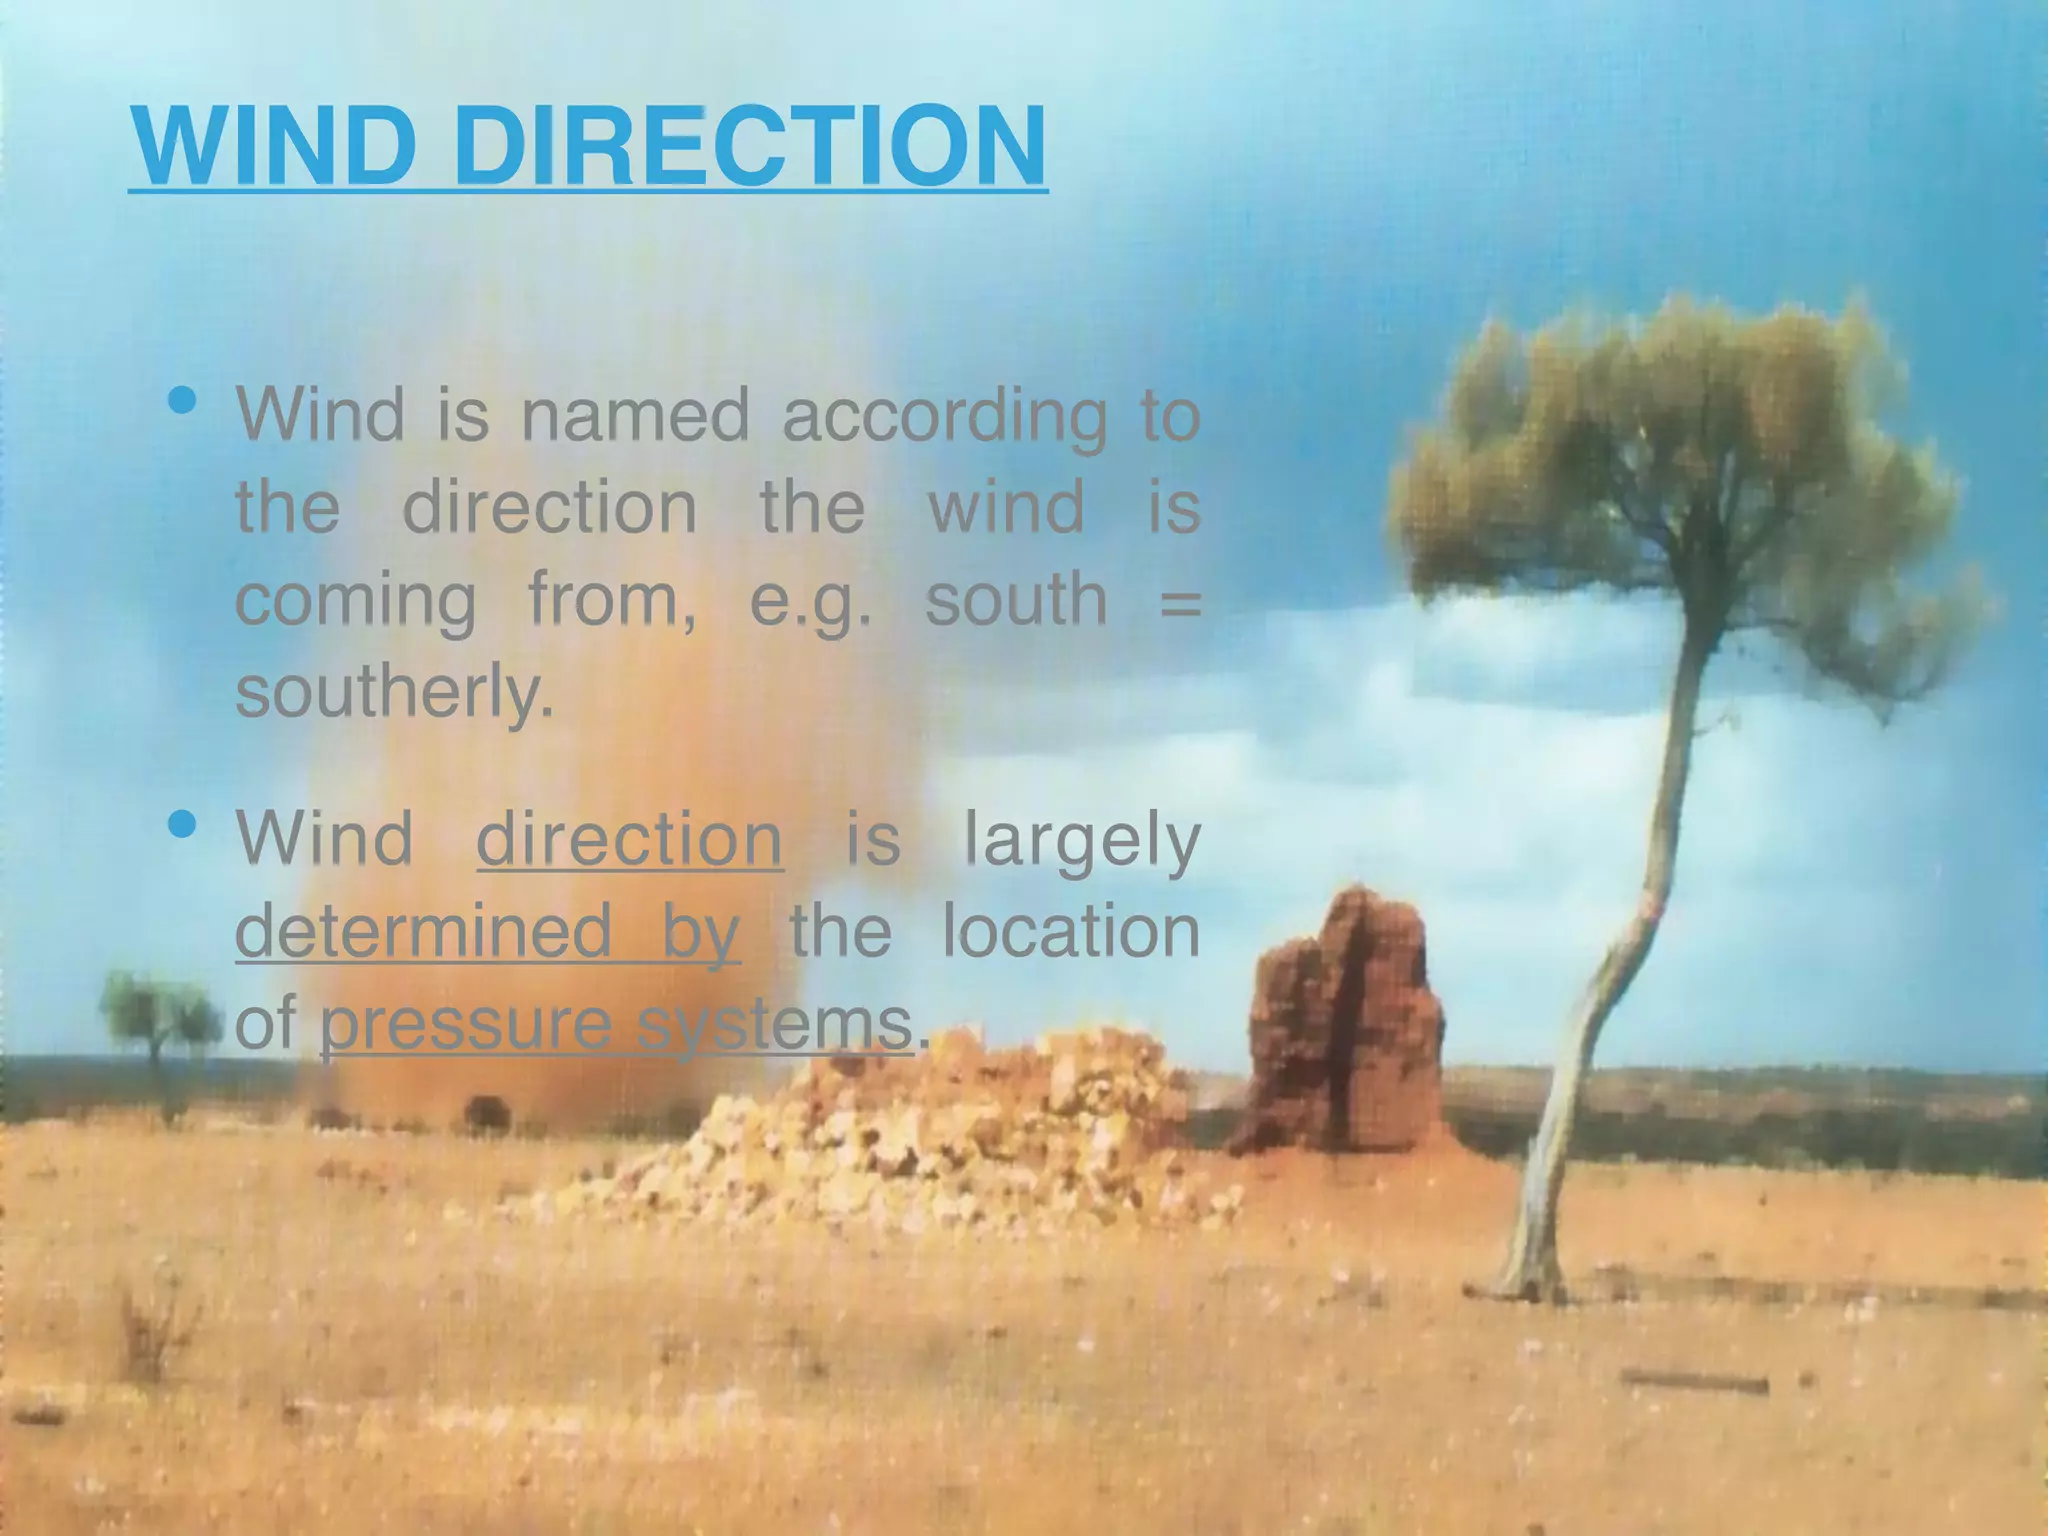
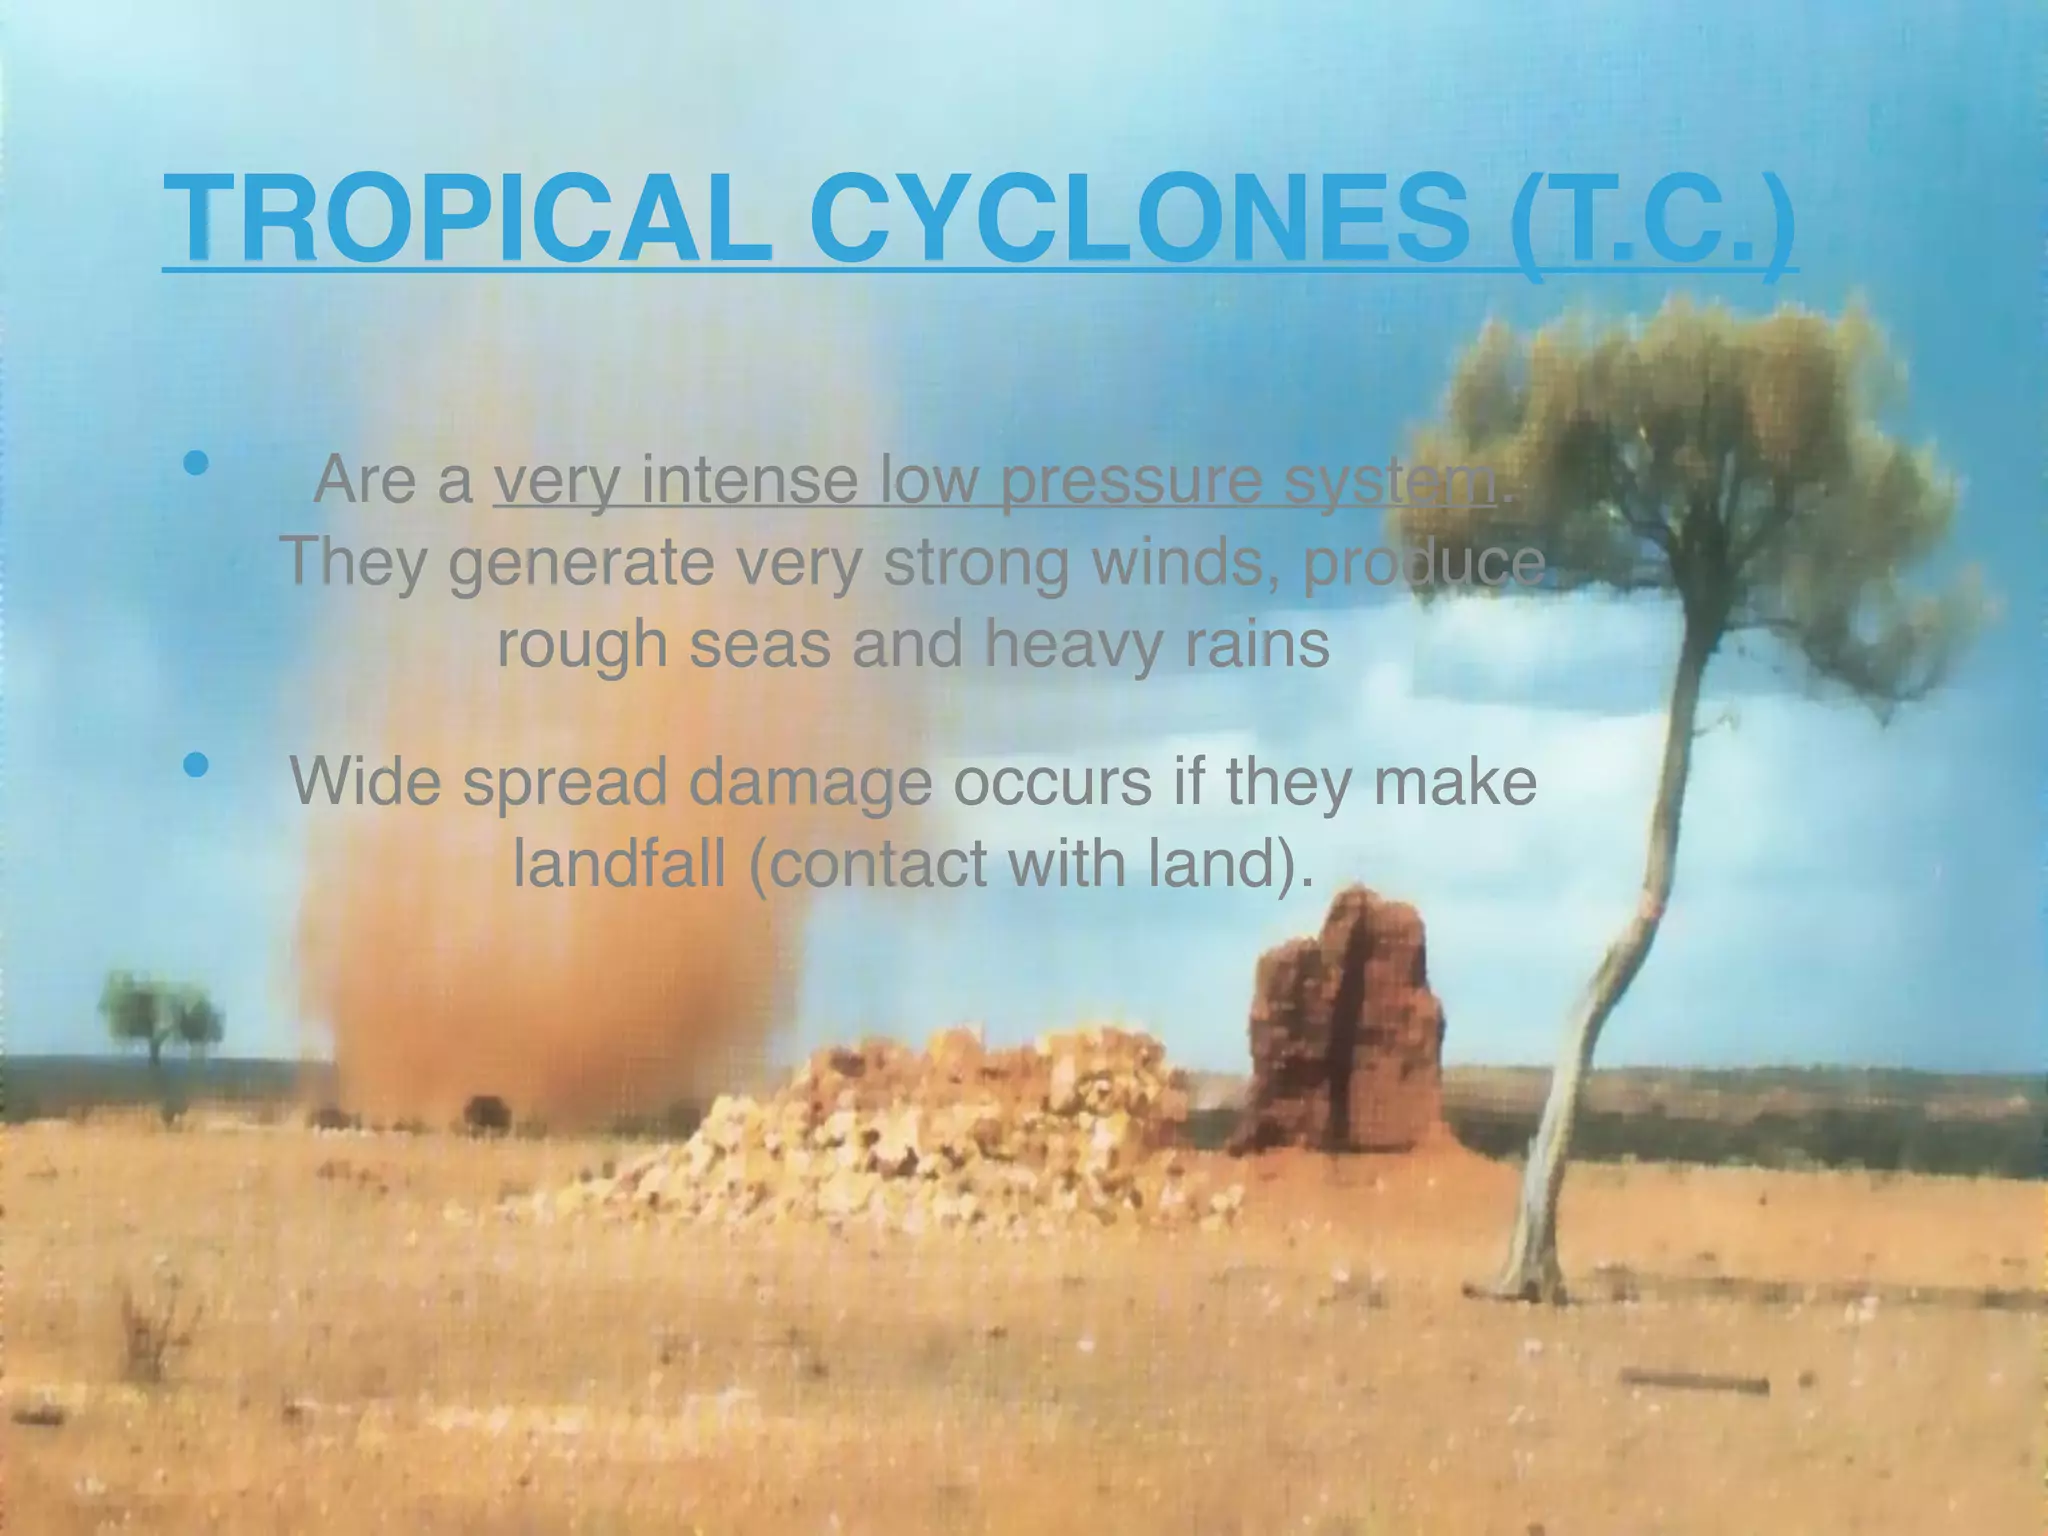
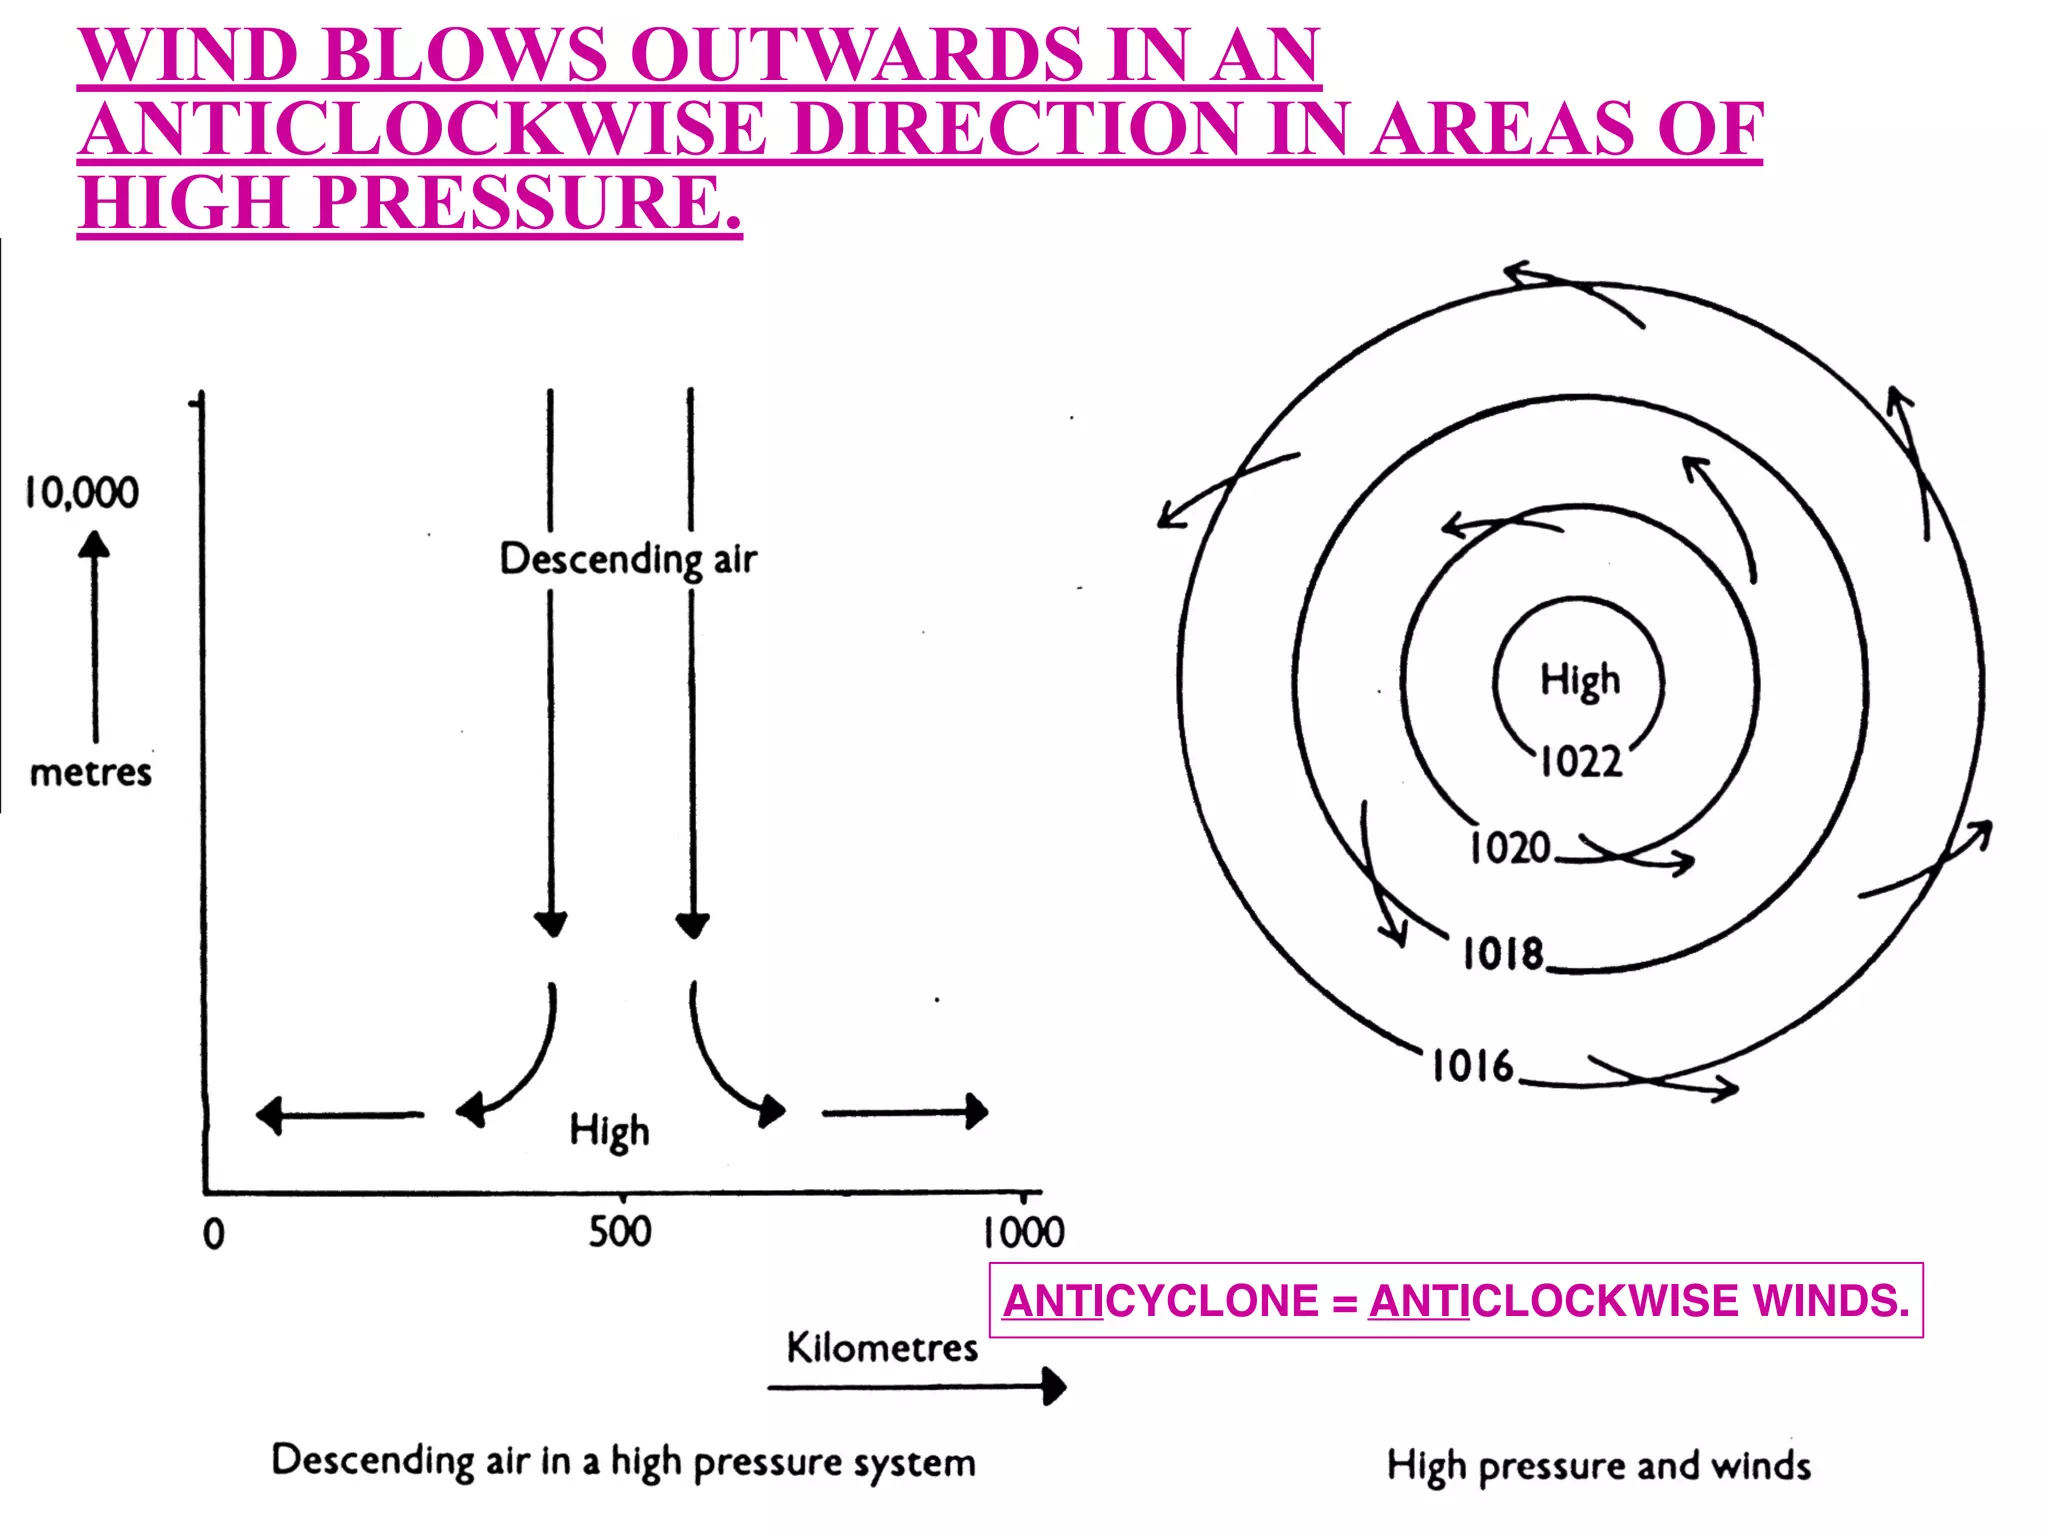
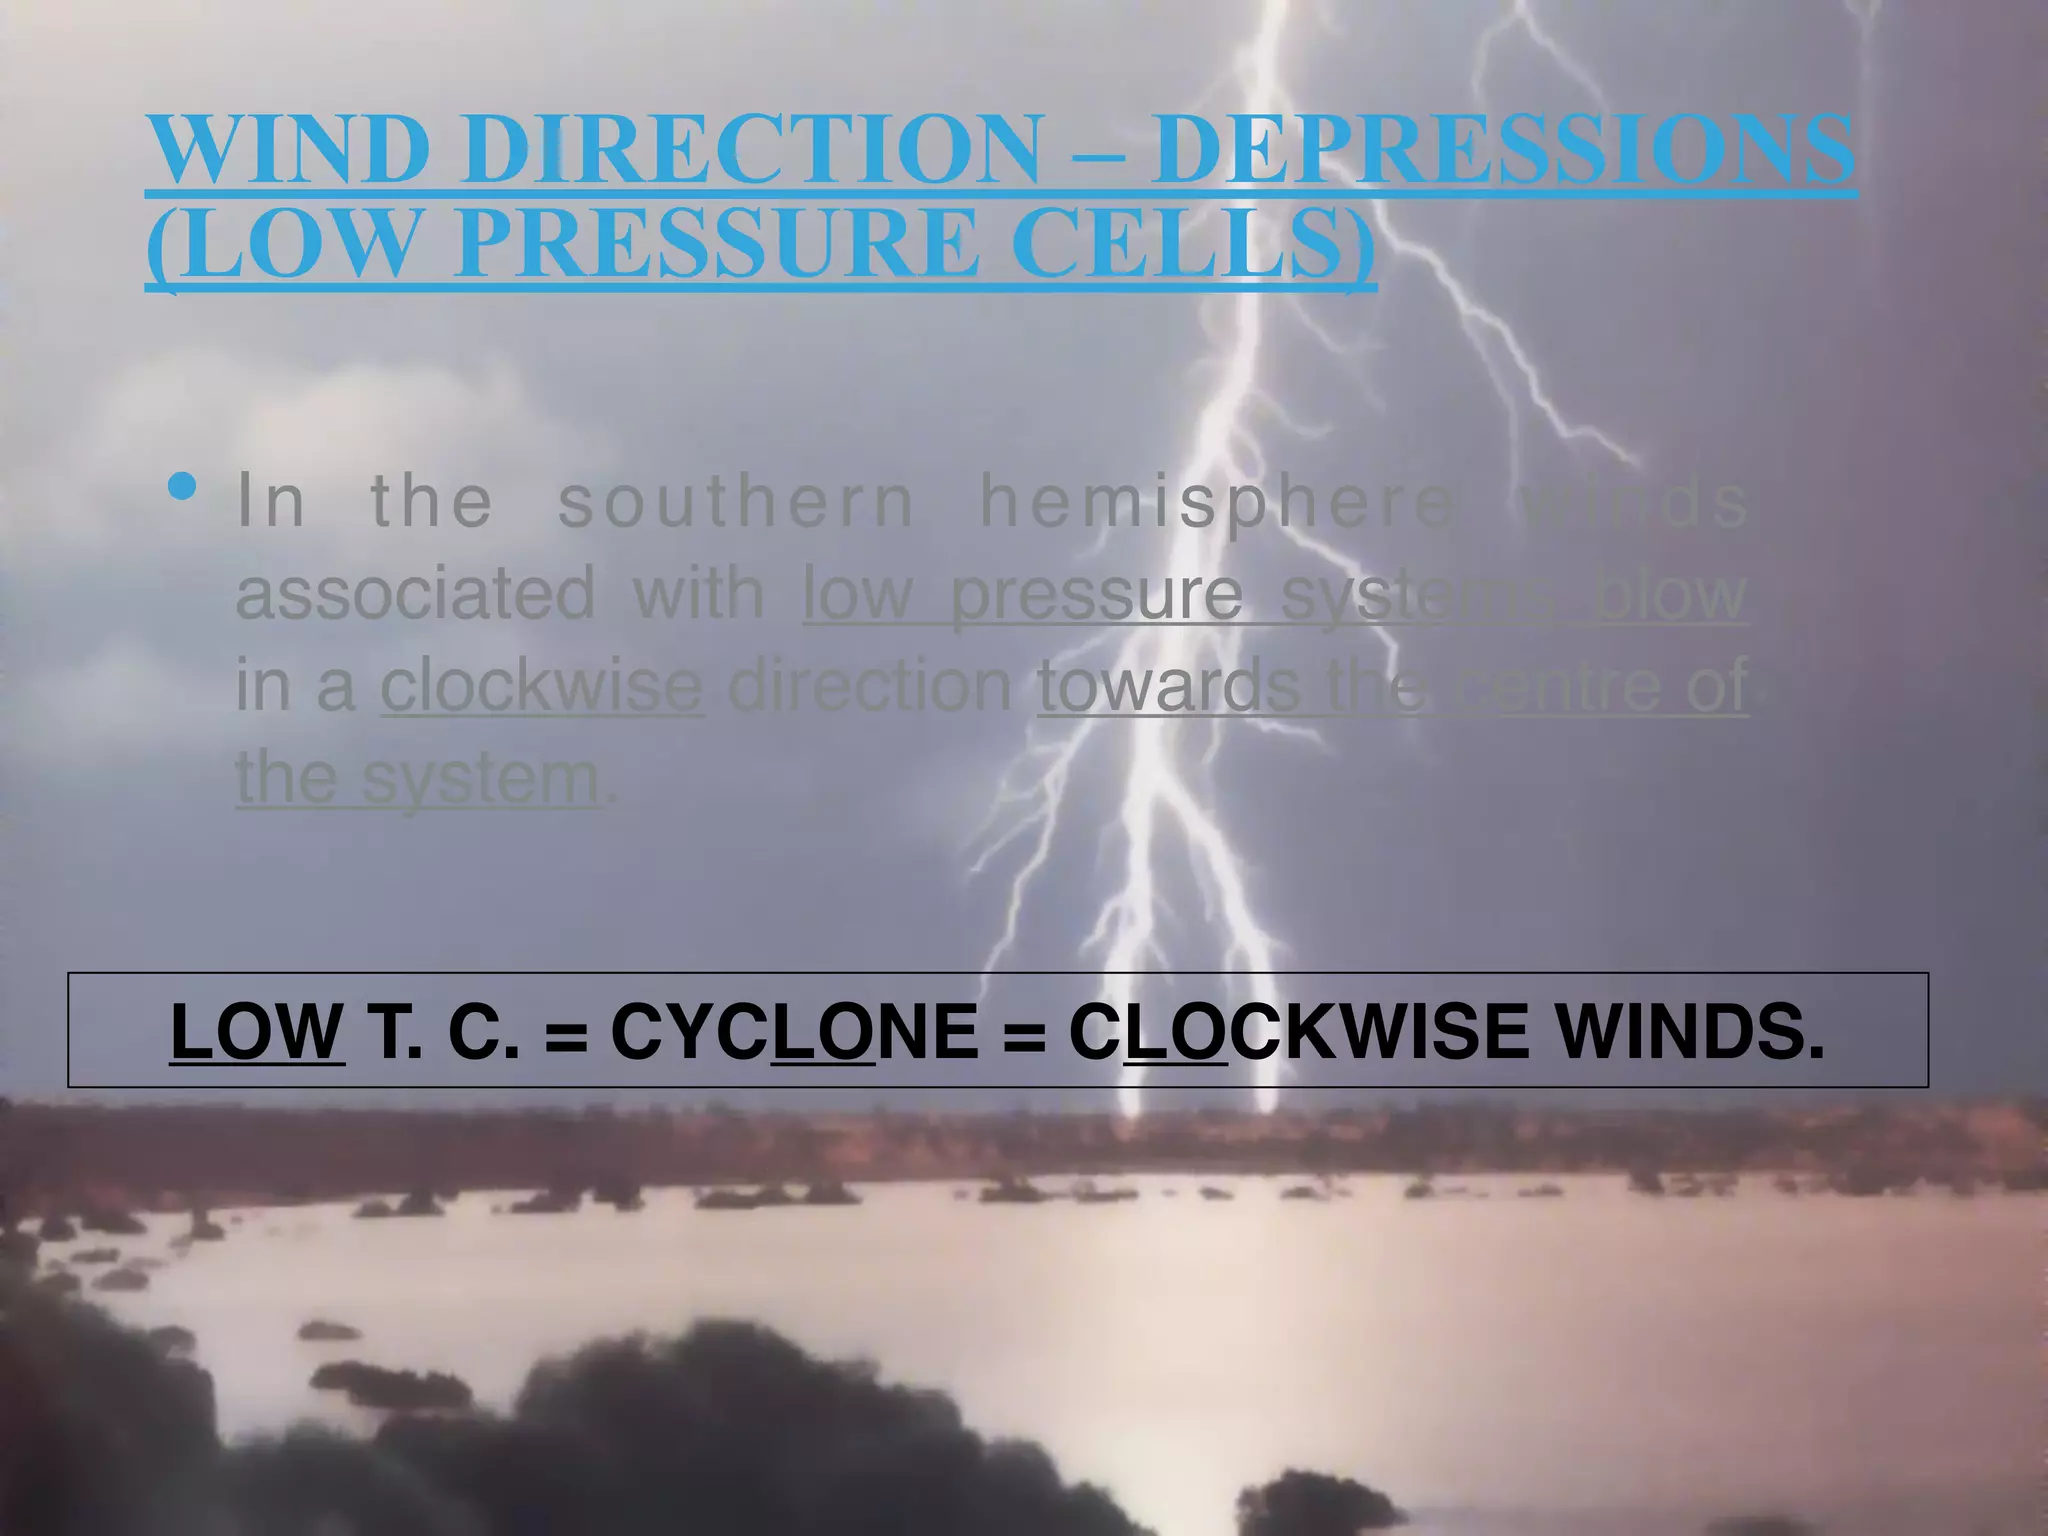
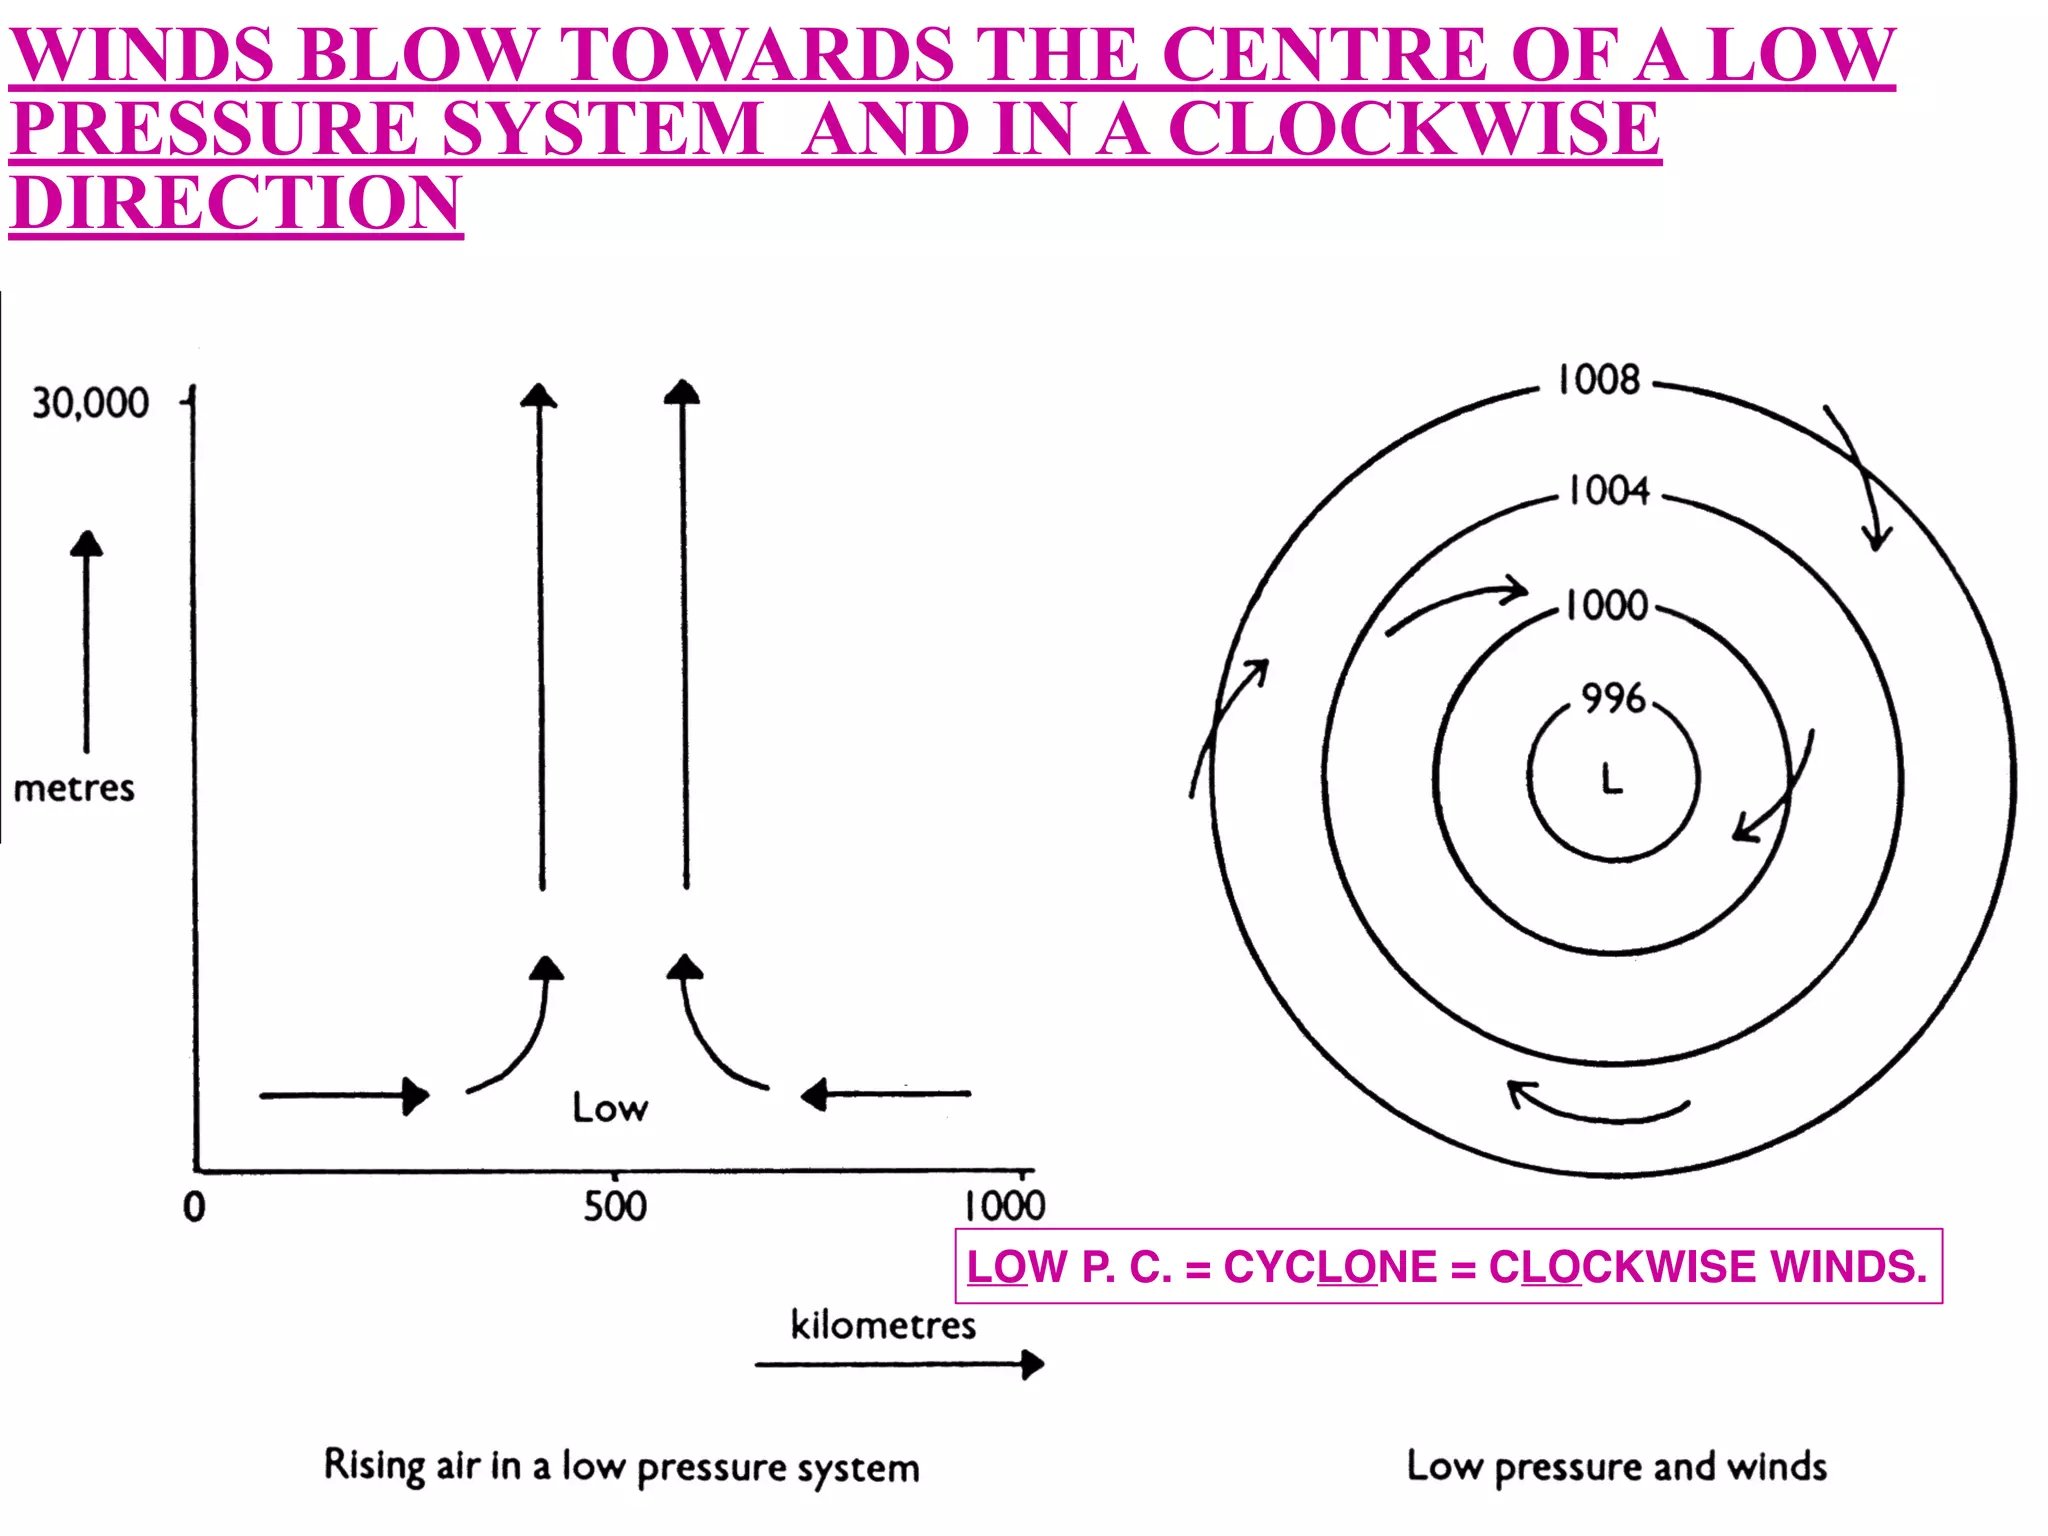
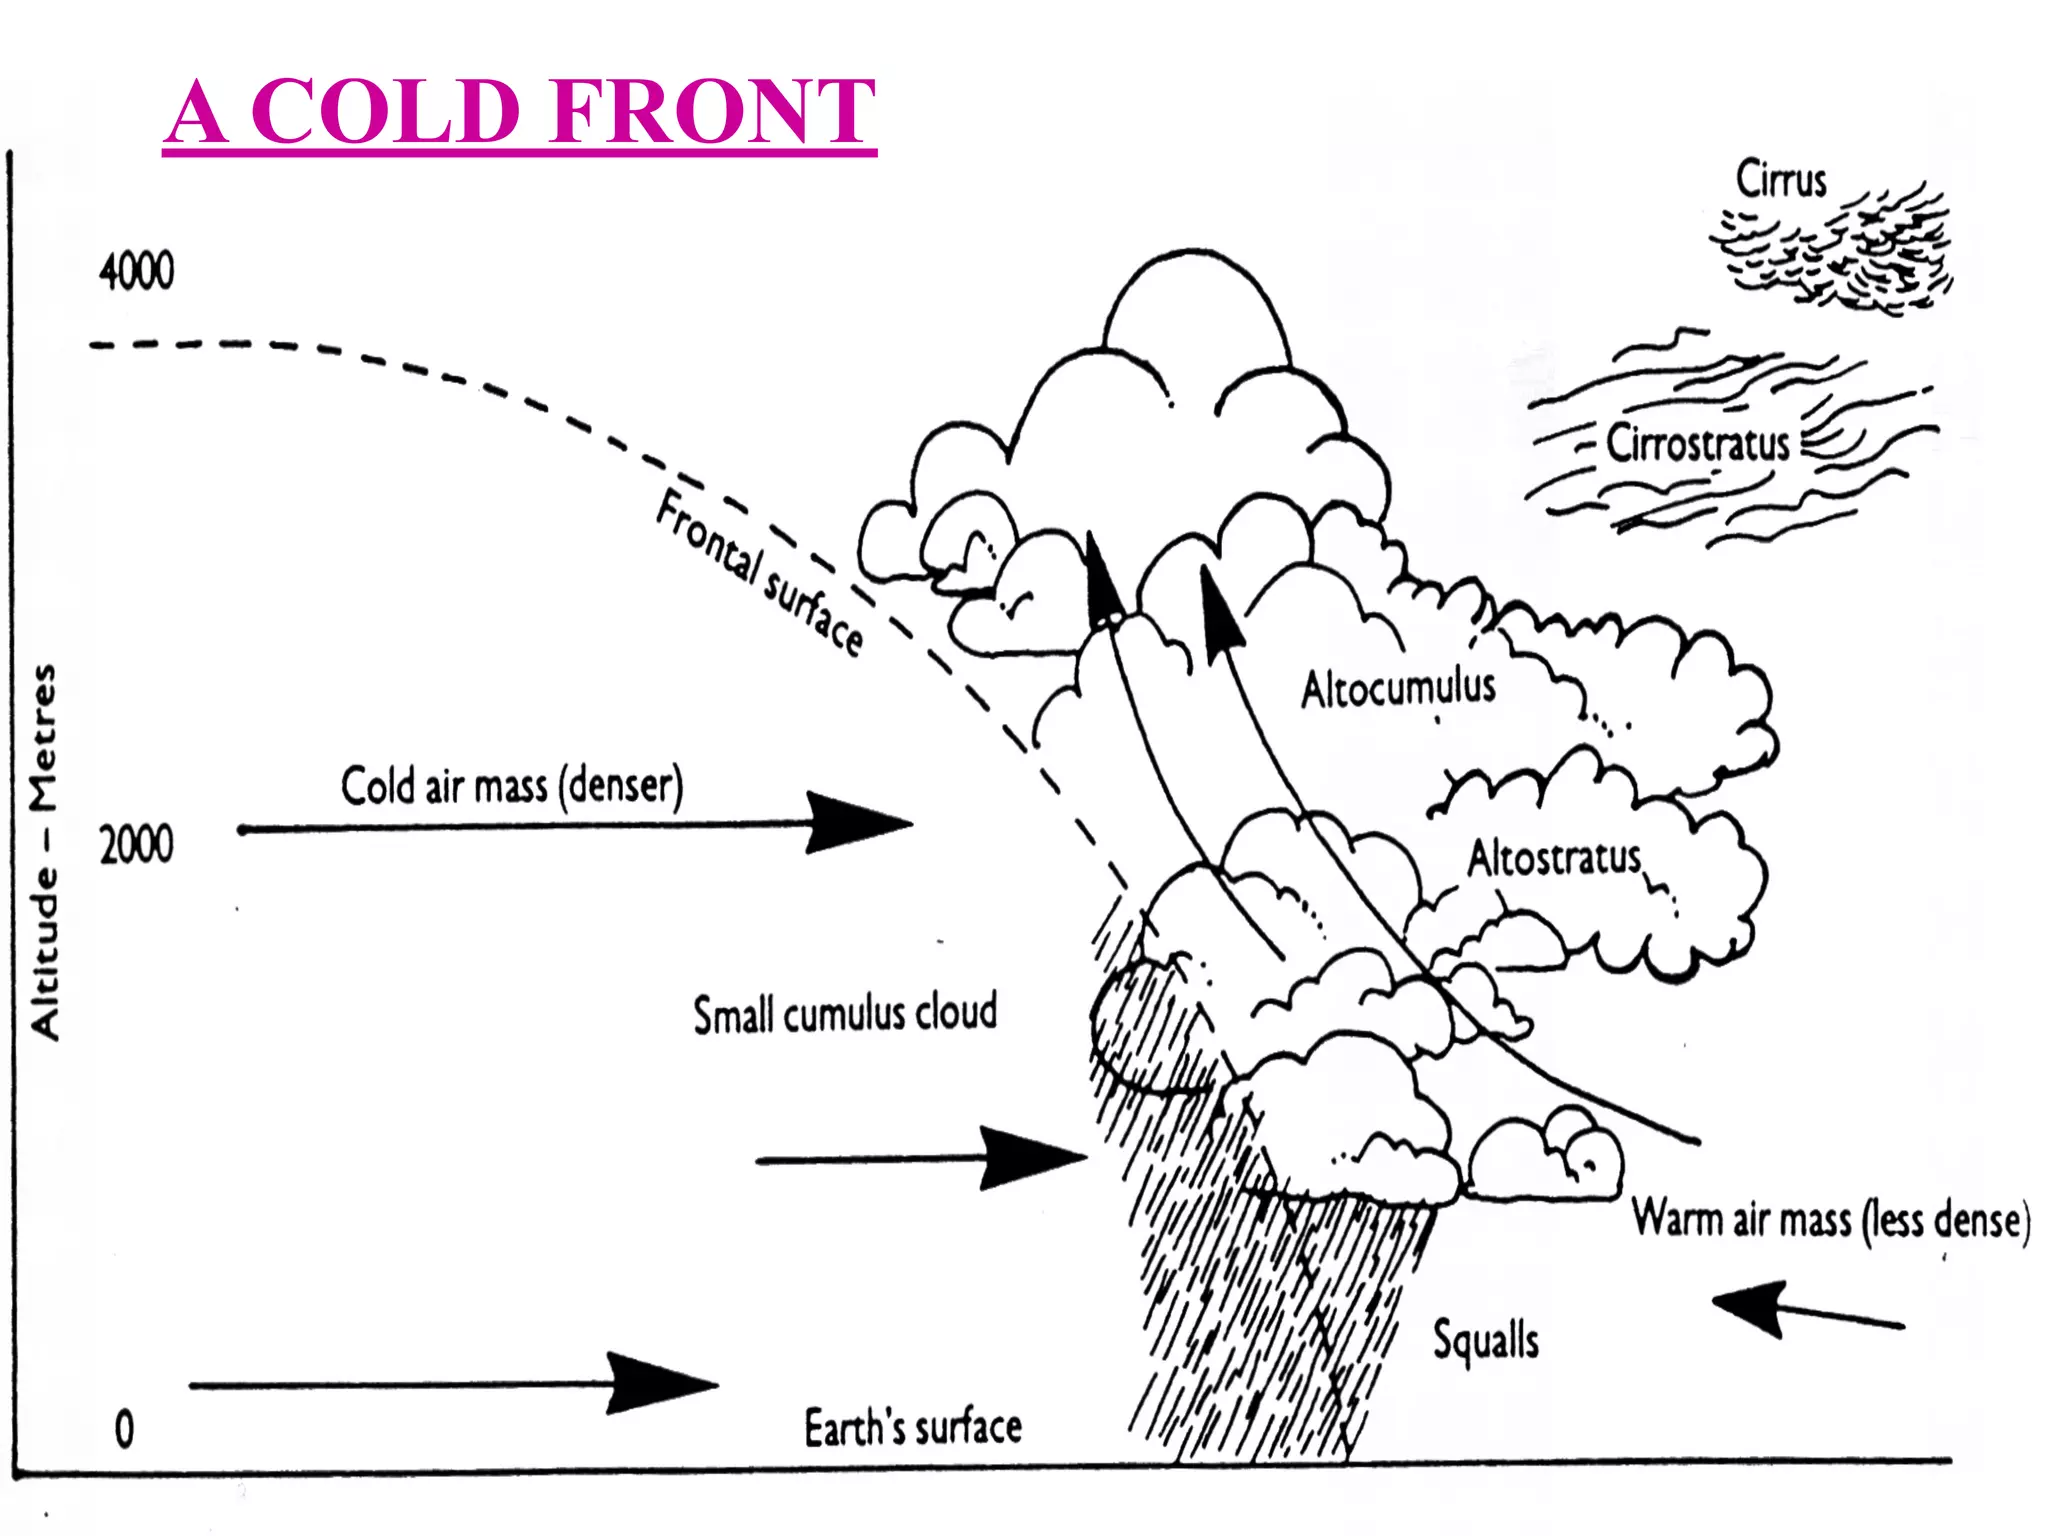
The document provides information about weather maps and weather concepts. It discusses key elements of weather maps including isobars, pressure cells, wind direction and speed. It explains that high pressure cells bring clear skies while low pressure cells bring cloud and rain. It also summarizes different types of rainfall including convectional, orographic and frontal rainfall. Seasons are determined by the positioning of pressure systems with lows over northern Australia in summer and highs in winter.
deals with temperature, density, pressure, winds and humidity parameters of the atmosphere; Prssure gradient force, coriolis force, gravity force and friction force and winds and currents, ; pressure lows and highs, atmospheric circulation, winds.
This presentation have all what you need to present about Monsoon winds, even it's types.
If you want to learn geophysics/geology
visit my blog
http://geophysicsdiary.blogspot.com/
TEMPERATURE
COMPOSITION OF THE ATMOSPHERE
Layers of the ATMOSPHERE
WEATHER and CLIMATE
LATITUDINAL ZONES
ELEMENTS & CONTROLS OF WEATHER & CLIMATE
WARM MAJOR CURRENTS OF THE WORLD
Land Breeze & Sea Breeze
Weather and Climate power point.
Weather and Climate power point.Weather and Climate power point.Weather and Climate power point.
Weather and Climate power point.Weather and Climate power point.
Weather and Climate power point.
Weather and Climate power point.Weather and Climate power point.
Weather and Climate power point.
Upon the completion of this chapter, you will be able to:
Distinguish between weather and climate,
Explain the place to place distribution of temperature and rainfall in Ethiopia,
explain the time to time patterns of temperature and rainfall in Ethiopia,
Analyze climate and its implications on biophysical and socioeconomic aspects,
identify the causes, consequences and response mechanisms of climate change.
5.1 The concept of weather and climate
Both weather and climate are concepts about atmospheric conditions. The basic difference on them is duration and areal coverage.
Weather is atmospheric condition observed in a very specific area with a short term fluctuation, while
Climate is a prolonged(30-35years) atmospheric condition observed in a relatively wider geographic area.
Weather condition likely changed hour to hour, in a daily base or weakly but climate is relatively permanent.
Elements of Weather and Climate
Elements(components) of weather and climate are the following variables
Atmospheric temperature (how cold or hot is the atmosphere)
Precipitation (any kind of moisture falling from the atmosphere to the ground, mostly rainfall)
Air pressure (the weight exerted by the air)
Humidity (the level or proportion of water vapor within the atmosphere)
Sunshine (the duration and intensity of solar heat as well as light)
Wind (horizontal motion of air)
Geography Elective/Pure: Weather and climate notesDodge Lim
This is the notes and slides provided and compiled by teachers from reputable schools. Took me many months to compile this and share with you guys! By the way, the slides with a star usually mean that it will be significant so take note! Sharing with you now is this notes!!! Enjoy and love geography!!!
2024.06.01 Introducing a competency framework for languag learning materials ...Sandy Millin
http://sandymillin.wordpress.com/iateflwebinar2024
Published classroom materials form the basis of syllabuses, drive teacher professional development, and have a potentially huge influence on learners, teachers and education systems. All teachers also create their own materials, whether a few sentences on a blackboard, a highly-structured fully-realised online course, or anything in between. Despite this, the knowledge and skills needed to create effective language learning materials are rarely part of teacher training, and are mostly learnt by trial and error.
Knowledge and skills frameworks, generally called competency frameworks, for ELT teachers, trainers and managers have existed for a few years now. However, until I created one for my MA dissertation, there wasn’t one drawing together what we need to know and do to be able to effectively produce language learning materials.
This webinar will introduce you to my framework, highlighting the key competencies I identified from my research. It will also show how anybody involved in language teaching (any language, not just English!), teacher training, managing schools or developing language learning materials can benefit from using the framework.
Palestine last event orientationfvgnh .pptxRaedMohamed3
An EFL lesson about the current events in Palestine. It is intended to be for intermediate students who wish to increase their listening skills through a short lesson in power point.
Operation “Blue Star” is the only event in the history of Independent India where the state went into war with its own people. Even after about 40 years it is not clear if it was culmination of states anger over people of the region, a political game of power or start of dictatorial chapter in the democratic setup.
The people of Punjab felt alienated from main stream due to denial of their just demands during a long democratic struggle since independence. As it happen all over the word, it led to militant struggle with great loss of lives of military, police and civilian personnel. Killing of Indira Gandhi and massacre of innocent Sikhs in Delhi and other India cities was also associated with this movement.
The Art Pastor's Guide to Sabbath | Steve ThomasonSteve Thomason
What is the purpose of the Sabbath Law in the Torah. It is interesting to compare how the context of the law shifts from Exodus to Deuteronomy. Who gets to rest, and why?
Welcome to TechSoup New Member Orientation and Q&A (May 2024).pdfTechSoup
In this webinar you will learn how your organization can access TechSoup's wide variety of product discount and donation programs. From hardware to software, we'll give you a tour of the tools available to help your nonprofit with productivity, collaboration, financial management, donor tracking, security, and more.
How to Create Map Views in the Odoo 17 ERPCeline George
The map views are useful for providing a geographical representation of data. They allow users to visualize and analyze the data in a more intuitive manner.
2. WEATHER AND CLIMATE
Weather is the state of the atmosphere at any one place or
time. This includes: humidity, temperature, sunshine hours,
cloud cover, precipitation (any moisture reaching the earth’s
surface). This includes rain, sleet, snow, hail, dew and frost.
Climate is the average or long term weather
conditions of a region. It is the result of years
of research into data.
3.
4. WEATHER OR CLIMATE
Hot and dry conditions, together with strong winds, led to
Bushfires near Wagga.
At this time of year Darwin usually experiences hot and wet
weather.
The maximum temperature in Moscow today is -23oC
On Monday night a southerly change arrived about 10:30pm
Climate Weather
5. WEATHER OR CLIMATE
Tully in Queensland is Australia’s wettest town.
September was chosen for the 2000 Olympics because that month
usually has the best weather.
On New Year’s Day the temperature in
Sydney was 45oC
Sydney receives more rain per year than London
Climate Weather
6. • Synoptic charts or weather maps provide a snapshot
of the weather experienced at a particular place at a
certain time.
• They show information relating to air pressure, air
masses and fronts, cloud cover, wind speed, wind
direction and rainfall.
• This information allows us to make predictions
relating to temperature, humidity, ocean conditions
and the likely weather for the next few days.
SYNOPTIC CHARTS
7. SYNOPTIC CHARTSSynoptic Charts
What is this feature?
What does the shading
refer to?
What is the wind speed and direction?
What is the air pressure?
8. • Atmospheric pressure or barometric pressure is the
pressure exerted by the weight of the air on the
earth’s surface.
• Atmospheric pressure is measured in hectopascals
(hPa).
• Atmospheric pressure is mapped to form isobars.
• http://www.juicygeography.co.uk/
animations.htm#downloads/flash/highpressure.swf
ATMOSPHERIC PRESSURE
9.
10. ISOBARS
• Are lines on a synoptic
chart joining places of
equal atmospheric
pressure.
• To estimate atmospheric
pressure you need to
refer to the two nearest
isobars. e.g. if point “A” is
situated half way between
1020 hPa and 1024 hPa,
“A” would be > 1020 but <
1024 hPa.
11. ISOBARS
How do you work out
which are high pressure
cells and which are low
pressure cells?
An isobar is a line on a
map joining places of
equal atmospheric pressure
12. PRESSURE CELLS - ARE DEFINED BY THE PATTERNS FORMED BY ISOBARS.
•Are these high
pressure cell s
or a low pressure
cells?
•How can you tell?
13. HIGH PRESSURE SYSTEM
• occur where atmospheric pressure increases towards the
centre of the system. High pressure systems are
characterised by light winds, clear skies, dry weather and a
high diurnal (daily) temperature range.
• A ridge is an extension of high pressure from a high
pressure system.
• http://www.bom.gov.au/weather/national/charts/
synoptic.shtml
15. TYPICAL WEATHER ASSOCIATED
WITH HIGH PRESSURE
• light winds
• clear skies, dry weather
• higher diurnal (daily) temperature
range i.e. hot days (sun rays
maximum effect)
• cool nights (because of lack of cloud
cover).
• Frosts are likely in winter.
17. LOW PRESSURE CELLS (CYCLONES OR DEPRESSIONS)
• occur where atmospheric pressure decreases towards the
centre of the system.
• Low pressure systems are associated with stronger winds,
cloudy skies, rain
• a lower diurnal temperature range.
• A trough is an extension of low pressure from a low pressure
system.
19. TYPICAL WEATHER ASSOCIATED WITH LOW PRESSURE
• strong winds, cloudy skies, rain and a lower diurnal
(daily) temperature range i.e. mild temperatures (sun
does not have maximum effect because of cloud
cover, heat trapped in at night).
• Frosts are unlikely.
22. WHAT IS WIND?
• Wind is the movement of air masses
(common bodies of air) from high pressure
areas (highs) to low pressure areas (lows).
The effect of this movement of air is to
rebalance the pressure in the atmosphere.
• Note that:
• the greater the difference between the
high and the low pressure, the greater
the wind speed will be, and
• the closer together the isobars are on
the weather map, the stronger the
winds will be.
23. WIND SPEED
• is determined by the closeness of the isobars.
The closer the isobars the stronger the winds.
• A steep pressure gradient exists where isobars
are close together.
• If isobars are far apart a place will generally
experience light winds. This is called a slight
pressure gradient.
25. READING WIND DIRECTION ON A WEATHER MAP
Sydney
N
Close up of a map
Easterly √(Remember that we
name our wind direction
on where the wind came
from)
Not where its
going too
x
26. HOW TO READ WIND SPEED ON A WEATHER MAP
Legend- Wind Speed
5 km/hr
10 km/hr
20 km/hr
To work out the
wind speed of an
area, all you need
to do is match up
the wind speed
symbol found on
the map with the
symbol found in
the key
The wind speed at
point A is 5 km/hr
A
30 km/
hr
Calm
27. WIND DIRECTION
• Wind is named according to
the direction the wind is
coming from, e.g. south =
southerly.
• Wind direction is largely
determined by the location
of pressure systems.
28. WIND DIRECTION
Remember we always refer to where the wind is coming from!
Where has the wind come from?
1
2
29. WIND DIRECTION – ANTICYCLONES (HIGH PRESSURE
CELLS)
• In the southern hemisphere winds blow
outwards in an anticlockwise direction from
areas of high pressure.
ANTICYCLONE = ANTICLOCKWISE WINDS.
30. TROPICAL CYCLONES (T.C.)
• Are a very intense low pressure system.
They generate very strong winds, produce
rough seas and heavy rains
• Wide spread damage occurs if they make
landfall (contact with land).
32. WIND BLOWS OUTWARDS IN AN
ANTICLOCKWISE DIRECTION IN AREAS OF
HIGH PRESSURE.
ANTICYCLONE = ANTICLOCKWISE WINDS.
33. WIND DIRECTION – DEPRESSIONS
(LOW PRESSURE CELLS)
• In the southern hemisphere winds
associated with low pressure systems blow
in a clockwise direction towards the centre of
the system.
LOW T. C. = CYCLONE = CLOCKWISE WINDS.
34. WINDS BLOW TOWARDS THE CENTRE OF A LOW
PRESSURE SYSTEM AND IN A CLOCKWISE
DIRECTION
LOW P. C. = CYCLONE = CLOCKWISE WINDS.
35. WIND INDICATORS
• Wind indicators show wind speed and direction.
• The feather indicates wind speed
• The shaft indicates the direction from which the wind is coming
• The black dot is the place that is experiencing the windy conditions
36. IDENTIFYING WIND DIRECTION
• First - Identify the type of pressure system.
• Southern Hemisphere
LOW =clockwise
HIGH = anticlockwise.
• (the reverse is true in the northern hemisphere)
• Wind, generally speaking, moves across the isobars
37. FRONTS
• A front is the leading edge of change. They are the
border zone between warm and cold air. There are
two types of fronts:
• Warm fronts occur when warm air is pushed into a
cold air mass. These are very rare in Australia. They
result in drizzle and light rain over a few days.
39. COLD FRONTS ARE FAR MORE COMMON IN
AUSTRALIA AND OCCUR WHEN COLD AIR IS
PUSHED INTO A WARM AIR MASS. THIS FORCES
THE WARM AIR TO RISE CAUSING A NUMBER
OF CHANGES:
(A) DECREASE IN TEMPERATURE: COLD AIR
REPLACES WARM AIR.
(B) CHANGE IN WIND DIRECTION AND
SOMETIMES SPEED.
(C) BUILD UP OF CUMULONIMBUS OR RAIN
BEARING CLOUDS.
(D) INCREASE IN HUMIDITY: CORRESPONDING
TO A BUILD UP OF CLOUDS.
(E) PROBABILITY OF RAIN.
Make up an acronym to remember these changes.
42. TEMPERATURE AND HUMIDITY:
• are related to the wind. Winds pick up the
characteristics of where they form – sea or land – these
are called source regions
Remember:
• Winds off the land are generally hotter and drier.
• Winds off the sea tend to be cooler and wetter (greater
moisture = greater humidity).
43. HUMIDITY
• Humidity is the amount of water vapour in the
atmosphere
• A high humidity means there is a lot of water
vapour, and a low humidity means a little.
• The humidity level varies with temperature. The
warmer air is, the more moisture the air can hold
as vapour. The colder the air is, the less moisture
the air can hold.
• Humidity is measured as a percentage, relative
to the saturation point where the air can hold no
more water vapour (i.e. 100 percent humidity).
46. OROGRAPHIC RAINFALL
The dry air mass becomes warmer, with little
chance of rain. Deserts are often found on the
leeward side of large mountain ranges
Warm moist air
approaches a
mountain barrier
The air mass is
forced to rise as it
hits the mountain and
condenses into
clouds
Orographic
rainfall occurs on
the windward
side of the
mountains
The air mass, now
drier, flows down the
leeward side of the
mountains
48. FLASH VIDEO ON TYPES OF RAINFALL
Show Weather Rainfall wmv
http://blip.tv/scripts/flash/blipplayer.swf?
autoStart=false&file=http://blip.tv/file/get/Gatm-
Rainfall922.flv?source=3
49. SEASONS
• are determined by the location of various pressure
systems.
Remember:
• Summer = Lows over Northern Australia and
Highs over Southern Australia.
• Winter = Highs over Northern Australia and Lows
over Southern Australia.
52. CLEAR SKIES ALLOW THE
SUN’S RAYS TO HAVE MAXIMUM
EFFECT. DAYTIME
TEMPERATURES ARE USUALLY
HIGH.
At night, clear skies
allow heat to be lost
causing temperatures
to fall. In winter frosts
are likely.
54. FACTORS AFFECTING THE CLIMATE
What makes a certain place hot, cold, wet,
dry, windy…?
55. YOUR IDEAS
On the A4 paper provided
and working in pairs:
Quickly sketch as many ideas as
you can as what might cause
temperature and rainfall to be
different at various places.
You have 3 minutes
56. WORLD PATTERN OF CLIMATE
The climate of a particular place on the earth’s
surface depends on 5 main factors.
Latitude:
radiation from the sun is stronger and more direct
at the equator. Places at the equator are therefore
generally hotter than the places near the poles.
Also seasonal differences are more obvious away
from the equator.
59. ALTITUDE (ELEVATION):
• The air is generally thinner and therefore colder
higher up in the mountains than it is at sea level.
Also precipitation (rainfall and snowfall) is generally
affected by mountain ranges as moist air will be
forced to rise over the mountains (orographic
rainfall). This will cause the air to cool and then
condense into cloud.
60. DISTANCE FROM THE SEA:
• The ocean acts as a stabilising influence on
temperatures as the sea heats and cools more
slowly than the land. Thus diurnal (daily) and
annual (yearly) ranges of temperature are smaller
near the coast and greater in inland areas. This
means that inland areas generally have hotter
summers and colder winters than coastal areas.
Also moist air near the coast may result in more
rainfall in coastal areas than places inland.
61. DISTANCE FROM THE SEA
• In the summer, the sun heats
the land quickly but it takes
longer to heat up the water
which is large and deep.
http://people.cas.sc.edu/carbone/
modules/mods4car/ccontrol/
controls/landwater1.html
• However, the water stores heat
for longer and so in winter, the
temperature of the sea is
warmer relative to the land and
so keeps coastal places warmer.
62. OCEAN CURRENTS:
• Cold ocean currents cool the air and generally cause
dry conditions along the coastline. Warm ocean
currents will warm the air and cause warmer, wetter
conditions.
• http://people.cas.sc.edu/carbone/modules/
mods4car/ccontrol/controls/ocean.html
63.
64. PREVAILING WINDS
• These are the winds that
blow most often.
• Winds can affect
temperature and
precipitation.
• Winds blowing over
tropical oceans bring
warm and wet weather.
• Winds blowing from the
poles and over land bring
cold and dry weather.