Downloaded 326 times

![Andres von Simson – LATAM Chapter Administration [email_address] Further info www.supply-chain.org Elcio Grassia – LATAM Chapter Chair [email_address]](https://image.slidesharecdn.com/scorsccintro-totvs-090628130234-phpapp02/85/Supply-Chain-Council-54-320.jpg)

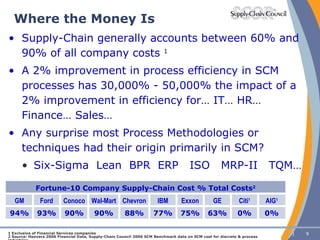
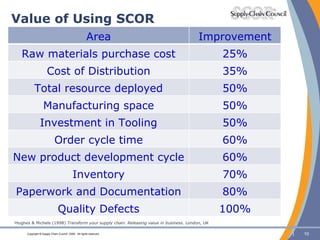
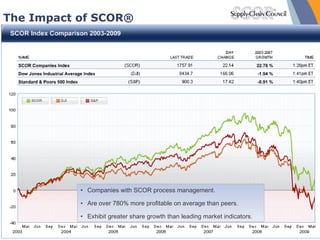
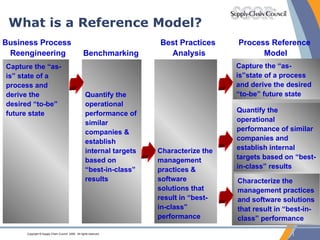
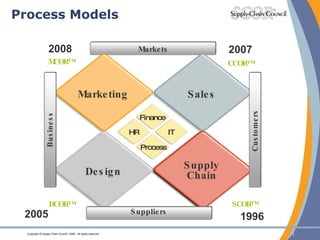
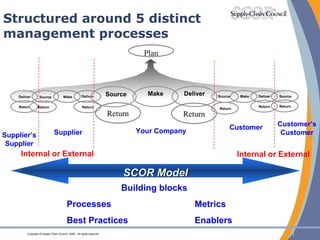
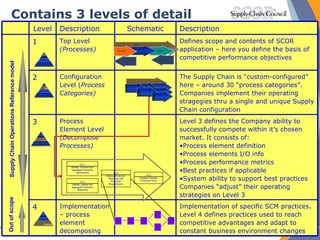
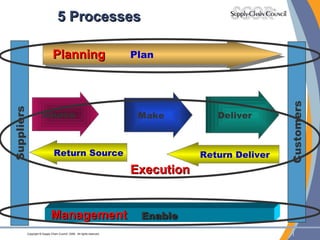
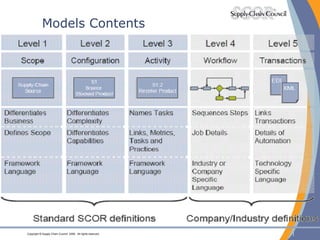
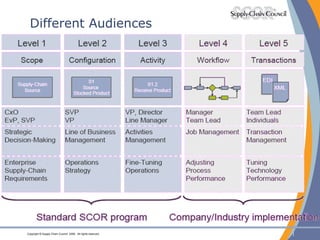
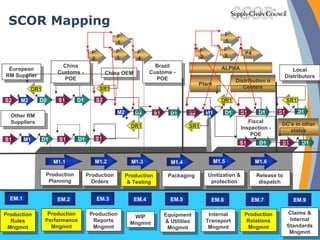
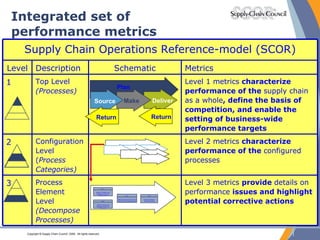
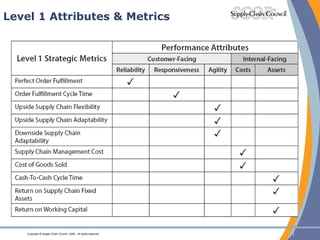
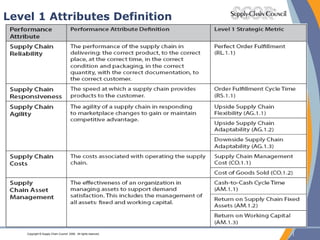
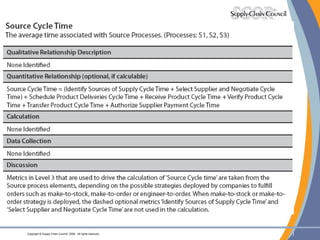
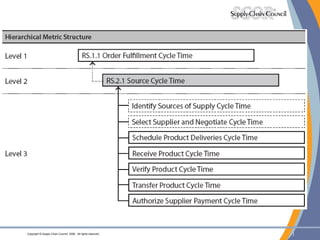
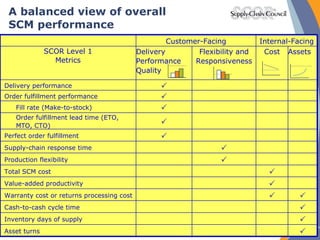
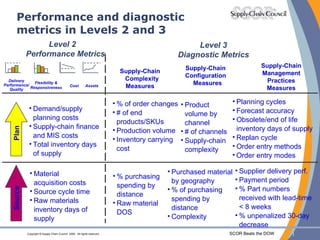
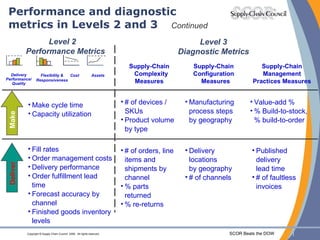
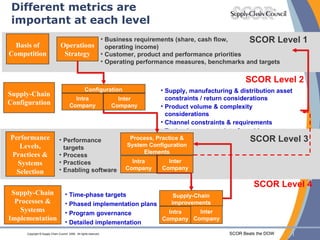
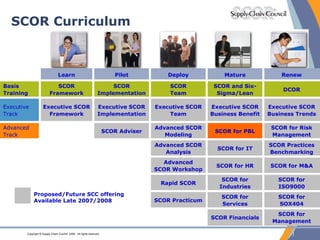
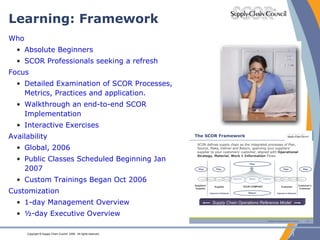
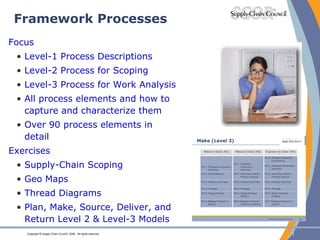
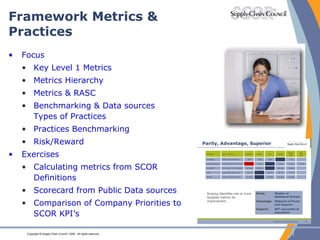
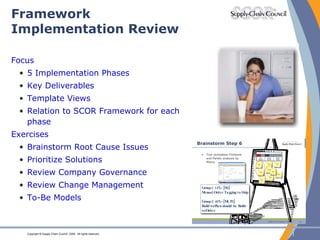
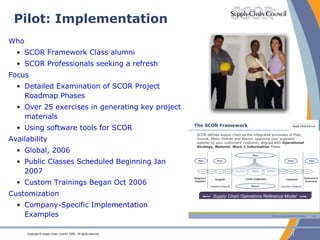
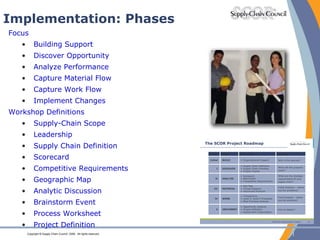
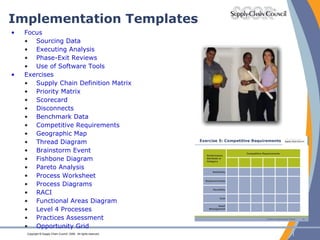
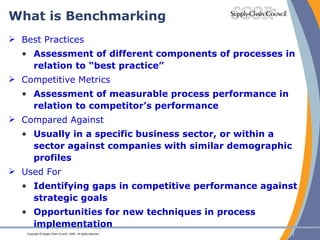
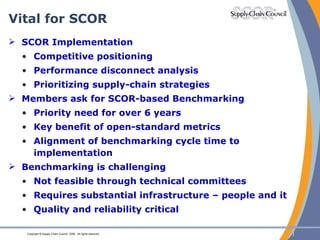
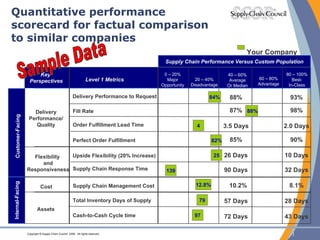
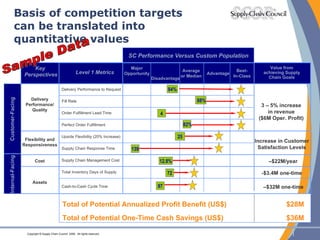
The document discusses supply chain management concepts including the SCOR (Supply Chain Operations Reference) model. SCOR is a process reference model developed by the Supply Chain Council to help companies define and measure supply chain processes. It provides a framework to measure performance at different levels, from overall supply chain metrics to more granular process metrics. The document also discusses how benchmarking with SCOR allows companies to compare their supply chain performance to peers.


![Getting Started with Apache Spark: Big Data Made Simple [Free Meetup]](https://cdn.slidesharecdn.com/ss_thumbnails/apachesparkgettingstarted-260203175547-8361bcc3-thumbnail.jpg?width=640&height=640&fit=bounds)


