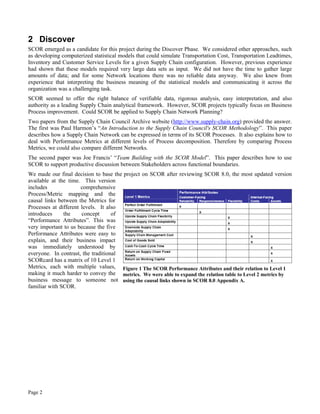
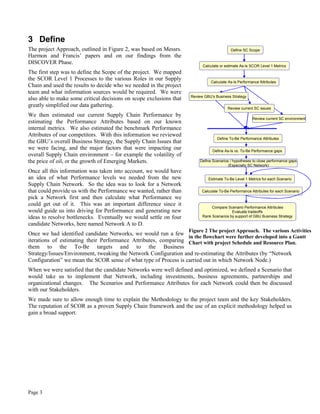
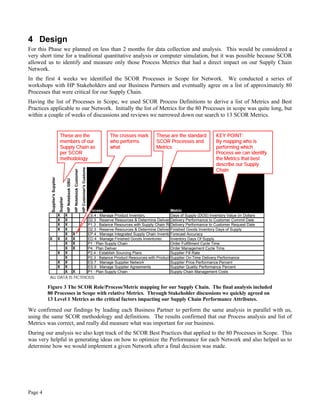
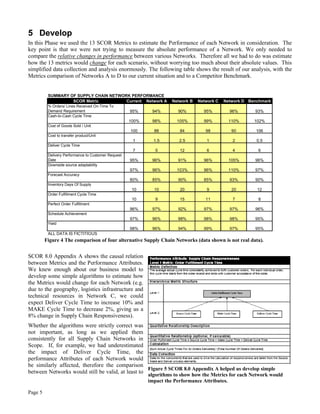
Page 1
Supply Chain Network Strategy with SCOR
Author: Richard Freggi, Senior Supply Chain Architect, Notebook GBU, Hewlett-Packard Company
richard.freggi@hp.com
Project team members:
Ike Harris, Vice President, Notebook GBU Supply Chain (Executive Sponsor)
Roger Bhalla, Director, Business Notebook Supply Chain (Active Sponsor)
Richard Freggi, Senior Supply Chain Architect, Notebook GBU (Project Manager)
Chris Church, Manager, Supply Chain Processes and Systems, Notebook GBU (PLAN)
John Lord, Senior Manager, Strategic Sourcing, Notebook GBU (SOURCE)
Mark Kidwell, Senior Manager, Notebook Supply Chain (MAKE)
Rick Shan, Partner Manager, Notebook GBU (MAKE)
Jeff Young, Manager, Global Airfreight Procurement (DELIVER)
Henry Chiu, Senior Manager, Logistics, Notebook GBU (DELIVER)
Jeff Cowell, Supply Chain Architect, Notebook GBU (Data analysis)
Abstract
HP’s Notebook GBU is the world leader in notebook PCs with well over 20% market share. To sustain its impressive
growth, HP needs to evaluate the possibility of manufacturing in different geographical areas. We surveyed HP’s
considerable in-house experience in Supply Chain network planning, and selected SCOR 8.0 as the basis of our analysis.
This provided several benefits:
- Easy data collection
- Systematic Supply Chain analysis without need for complex statistical models
- Easy evaluation of variants and ‘What If’ scenarios.
- Efficient communication with dozens of Stakeholders having different viewpoints
Most important of all, the SCOR framework allowed us to convey the business choices and tradeoffs of different Supply
Chain Networks, providing the basis for effective discussion and decision-making.
1 Problem Statement
The Supply Chain managed by HP’s Notebook Global Business Unit (GBU) must ensure prompt delivery of
millions of Notebook PCs every month, worldwide. This includes Build-To-Stock and Build-To-Order products,
with a mixed transport mode of air and sea, and the inclusion of value-added services such as product
customization. The product development and production process is managed by HP Business Partners.
As production volumes continue to increase, the project team was asked to evaluate locations for additional
manufacturing sites. Such a decision has obviously important consequences on HP’s own Business Units, on
HP’s suppliers, and on the local Governments of the sites under consideration. We had to deliver an evaluation
that was simple, transparent, authoritative, and that would stand up to scrutiny from dozens of interested
Stakeholders.
We applied HP’s Global Method to manage the project, dividing it into five Phases:
• Discover: understand the problem and make some hypothesis about solutions
• Define: decide on deliverables, develop an approach, make a plan, secure resources
• Design: make a blueprint of the solution
• Develop: follow the blueprint to build the solution
• Deliver: obtain Stakeholders approval for the solution
Page 2
2 Discover
SCOR emerged as a candidate for this project during the Discover Phase. We considered other approaches, such
as developing computerized statistical models that could simulate Transportation Cost, Transportation Leadtimes,
Inventory and Customer Service Levels for a given Supply Chain configuration. However, previous experience
had shown that these models required very large data sets as input. We did not have the time to gather large
amounts of data; and for some Network locations there was no reliable data anyway. We also knew from
experience that interpreting the business meaning of the statistical models and communicating it across the
organization was a challenging task.
SCOR seemed to offer the right balance of verifiable data, rigorous analysis, easy interpretation, and also
authority as a leading Supply Chain analytical framework. However, SCOR projects typically focus on Business
Process improvement. Could SCOR be applied to Supply Chain Network Planning?
Two papers from the Supply Chain Council Archive website (http://www.supply-chain.org) provided the answer.
The first was Paul Harmon’s “An Introduction to the Supply Chain Council's SCOR Methodology”. This paper
describes how a Supply Chain Network can be expressed in terms of its SCOR Processes. It also explains how to
deal with Performance Metrics at different levels of Process decomposition. Therefore by comparing Process
Metrics, we could also compare different Networks.
The second paper was Joe Francis’ “Team Building with the SCOR Model”. This paper describes how to use
SCOR to support productive discussion between Stakeholders across functional boundaries.
We made our final decision to base the project on SCOR after reviewing SCOR 8.0, the most updated version
available at the time. This version
includes comprehensive
Process/Metric mapping and the
causal links between the Metrics for
Processes at different levels. It also
introduces the concept of
“Performance Attributes”. This was
very important to us because the five
Performance Attributes were easy to
explain, and their business impact
was immediately understood by
everyone. In contrast, the traditional
SCORcard has a matrix of 10 Level 1
Metrics, each with multiple values,
making it much harder to convey the
business message to someone not
familiar with SCOR.
Figure 1 The SCOR Performance Attributes and their relation to Level 1
metrics. We were able to expand the relation table to Level 2 metrics by
using the causal links shown in SCOR 8.0 Appendix A.
Page 3
3 Define
The project Approach, outlined in Figure 2, was based on Messrs.
Harmon and Francis’ papers and on our findings from the
DISCOVER Phase.
The first step was to define the Scope of the project. We mapped
the SCOR Level 1 Processes to the various Roles in our Supply
Chain and used the results to decide who we needed in the project
team and what information sources would be required. We were
also able to make some critical decisions on scope exclusions that
greatly simplified our data gathering.
We then estimated our current Supply Chain Performance by
estimating the Performance Attributes based on our known
internal metrics. We also estimated the benchmark Performance
Attributes of our competitors. With this information we reviewed
the GBU’s overall Business Strategy, the Supply Chain Issues that
we were facing, and the major factors that were impacting our
overall Supply Chain environment – for example the volatility of
the price of oil, or the growth of Emerging Markets.
Once all this information was taken into account, we would have
an idea of what Performance levels we needed from the new
Supply Chain Network. So the idea was to look for a Network
that could provide us with the Performance we wanted, rather than
pick a Network first and then calculate what Performance we
could get out of it. This was an important difference since it
would guide us into driving for Performance and generating new
ideas to resolve bottlenecks. Eventually we would settle on four
candidate Networks, here named Network A to D.
Once we had identified candidate Networks, we would run a few
iterations of estimating their Performance Attributes, comparing
them to the To-Be targets and to the Business
Strategy/Issues/Environment, tweaking the Network Configuration and re-estimating the Attributes (by “Network
Configuration” we mean the SCOR sense of what type of Process is carried out in which Network Node.)
When we were satisfied that the candidate Networks were well defined and optimized, we defined a Scenario that
would take us to implement that Network, including investments, business agreements, partnerships and
organizational changes. The Scenarios and Performance Attributes for each Network could then be discussed
with our Stakeholders.
We made sure to allow enough time to explain the Methodology to the project team and the key Stakeholders.
The reputation of SCOR as a proven Supply Chain framework and the use of an explicit methodology helped us
gain a broad support.
Define SC Scope
Calculate or estimate As-Is SCOR Level 1 Metrics
Define To-Be Performance Attributes
Define As-Is vs. To-Be Performance gaps
Compare Scenario Performance Attributes
Evaluate tradeoffs
Rank Scenarios by support of GBU Business Strategy
Define Scenarios / hypotheses to close performance gaps
(Especially SC Network)
Calculate As-Is Performance Attributes
Estimate To-Be Level 1 Metrics for each Scenario
Calculate To-Be Performance Attributes for each Scenario
Review GBU’s Business Strategy
Review current SC environment
Review current SC issues
Figure 2 The project Approach. The various Activities
in the flowchart were further developed into a Gantt
Chart with project Schedule and Resource Plan.
Page 4
4 Design
For this Phase we planned on less than 2 months for data collection and analysis. This would be considered a
very short time for a traditional quantitative analysis or computer simulation, but it was possible because SCOR
allowed us to identify and measure only those Process Metrics that had a direct impact on our Supply Chain
Network.
In the first 4 weeks we identified the SCOR Processes in Scope for Network. We conducted a series of
workshops with HP Stakeholders and our Business Partners and eventually agree on a list of approximately 80
Processes that were critical for our Supply Chain.
Having the list of Processes in Scope, we used SCOR Process Definitions to derive a list of Metrics and Best
Practices applicable to our Network. Initially the list of Metrics for the 80 Processes in scope was quite long, but
within a couple of weeks of discussions and reviews we narrowed down our search to 13 SCOR Metrics.
We confirmed our findings by leading each Business Partner to perform the same analysis in parallel with us,
using the same SCOR methodology and definitions. The results confirmed that our Process analysis and list of
Metrics was correct, and really did measure what was important for our business.
During our analysis we also kept track of the SCOR Best Practices that applied to the 80 Processes in Scope. This
was very helpful in generating ideas on how to optimize the Performance for each Network and also helped us to
determine how we would implement a given Network after a final decision was made.
Supplier'sSupplier
Supplier
HPNotebookGBU
HPNotebookCustomer
HPCustomer'sCustomer
Process Metric
X X ES.4 : Manage Product Inventory Days of Supply (DOS) Inventory Value (in Dollars)
X X D2.3 : Reserve Resources & Determine Delivery DateDelivery Performance to Customer Commit Date
X X P1.3 : Balance Resources with Supply Chain RequirementsDelivery Performance to Customer Request Date
X X D2.3 : Reserve Resources & Determine Delivery DateFinished Goods Inventory Days of Supply
X X EP.4 : Manage Integrated Supply Chain InventoryForecast Accuracy
X X X X ED.4 : Manage Finished Goods Inventories Inventory Days Of Supply
X X P1 : Plan Supply Chain Order Fulfillment Cycle Time
X X P4 : Plan Deliver Order Management Cycle Time
X X P2.4 : Establish Sourcing Plans Supplier Fill Rate
X P2.3 : Balance Product Resources with Product RequirementsSupplier On-Time Delivery Performance
X X ES.7 : Manage Supplier Network Supplier Price Performance Percent
X X ES.9 : Manage Supplier Agreements Supplier Quality Performance Percent
X X P1 : Plan Supply Chain Supply Chain Management Costs
These are the
members of our
Supply Chain as
per SCOR
methodology
The crosses mark
who performs
what
These are the standard
SCOR Processes and
Metrics
KEY POINT:
By mapping who is
performing which
Process we can identify
the Metrics that best
describe our Supply
Chain
ALL DATA IS FICTITIOUS
Figure 3 The SCOR Role/Process/Metric mapping for our Supply Chain. The final analysis included
80 Processes in Scope with relative Metrics. Through Stakeholder discussions we quickly agreed on
13 Level 1 Metrics as the critical factors impacting our Supply Chain Performance Attributes.
Page 5
5 Develop
In this Phase we used the 13 SCOR Metrics to estimate the Performance of each Network in consideration. The
key point is that we were not trying to measure the absolute performance of a Network. We only needed to
compare the relative changes in performance between various Networks. Therefore all we had to do was estimate
how the 13 metrics would change for each scenario, without worrying too much about their absolute values. This
simplified data collection and analysis enormously. The following table shows the result of our analysis, with the
Metrics comparison of Networks A to D to our current situation and to a Competitor Benchmark.
SCOR 8.0 Appendix A shows the causal relation
between Metrics and the Performance Attributes.
We knew enough about our business model to
develop some simple algorithms to estimate how
the Metrics would change for each Network (e.g.
due to the geography, logistics infrastructure and
technical resources in Network C, we could
expect Deliver Cycle Time to increase 10% and
MAKE Cycle Time to decrease 2%, giving us a
8% change in Supply Chain Responsiveness).
Whether the algorithms were strictly correct was
not important, as long as we applied them
consistently for all Supply Chain Networks in
Scope. If, for example, we had underestimated
the impact of Deliver Cycle Time, the
performance Attributes of each Network would
be similarly affected, therefore the comparison
between Networks would still be valid, at least to
Figure 5 SCOR 8.0 Appendix A helped us develop simple
algorithms to show how the Metrics for each Network would
impact the Performance Attributes.
SUMMARY OF SUPPLY CHAIN NETWORK PERFORMANCE
SCOR Metric Current Network A Network B Network C Network D Benchmark
% Orders/ Lines Received On-Time To
Demand Requirement 95% 94% 90% 95% 96% 93%
Cash-to-Cash Cycle Time
100% 98% 105% 99% 110% 102%
Cost of Goods Sold / Unit
100 88 84 98 90 106
Cost to transfer product/Unit
1 1.5 2.5 1 2 0.5
Deliver Cycle Time
7 5 12 6 4 6
Delivery Performance to Customer Request
Date 95% 96% 91% 96% 105% 96%
Downside source adaptability
97% 96% 103% 96% 110% 97%
Forecast Accuracy
80% 85% 90% 85% 93% 90%
Inventory Days Of Supply
10 10 20 9 20 12
Order Fulfillment Cycle Time
10 9 15 11 7 8
Perfect Order Fulfillment
96% 97% 92% 97% 97% 96%
Schedule Achievement
97% 96% 88% 98% 98% 95%
Yield
98% 96% 94% 99% 97% 95%
ALL DATA IS FICTITIOUS
Figure 4 The comparison of four alternative Supply Chain Networks (data shown is not real data).
Page 6
first order of magnitude. This was comfortably within the accuracy required for a strategy project looking at
future Network performance. If validation was needed, we could drill-down to detailed calculations on a case-by-
case basis.
We calculated the Performance Attributes for each Network and plotted them on Spider Charts. The graphs of
different Networks could be superimposed, giving us a powerful visual comparison of the benefits and tradeoffs.
The axis on the Spider Charts have no units because the dimensions are arbitrary. We just added arbitrary factors
to each Performance Attribute to make it scale on a 0 to 4 range. The ‘Supply Chain Cost’ axis is reversed –
lower cost shows as a higher value. Once again, the principle was that as long as the scaling was applied
consistently to all Networks, the comparison between them would remain valid. This stressed the value of SCOR
as a thinking tool rather than a measuring stick.
Estimated Supply Chain Performance
Reliability
Asset
Management
Cost Flexibility
Responsi
veness
0
1
2
3
4
Current Network
Competitor Benchmark
Network A
All data is fictitious
Competitor Benchmark shows more
Flexibility and Responsiveness that
our Current Network
Network A will give us superior Asset
Management, Reliability and Cost but
is less Flexible than Current Network
Figure 6 The Supply Chain Performance comparisons for some Networks in scope. This chart shows the benefits and
tradeoffs of Network A compared to our current Performance and to our competitors.
The visual comparisons proved very effective in stimulating discussions and new ideas within the Stakeholder
groups. We would often wonder why a certain Network looked in a given way and through our simple algorithms
we could drill down to the likely causes. We could then formulate new hypothesis or develop better
Configurations, and see the results in the graph. We went through a few cycles of graphing, discussion and re-
graphing, each time deepening our understanding of what were the critical success factors for each Network.
Page 7
6 Deliver
In the DELIVER Phase we presented our findings, analysis and conclusions to our Stakeholders. The visual
representations were very effective in conveying the key business messages. We could also prove to our audience
that we applied a simple, diligent and transparent process leading to our final recommendations. Thanks to
SCOR, this was achieved quickly and easily.
As a result of Stakeholder reviews we developed detailed transition plans for two of the four networks under
consideration. Many of the plan’s details were based on the list of SCOR Best Practices that we had compiled
during the DESIGN Phase.
The idea was that we would do all preparation work upfront and then move directly into implementation once the
opportunity presented itself. As it happened, opportunity knocked within a few months. It was not quite as
postulated in the original transition plans, but close enough. We quickly adapted one of the transition plans to the
specific situation.
Our work with SCOR prepared a wide array of Stakeholders for the inevitable decisions and tradeoffs, helped us
identify and manage transition risks, and guided us to optimize the business benefits of the transition. Our efforts
have served us well.

Supply Chain Network Strategy with SCOR

  • 1.
    Page 1 Supply ChainNetwork Strategy with SCOR Author: Richard Freggi, Senior Supply Chain Architect, Notebook GBU, Hewlett-Packard Company richard.freggi@hp.com Project team members: Ike Harris, Vice President, Notebook GBU Supply Chain (Executive Sponsor) Roger Bhalla, Director, Business Notebook Supply Chain (Active Sponsor) Richard Freggi, Senior Supply Chain Architect, Notebook GBU (Project Manager) Chris Church, Manager, Supply Chain Processes and Systems, Notebook GBU (PLAN) John Lord, Senior Manager, Strategic Sourcing, Notebook GBU (SOURCE) Mark Kidwell, Senior Manager, Notebook Supply Chain (MAKE) Rick Shan, Partner Manager, Notebook GBU (MAKE) Jeff Young, Manager, Global Airfreight Procurement (DELIVER) Henry Chiu, Senior Manager, Logistics, Notebook GBU (DELIVER) Jeff Cowell, Supply Chain Architect, Notebook GBU (Data analysis) Abstract HP’s Notebook GBU is the world leader in notebook PCs with well over 20% market share. To sustain its impressive growth, HP needs to evaluate the possibility of manufacturing in different geographical areas. We surveyed HP’s considerable in-house experience in Supply Chain network planning, and selected SCOR 8.0 as the basis of our analysis. This provided several benefits: - Easy data collection - Systematic Supply Chain analysis without need for complex statistical models - Easy evaluation of variants and ‘What If’ scenarios. - Efficient communication with dozens of Stakeholders having different viewpoints Most important of all, the SCOR framework allowed us to convey the business choices and tradeoffs of different Supply Chain Networks, providing the basis for effective discussion and decision-making. 1 Problem Statement The Supply Chain managed by HP’s Notebook Global Business Unit (GBU) must ensure prompt delivery of millions of Notebook PCs every month, worldwide. This includes Build-To-Stock and Build-To-Order products, with a mixed transport mode of air and sea, and the inclusion of value-added services such as product customization. The product development and production process is managed by HP Business Partners. As production volumes continue to increase, the project team was asked to evaluate locations for additional manufacturing sites. Such a decision has obviously important consequences on HP’s own Business Units, on HP’s suppliers, and on the local Governments of the sites under consideration. We had to deliver an evaluation that was simple, transparent, authoritative, and that would stand up to scrutiny from dozens of interested Stakeholders. We applied HP’s Global Method to manage the project, dividing it into five Phases: • Discover: understand the problem and make some hypothesis about solutions • Define: decide on deliverables, develop an approach, make a plan, secure resources • Design: make a blueprint of the solution • Develop: follow the blueprint to build the solution • Deliver: obtain Stakeholders approval for the solution
  • 2.
    Page 2 2 Discover SCORemerged as a candidate for this project during the Discover Phase. We considered other approaches, such as developing computerized statistical models that could simulate Transportation Cost, Transportation Leadtimes, Inventory and Customer Service Levels for a given Supply Chain configuration. However, previous experience had shown that these models required very large data sets as input. We did not have the time to gather large amounts of data; and for some Network locations there was no reliable data anyway. We also knew from experience that interpreting the business meaning of the statistical models and communicating it across the organization was a challenging task. SCOR seemed to offer the right balance of verifiable data, rigorous analysis, easy interpretation, and also authority as a leading Supply Chain analytical framework. However, SCOR projects typically focus on Business Process improvement. Could SCOR be applied to Supply Chain Network Planning? Two papers from the Supply Chain Council Archive website (http://www.supply-chain.org) provided the answer. The first was Paul Harmon’s “An Introduction to the Supply Chain Council's SCOR Methodology”. This paper describes how a Supply Chain Network can be expressed in terms of its SCOR Processes. It also explains how to deal with Performance Metrics at different levels of Process decomposition. Therefore by comparing Process Metrics, we could also compare different Networks. The second paper was Joe Francis’ “Team Building with the SCOR Model”. This paper describes how to use SCOR to support productive discussion between Stakeholders across functional boundaries. We made our final decision to base the project on SCOR after reviewing SCOR 8.0, the most updated version available at the time. This version includes comprehensive Process/Metric mapping and the causal links between the Metrics for Processes at different levels. It also introduces the concept of “Performance Attributes”. This was very important to us because the five Performance Attributes were easy to explain, and their business impact was immediately understood by everyone. In contrast, the traditional SCORcard has a matrix of 10 Level 1 Metrics, each with multiple values, making it much harder to convey the business message to someone not familiar with SCOR. Figure 1 The SCOR Performance Attributes and their relation to Level 1 metrics. We were able to expand the relation table to Level 2 metrics by using the causal links shown in SCOR 8.0 Appendix A.
  • 3.
    Page 3 3 Define Theproject Approach, outlined in Figure 2, was based on Messrs. Harmon and Francis’ papers and on our findings from the DISCOVER Phase. The first step was to define the Scope of the project. We mapped the SCOR Level 1 Processes to the various Roles in our Supply Chain and used the results to decide who we needed in the project team and what information sources would be required. We were also able to make some critical decisions on scope exclusions that greatly simplified our data gathering. We then estimated our current Supply Chain Performance by estimating the Performance Attributes based on our known internal metrics. We also estimated the benchmark Performance Attributes of our competitors. With this information we reviewed the GBU’s overall Business Strategy, the Supply Chain Issues that we were facing, and the major factors that were impacting our overall Supply Chain environment – for example the volatility of the price of oil, or the growth of Emerging Markets. Once all this information was taken into account, we would have an idea of what Performance levels we needed from the new Supply Chain Network. So the idea was to look for a Network that could provide us with the Performance we wanted, rather than pick a Network first and then calculate what Performance we could get out of it. This was an important difference since it would guide us into driving for Performance and generating new ideas to resolve bottlenecks. Eventually we would settle on four candidate Networks, here named Network A to D. Once we had identified candidate Networks, we would run a few iterations of estimating their Performance Attributes, comparing them to the To-Be targets and to the Business Strategy/Issues/Environment, tweaking the Network Configuration and re-estimating the Attributes (by “Network Configuration” we mean the SCOR sense of what type of Process is carried out in which Network Node.) When we were satisfied that the candidate Networks were well defined and optimized, we defined a Scenario that would take us to implement that Network, including investments, business agreements, partnerships and organizational changes. The Scenarios and Performance Attributes for each Network could then be discussed with our Stakeholders. We made sure to allow enough time to explain the Methodology to the project team and the key Stakeholders. The reputation of SCOR as a proven Supply Chain framework and the use of an explicit methodology helped us gain a broad support. Define SC Scope Calculate or estimate As-Is SCOR Level 1 Metrics Define To-Be Performance Attributes Define As-Is vs. To-Be Performance gaps Compare Scenario Performance Attributes Evaluate tradeoffs Rank Scenarios by support of GBU Business Strategy Define Scenarios / hypotheses to close performance gaps (Especially SC Network) Calculate As-Is Performance Attributes Estimate To-Be Level 1 Metrics for each Scenario Calculate To-Be Performance Attributes for each Scenario Review GBU’s Business Strategy Review current SC environment Review current SC issues Figure 2 The project Approach. The various Activities in the flowchart were further developed into a Gantt Chart with project Schedule and Resource Plan.
  • 4.
    Page 4 4 Design Forthis Phase we planned on less than 2 months for data collection and analysis. This would be considered a very short time for a traditional quantitative analysis or computer simulation, but it was possible because SCOR allowed us to identify and measure only those Process Metrics that had a direct impact on our Supply Chain Network. In the first 4 weeks we identified the SCOR Processes in Scope for Network. We conducted a series of workshops with HP Stakeholders and our Business Partners and eventually agree on a list of approximately 80 Processes that were critical for our Supply Chain. Having the list of Processes in Scope, we used SCOR Process Definitions to derive a list of Metrics and Best Practices applicable to our Network. Initially the list of Metrics for the 80 Processes in scope was quite long, but within a couple of weeks of discussions and reviews we narrowed down our search to 13 SCOR Metrics. We confirmed our findings by leading each Business Partner to perform the same analysis in parallel with us, using the same SCOR methodology and definitions. The results confirmed that our Process analysis and list of Metrics was correct, and really did measure what was important for our business. During our analysis we also kept track of the SCOR Best Practices that applied to the 80 Processes in Scope. This was very helpful in generating ideas on how to optimize the Performance for each Network and also helped us to determine how we would implement a given Network after a final decision was made. Supplier'sSupplier Supplier HPNotebookGBU HPNotebookCustomer HPCustomer'sCustomer Process Metric X X ES.4 : Manage Product Inventory Days of Supply (DOS) Inventory Value (in Dollars) X X D2.3 : Reserve Resources & Determine Delivery DateDelivery Performance to Customer Commit Date X X P1.3 : Balance Resources with Supply Chain RequirementsDelivery Performance to Customer Request Date X X D2.3 : Reserve Resources & Determine Delivery DateFinished Goods Inventory Days of Supply X X EP.4 : Manage Integrated Supply Chain InventoryForecast Accuracy X X X X ED.4 : Manage Finished Goods Inventories Inventory Days Of Supply X X P1 : Plan Supply Chain Order Fulfillment Cycle Time X X P4 : Plan Deliver Order Management Cycle Time X X P2.4 : Establish Sourcing Plans Supplier Fill Rate X P2.3 : Balance Product Resources with Product RequirementsSupplier On-Time Delivery Performance X X ES.7 : Manage Supplier Network Supplier Price Performance Percent X X ES.9 : Manage Supplier Agreements Supplier Quality Performance Percent X X P1 : Plan Supply Chain Supply Chain Management Costs These are the members of our Supply Chain as per SCOR methodology The crosses mark who performs what These are the standard SCOR Processes and Metrics KEY POINT: By mapping who is performing which Process we can identify the Metrics that best describe our Supply Chain ALL DATA IS FICTITIOUS Figure 3 The SCOR Role/Process/Metric mapping for our Supply Chain. The final analysis included 80 Processes in Scope with relative Metrics. Through Stakeholder discussions we quickly agreed on 13 Level 1 Metrics as the critical factors impacting our Supply Chain Performance Attributes.
  • 5.
    Page 5 5 Develop Inthis Phase we used the 13 SCOR Metrics to estimate the Performance of each Network in consideration. The key point is that we were not trying to measure the absolute performance of a Network. We only needed to compare the relative changes in performance between various Networks. Therefore all we had to do was estimate how the 13 metrics would change for each scenario, without worrying too much about their absolute values. This simplified data collection and analysis enormously. The following table shows the result of our analysis, with the Metrics comparison of Networks A to D to our current situation and to a Competitor Benchmark. SCOR 8.0 Appendix A shows the causal relation between Metrics and the Performance Attributes. We knew enough about our business model to develop some simple algorithms to estimate how the Metrics would change for each Network (e.g. due to the geography, logistics infrastructure and technical resources in Network C, we could expect Deliver Cycle Time to increase 10% and MAKE Cycle Time to decrease 2%, giving us a 8% change in Supply Chain Responsiveness). Whether the algorithms were strictly correct was not important, as long as we applied them consistently for all Supply Chain Networks in Scope. If, for example, we had underestimated the impact of Deliver Cycle Time, the performance Attributes of each Network would be similarly affected, therefore the comparison between Networks would still be valid, at least to Figure 5 SCOR 8.0 Appendix A helped us develop simple algorithms to show how the Metrics for each Network would impact the Performance Attributes. SUMMARY OF SUPPLY CHAIN NETWORK PERFORMANCE SCOR Metric Current Network A Network B Network C Network D Benchmark % Orders/ Lines Received On-Time To Demand Requirement 95% 94% 90% 95% 96% 93% Cash-to-Cash Cycle Time 100% 98% 105% 99% 110% 102% Cost of Goods Sold / Unit 100 88 84 98 90 106 Cost to transfer product/Unit 1 1.5 2.5 1 2 0.5 Deliver Cycle Time 7 5 12 6 4 6 Delivery Performance to Customer Request Date 95% 96% 91% 96% 105% 96% Downside source adaptability 97% 96% 103% 96% 110% 97% Forecast Accuracy 80% 85% 90% 85% 93% 90% Inventory Days Of Supply 10 10 20 9 20 12 Order Fulfillment Cycle Time 10 9 15 11 7 8 Perfect Order Fulfillment 96% 97% 92% 97% 97% 96% Schedule Achievement 97% 96% 88% 98% 98% 95% Yield 98% 96% 94% 99% 97% 95% ALL DATA IS FICTITIOUS Figure 4 The comparison of four alternative Supply Chain Networks (data shown is not real data).
  • 6.
    Page 6 first orderof magnitude. This was comfortably within the accuracy required for a strategy project looking at future Network performance. If validation was needed, we could drill-down to detailed calculations on a case-by- case basis. We calculated the Performance Attributes for each Network and plotted them on Spider Charts. The graphs of different Networks could be superimposed, giving us a powerful visual comparison of the benefits and tradeoffs. The axis on the Spider Charts have no units because the dimensions are arbitrary. We just added arbitrary factors to each Performance Attribute to make it scale on a 0 to 4 range. The ‘Supply Chain Cost’ axis is reversed – lower cost shows as a higher value. Once again, the principle was that as long as the scaling was applied consistently to all Networks, the comparison between them would remain valid. This stressed the value of SCOR as a thinking tool rather than a measuring stick. Estimated Supply Chain Performance Reliability Asset Management Cost Flexibility Responsi veness 0 1 2 3 4 Current Network Competitor Benchmark Network A All data is fictitious Competitor Benchmark shows more Flexibility and Responsiveness that our Current Network Network A will give us superior Asset Management, Reliability and Cost but is less Flexible than Current Network Figure 6 The Supply Chain Performance comparisons for some Networks in scope. This chart shows the benefits and tradeoffs of Network A compared to our current Performance and to our competitors. The visual comparisons proved very effective in stimulating discussions and new ideas within the Stakeholder groups. We would often wonder why a certain Network looked in a given way and through our simple algorithms we could drill down to the likely causes. We could then formulate new hypothesis or develop better Configurations, and see the results in the graph. We went through a few cycles of graphing, discussion and re- graphing, each time deepening our understanding of what were the critical success factors for each Network.
  • 7.
    Page 7 6 Deliver Inthe DELIVER Phase we presented our findings, analysis and conclusions to our Stakeholders. The visual representations were very effective in conveying the key business messages. We could also prove to our audience that we applied a simple, diligent and transparent process leading to our final recommendations. Thanks to SCOR, this was achieved quickly and easily. As a result of Stakeholder reviews we developed detailed transition plans for two of the four networks under consideration. Many of the plan’s details were based on the list of SCOR Best Practices that we had compiled during the DESIGN Phase. The idea was that we would do all preparation work upfront and then move directly into implementation once the opportunity presented itself. As it happened, opportunity knocked within a few months. It was not quite as postulated in the original transition plans, but close enough. We quickly adapted one of the transition plans to the specific situation. Our work with SCOR prepared a wide array of Stakeholders for the inevitable decisions and tradeoffs, helped us identify and manage transition risks, and guided us to optimize the business benefits of the transition. Our efforts have served us well.