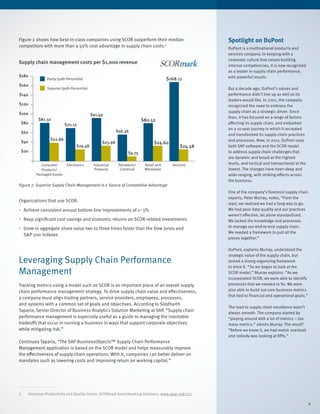
This document discusses the importance of supply chain metrics and analytics for managing supply chain complexity and risks. It summarizes that effective metrics and analytics can provide visibility across the supply chain and insights to drive performance improvements. The Supply Chain Operations Reference (SCOR) model is highlighted as an effective framework for standardizing metrics and enabling benchmarking. The document also provides an example of how DuPont has successfully used metrics and benchmarking based on the SCOR model to transform its supply chain and drive ongoing improvements.
Supply Chains to Admire - An Analysis of Supply Chain Excellence for 2006-2013Lora Cecere
Executive Overview
Supply chain excellence matters. It can make or break corporate performance. To drive improvements, companies need a clear definition of supply chain competency. It is easier to state than to define, and the market is full of beliefs that are not grounded by hard, cold facts.
Now 30-years old, the practice of supply chain management is still evolving. While companies speak of ‘best practices’, and boast about improvements in operating margin, inventory levels and asset management in conference after conference, we do not see it in our analysis of balance sheet information for any industry. The reason? The supply chain is not well-understood by executive teams, and many companies have pursued a project-based approach (implementing multiple projects with ROI above a threshold) or a focus on vertical excellence (where functional charters create very strong functional excellence); however, this is misguided. We do not find that these two approaches make a difference. Instead, we find that it is supply chain leadership driving resilient, predictable, and forward-looking processes that drives sustained balance sheet improvement. We find that for top performers that it happens in a slow and steady pattern versus the big-bang approach.
Supply chain leaders want to drive excellence. By their nature, these leaders are competitive. They want to drive performance improvements, increase corporate value and outpace competitors. It is not easy. The rate of business change is intense and the personal stakes are high. Day after day, leaders must answer questions like, “Which path should I to take? What are the best technologies to use? What is an acceptable rate of performance? How am I doing against my peer group? And, what can I learn from others that I can use to improve the performance of my own operation?” Until the development of the Supply Chain Index there was no independent and objective data-driven methodology that could answer these questions. With the development of this methodology, there now is a way to gauge improvement.
Collecting the data and doing the analysis in this report is the result of a 24-month effort. We were fearful at the end of the process that it would be difficult to pick the top performers, but we should not have worried. When we applied the methodology, the top companies hopped off the page. They were easy to spot. Listed by industry, the Companies to Admire are listed in Table 4. Within a peer group, we place them within alpha order. Due to the complexity of the analysis it is hard to rate them more granularly.
No companies made the list from the contract manufacturing, medical device, paper, pharmaceutical or retail peer groups. Likewise, there were more companies that made the list in the industrial than the consumer value networks.
Supply Chain Metrics That Matter: A Focus on Chemical, and Oil & Gas Companie...Lora Cecere
Executive Overview
Chemical supply chains serve global markets and multiple industries at varying levels of maturity. Over the last decade, no company stands out as a leader. The industry is stuck unable to make significant improvement on margin, inventory and asset utilization. The facts run counter to traditional beliefs. In most companies, there is a pervasive belief that Chemical and Oil and Gas companies implemented new technologies, and evolved processes to drive improved balance sheet results. As will be shown in this report, this is not true.
Why did this happen? The focus of the chemical companies remains functional and inside-out. The industry is slow to build adaptive networks and even slower to adopt demand-driven processes. This is in sharp contrast to an industry like consumer electronics where the thrusts and changes were swift and direct. To survive, these companies adopted new processes and technologies at a quicker rate than those in the Chemical, and Oil and Gas industries.
BASF wins the Supply Chains to Admire award while Statoil becomes a finalist. To help the industry to understand the current state and benchmark current processes, here we share insights.
The Race for Growth
The chemical industry experienced a post-recessionary boom with growth rates of 11% in the period of 2010-2012. In the recent three years, the growth rate has slowed to -1%. These recent growth rates were greatly affected by the boon and slowing of the Chinese markets and by the ups and down in crude. Over the period, AgroSciences and Specialty chemicals experienced the highest growth rates of the sector.
With the dramatic impact of the economy of growth and industry sector performance, one would think that the supply chain leaders of this sector would be aggressively pursuing market-driven supply chain practices to forecast based on market indicators and translate channel demand to supply. This is not the case. These processes remain very supply-centered with no chemical company driving market-driven programs.
The Global Supply Chain Ups the Ante for Risk ManagementLora Cecere
Executive Summary
Unfortunately, supply chain disruptions are a fact of life for today’s global multinational company. The reasons are many. A risk management event can be triggered by natural events, geopolitical shifts, economic uncertainty and demand/supply volatility.
Historically, the roots and genesis of risk management programs were based on attempts to reduce insurance costs. Today it is much, much more. The focus is on prevention, early sensing, and the execution of well-orchestrated plans to mitigate the impact of a disruption. Global supply chain leaders understand that designing and implementing a robust risk management practice is essential and fundamental to running a global business. The size of the bubble in Figure 2 indicates the relative level of risk today, and the colors correspond to the level of risk.
Figure 2. Comparison of Risk Drivers for the Past Five Years and Future Five Years
While product quality and supply chain visibility are declining but still important, the areas of operations complexity and the definition of globalization infrastructure is increasing. The areas of economic uncertainty, supplier reliability, along with demand volatility, are continued risk factors.
Over time, as supply chains morphed from regional to global multinational organizations, globalization and regulatory compliance increased. As a result, procurement has shifted from traditional programs focused solely on contract management, price and term negotiations, and supplier scorecards to include the evolution of supplier development, to manage product quality and multi-tier supplier relationships, in and across value chain relationships.
Today is a less certain world than a decade ago. Geopolitical shifts, economic uncertainty and demand/supply volatility are rising. In addition, to spur growth companies are quick to add products to the item master, but slow to rationalize the portfolio. The rising complexity of items sold decreases the organization’s ability to forecast, and the longer lead times across multiple tiers of sourcing and supply increases the Bullwhip Effect’s impact (distortion of the demand signal across multiple tiers of the value network). As a result, there is a greater need for supplier development and supplier sensing to reduce supply risk. Inventory management and supplier financial sensing grow in importance with the increase in uncertainty.
Risk management is no longer narrowly focused: a technology, a response to a natural disaster, or improving supply chain visibility. Instead, it is more holistic with a focus on managing demand and supply variability cross-functionally and improving outcomes in an uncertain world.
In this report, we share insights on the current state of risk management programs while providing recommendations on what defines excellence.
This webinar provides an overview of the 2014 GRESB Survey, the Survey Portal, and the submission process.
This slidedeck is also available as a webinar: http://vimeo.com/92213288
Supply Chain Index: Evaluating the Consumer Value Network -24 JUN 2014Lora Cecere
Executive Overview
Supply chain management is a balancing act. It requires alignment. This is easier said than done. The terms lack definition. What is balance? How can companies judge alignment? What defines improvement? In this series of reports, we want to help.
Day by day leaders are forced to make decisions on priorities and trade-offs like growth, profitability, cycle, and complexity. The supply chain leader is charged with improving the potential of an organization at the intersection of operating margins, inventory turns and case-fill rate1. But are the choices that are made conscious or unconscious? This is a strong factor in determining supply chain excellence. It is our hope that through this series of reports the choices can be made consciously, based on an improved knowledge of what is possible.
In our research, we find that laggards are held hostage and struggle to balance disparate demands with the threat of throwing the supply chain out of alignment. Success requires a nuanced approach using a portfolio of carefully selected metrics to ensure success.
While supply chain excellence does not make a company, it is hard for a company to succeed without it. While the discrete industries are more focused on cycles, the consumer value network is more focused on the optimization of flows.
Progress on the Supply Chain Index
The Supply Chain Index is a new methodology to measure corporate performance on the Supply Chain Effective Frontier. It was defined by the Supply Chain Insights team based on 30 months of research.
We find that supply chain practitioners struggle to manage conflicting priorities. To visualize this, we built the Effective Frontier Model. As shown in Figure 2, the Effective Frontier visualizes the competing priorities of every supply chain leader. Growth and profitability should be maximized, cycle time should be reduced, and complexity should be managed. However, an overweighed focus on any one of the four categories can wreak havoc on the operations of a supply chain. A focus on a singular metric can throw the supply chain out of balance.
The Supply Chain Index is designed to measure progress on balance, and metrics alignment. To build the Index, we chose the metrics of year-over-year growth, return on invested capital (ROIC), operating margin and inventory turns.
Executive Summary
Supply chain excellence makes a difference to corporate value. Resilient, predictable, and forward-looking supply chain processes drive sustained balance sheet improvement. This is especially true in times of declining growth. (In this research, only four industries—aerospace & defense, apparel, automotive, and packaging suppliers—experienced growth for 2009-2014.)
Leaders want to drive excellence. By their nature these leaders are competitive. They want to power performance improvements, increase corporate value, and outpace competitors. It is not easy. The rate of business change is intense and the personal stakes are high. Day after day, supply chain leaders must answer questions like, “Which path should I to take? What are the best technologies to use? What is an acceptable rate of performance? How am I doing against my peer group? And, what can I learn from others that I can use to improve the performance of my own operation?” Until the development of the Supply Chain Index there was no independent and objective data-driven methodology that could answer these questions. With the development of this methodology there is now a way to gauge improvement.
When we started this work we were fearful that the methodology would not be selective enough to reward leaders. Our fear was that the list would be too large. However, we should not have worried. For two consecutive years only 10% of the companies studied are performing above the average of their peer group on the Supply Chain Metrics That Matter—operating margin, inventory turns and Return on Invested Capital—while driving improvement to a greater degree than their peer group. It is a select group. Figure 5 shows the 26 winners of the 2015 Supply Chains to Admire analysis.
The 26 companies are: Anheuser-Busch InBev; Audi AG; Biogen Inc; CCL Industries Inc.; Cisco Systems, Inc.; Coloplast Corp.; CVS Pharmacy; Dollar General Corporation; Dollar Tree, Inc.; Eastman Chemical Company; EMC Corporation; The Estée Lauder Companies Inc.; General Mills, Inc.; Intel Corporation; Deere & Company; Lexmark International Inc.; L'Oréal Group; Nike, Inc.; PPG Industries; Qualcomm Inc.; Samsung Electronics Co. Ltd.; United Tractors; Wal-Mart Stores, Inc.; Western Digital Corporation; and Whole Foods Market Inc. (Note: Shorter corporate or trade names are used in the tables within this report.)
Seven companies have made the list for two consecutive years: Cisco Systems, Inc.; General Mills, Inc.; Eastman Chemical Company; EMC Corporation; Anheuser-Busch InBev; Intel Corporation; and Nike, Inc.
The Supply Chain Index - Improving Strength, Balance and Resiliency - 13 MAY ...Lora Cecere
Supply Chain Metrics That Matter is a series of monthly reports published by Supply Chain Insights LLC. These reports are a deep focus on a specific industry. This was preparatory work to understand the patterns of supply chain ratios for supply chain leaders.
As shown in Figure 1, the Supply Chain Insights team analyzed 15 different industries with deep dives on their progress on the cash-to-cash cycle.
Figure 1. Supply Chain Metrics That Matter Reports Published in 2012-2014
Here we take a next step, and launch the Supply Chain Index. The Supply Chain Index is a mathematical formula that a supply chain leader can use to measure their relative performance to an industry peer group. It was built in cooperation with the Operations Research team at Arizona State University (ASU).
This methodology was designed to measure the balance, strength and resiliency of a company’s supply chain from an objective financial perspective. It is a measurement of supply chain improvement during the period of 2006-2012. In April 2014, we published an in-depth look at the resiliency metric: Supply Chain Metrics That Matter: Improving Supply Chain Resiliency. In this report, adding strength and balance, we examine the calculation of these three values in tandem.
The supply chain is a complex system with increasing complexity. Here we analyze how companies made trade-offs over a period of several years in balancing growth, profitability, cycles, and complexity. Many of the trade-offs were unconscious. As complexity rose, it became more difficult for companies to manage the intersection of growth and inventory turns. For leaders, as you will see in this report, the trade-offs were conscious.
Within the world of Supply Chain Management (SCM), each industry is unique. We believe that it is dangerous to list all industries in a spreadsheet and declare a supply chain leader. Instead, we believe that change needs to be measured over a number of years with a focus on an industry peer group. Here we define, and demonstrate, how the Supply Chain Index can be used to measure supply chain performance. To help the reader, we share insights on three industries—chemical, consumer packaged goods and pharmaceutical—using the methodology.
Executive Summary
Supply chain management it is now three decades old. The processes are maturing. With the increase in complexity in markets and new product launch, supply chain excellence matters more than ever.
Manufacturing and distribution companies are looking for insights on how to parlay advances in supply chain management into balance sheet results. This is the goal of this report.
This report is a summary of research conducted during 2015. It provides a short summary of the major insights gathered from six quantitative and four qualitative studies. For more in-depth analysis reference the full reports outlined in the appendix.
Supply Chain Metrics That Matter - A Focus on Pharmaceutical Companies - 27 A...Lora Cecere
Executive Overview
When we compiled the Supply Chains to Admire Report in August 2014, no pharmaceutical company made the list. To make the list, a company had to deliver performance (above average results for the period of 2009-2013 than their peer group on a portfolio of metrics including operating margin, inventory turns and Return on Invested Capital) and drive supply chain improvement (based on the Supply Chain Index) faster than their peer group. We believe both performance and improvement matter.
In the pharmaceutical industry, we find most companies to be stuck. They have either regressed in supply chain performance or they are at the same point as they were a decade ago. For many supply chain leaders that attend conferences, this may seem unfathomable. There is an industry belief that companies have implemented new technologies, and evolved processes, and driven improved balance sheet results.
As we will show in this report, as seen in Figure 4, this is not necessarily the case. On average, AstraZeneca has outperformed Bristol-Myers Squibb, and the industry as a whole, but they are not resilient. They have gone backwards in margin and not sustained inventory turn improvements. In contrast, Bristol-Meyers Squibb has not made progress in either performance or improvement and has remained at the same level of performance, without improvement, throughout the period.
Supply Chain Metrics That Matter: Semiconductors and Hard Disk Drives - 18 FE...Lora Cecere
Executive Overview
Supply chain leaders struggle to align corporate and supply chain strategy and drive improved performance. We term this difficult balancing act The Effective Frontier and explain it as the process of balancing growth, profitability, cycle and complexity within a company’s supply chain operations.
A supply chain is a complex system with increasing complexity. A major gap in many supply chain strategies is a nuanced understanding of supply chain potential when these elements are viewed together as a system.
The focus of this report is semiconductor and hard disk drive manufacturers. As seen in table 1, when it comes to supply chain performance, the industry is neither the best nor the worst. They fall squarely in the middle. While middle of the pack in operating margin, the industry has shown an increase in the cash-to-cash cycle and a decrease in inventory turns. With increasing complexity, the industry has struggled to maintain inventory turn performance over the period.
Companies further back in the supply chain have struggled to a higher degree to balance The Effective Frontier than those closer to usage. This is largely due to the bullwhip effect—the distortion of a demand signal as it gets passed downstream from trading partner to trading partner. The chemical industry manufacturers, like semiconductor & hard disk drive manufacturers, are three to five levels back in the supply chain. Comparing the results in table 1 for the two industries illustrates how much better the semiconductor & hard disk drive manufacturers have done in a similar orientation. Operating margin is comparable across the two, but the chemical industry has a higher cash-to-cash cycle level and almost a 50% lower inventory turns value.
Semiconductor and hard disk drive manufacturers have been successful in a challenging downstream position. Cost pressure from OEMS has not (as of yet) cut into margin, and growth levels have remained strong with the move to mobile. Inventory remains problematic with all six companies in this report, demonstrating increased DOI and decreased inventory turns, since the start of the century. Part of this is likely due to the lengthening of the global supply chain, while another part is partly due to rising product and process complexity, but it remains a concern.
Historically, the industry has made strong gains on productivity. An increasing move towards automation in the precision driven manufacturing environment is expected to continue the rise in revenue per employee performance.
In this report, we discuss the financial realities of the semiconductor and hard disk drive supply chain and offer recommendations for improvement.
Inventory Optimization in a Market-Driven World - 27 APR 2015Lora Cecere
Executive Overview
Growth is slowing and the complexity in today’s supply chain is unprecedented. As a result, within a company, inventory management is often a hot issue. Shrinking inventory spins off a one-time, and highly desirable, cash windfall. In most industries there is a connection between market capitalization and inventory management. This drives pressure to reduce inventory and question existing practices. However, while companies are quick to ask questions, they often make the wrong judgements about inventory strategies. The goal of this report is to improve this dialogue.
Most companies have invested in many inventory optimization solutions over the last decade. Within the company, there is mounting frustration about the failure of these projects to actualize and maintain targets. What most companies fail to realize is that the technology strategy needs to be worked in concert with supply chain strategy. Often we find while companies improve inventory levels through the deployment of inventory technologies, operational decisions to widen the item master or lengthen the supply chain will undermine the project targets.
There are many drivers of inventory, and the management of inventory levels requires discipline and a cross-functional focus. It is a story of people, process, and technology. Let’s start with people. Today, fewer than 5% of companies have an end-to-end focus (as defined from the customer’s customer to the supplier’s supplier), and most companies lack alignment and balance. The largest gaps between are between operational and commercial groups. (Cecere L. , Three Techniques to Improve Organizational Alignment, 2013). As companies close the organizational gap, progress is made on inventory. Likewise, when it comes to balance, 68% of organizations surveyed lack balance in Sales and Operations Planning between the commercial groups (the “S”) and the operational groups (the “OP), When balance is achieved, the organization rates itself as more agile, and aligned, and there is an 11% improvement in inventory turns (Cecere L. , Research in Review, 2014).
Supply chain processes are now over 30-years old. While there is a generalized belief that maturity of supply chain processes has improved inventory turns, as can be seen in Figure 2, the improvements in cash-to-cash have primarily been driven by lengthening payables. In industries like beverage, pharmaceuticals, consumer packaged goods and medical device, the industry averages have gone backwards (inventory turns have decreased not increased). Only the food and apparel industries have posted double-digit improvements in inventory turns. Why? Food and apparel are largely regional supply chains which are maturing. They lag consumer packaged goods in supply chain maturity. While consumer packaged goods companies are more mature, they are more global. The rise of the global multinational has greatly impacted inventory requirements.
Supply Chain Metrics That Matter: A Critical Look at Operating Margin -10 DEC...Lora Cecere
Executive Overview
If a supply chain leader cannot demonstrate improvement in operating margin, they are often fired. Consequences are severe. However, as complexity in global supply chains has increased, it has become increasingly difficult to improve profitability metrics. Among supply chain leaders, operating margin is one of the preferred measures of profitability.
Successful supply chain management is about balance and particularly the balancing of growth, profitability, cycle and complexity. This is what we call The Effective Frontier. Supply chain management is getting tougher as commodity markets get more volatile, wage prices increase, and product life cycles shorten. It is up to the supply chain leader to design the network and processes to protect margin and balance the supply chain. This is becoming an increasingly difficult task.
The challenges are many and they vary by industry. Commodity pressure is higher than at any previous point in time as shown in Figure 2. There is a limited toolkit for how to offset margin pressure. They include better planning, transportation optimization, rethinking network design, improved Sales & Operations (S&OP) execution, and Kanban events with suppliers and customers. None are easy or quick fixes.
Additionally, while many think that calculating cost and monitoring profitability should be easy, this is not true. In our research, we find that only 24% of companies surveyed can easily access total supply chain cost information. The ability to get to the data and connect the dots on cost to operating margin performance remains difficult for most. In fact, as shown in Figure 3, for 53% of survey respondents, getting to total supply chain cost is difficult.
Operating margin is a straightforward calculation with serious implications. Of the ten industries profiled in Table 1, only two have increased operating margin over the period: consumer electronics and consumer packaged goods. Furthermore, of the 18 companies profiled individually in this report, less than 40% (7/18 = 39%) have made progress on margin in 2012 compared to their result in 2000. As shown in Table 1, it is becoming more and more difficult for companies to maintain balance on their portfolio of supply chain metrics. This trend is true across all industry subgroups.
Companies with the highest operating margin tend to be the least mature in their understanding of supply chain principles. As a result, they demonstrate the worst performance in balancing competing priorities on the Supply Chain Effective Frontier and are stuck on the Supply Chain Plateau. The positions of companies, and their relative successes over the last decade, are shown in figure 4.
Table 1 is sorted by average operating margin with pharmaceutical companies returning the highest average value at 0.25 over the period. With the patent cliff, and significant changes in the healthcare environment including ongoing implementation of the Affordable Care Act, ...
Putting Together the Pieces - A Guide to S&OP Technology Selection- 20 AUGUST...Lora Cecere
This report is the third in a three-part series. First we define a market-driven value network, then we apply these concepts to the Sales and Operations Planning process, and finally, we discuss the purchase of technology to enable this vision. Here are links to the reports:
• Building Market-driven Value Networks
• Market-driven Sales and Operations Planning
• Putting Together the Pieces
This report is based on nine years of observations of the Sales and Operations Software market’s evolution. It is built on the premise that the best research is based on year-over-year studies and ongoing market triangulation.
Supply Chain Metrics That Matter: A Closer Look at the Cash-To-Cash Cycle (20...Lora Cecere
Executive Overview
When it comes to metrics that matter, the cash-to-cash cycle is one of the top metrics cited by supply chain professionals. It is among the best financial metrics to provide a comprehensive picture of a company’s supply chain and the management of working capital.
The supply chain is a complex system. Successful management requires both orchestration and balance. To drive supply chain excellence, companies are required to balance four competing priorities: growth, profitability, cycle management and complexity. Several popular metrics, including the cash-to-cash cycle, for a variety of industries are presented in table 1.
2016 Supply Chains to Admire - Report - 26 July 2016Lora Cecere
Executive Summary
Supply chain excellence is easier to say than define. To make progress, companies need to clearly define the journey and the goals. For many this is problematic. The goals are unclear and the financial metrics are not well-understood. We want to provide research to help supply chain leaders correct these issues.
Supply chain leaders want to improve results to drive shareholder value, but there is a problem. There is no industry standard definition of supply chain excellence or clarity on the how actions of the supply chain team drive shareholder value. In this report we try to help fill in the gaps by giving definitions to both.
The Supply Chains to Admire analysis is now in its third year. It is a deep analysis of performance, improvement, and Price to Tangible Book Value (PTBV) of 320 companies across 31 industries for the period of 2009-2015. The source data for the analysis is public reporting of balance sheets and income statements. (Our source of balance sheet and income statement data is YCharts .)
Conquering the Supply Chain Effective FrontierLora Cecere
Conquering the Supply Chain Effective Frontier - A Handbook for the Value Chain Leader to Manage Trade-offs in Defining Supply Chain Excellence
Supply chain practices are nearing their third decade of maturation. The term supply chain excellence is bandied about by leaders, consultants and technology providers, but there is no alignment on what it means.
Conventional systems of measurement for supply chain excellence are problematic. In this report, we share insights gained during interviews with 75 supply chain pioneers. Based on their feedback we created a new framework, that we define here as the Supply Chain Effective Frontier, for supply chain leaders to use to determine supply chain excellence. This methodology is based on publicly available financial balance sheet data grouped into four sets of supply chain ratios: growth, profitability, cycle, and complexity.
We believe that supply chain excellence is best defined as the alignment of the supply chain team to deliver results to meet and exceed the requirements of the business strategy. This requires a clear vision and cross-functional coordination and alignment over a multi-year road map. It needs to be holistic. A supply chain is a complex system with increasing business complexity. The analysis needs to facilitate a clear understanding of trade-offs embedded in day-to-day decision making. It is this clarity that we find missing in many teams that we work with, and it is for this reason we wrote this report.
Market-driven S&OP Report - 16 July 2012Lora Cecere
A Guidebook on How to Build a Market-driven S&OP Process
For manufacturers and retailers, supply chain is business. The Sales and Operations Planning (S&OP) process aligns the organization to the business strategy. As companies have become more global and face rising complexity, volatility and uncertainty, the importance of S&OP has increased. However, business complexity has created a gap between what companies have and what is needed. From our research, here we cite examples of these gaps:
Business Guide for Supply Chain Leaders for S&OP in the PandemicLora Cecere
The return on investment for S&OP excellence in normal times is seven months, in the pandemic excellence in S&OP matters more than ever. Here we share a business guide for supply chain leaders to drive value and eliminate the pitfalls and potholes of S&OP evolution.
How to Add Agility and Customer Focus to the Healthcare Supply ChainUPS Longitudes
The global pharmaceutical and healthcare industry has
experienced a number of severe shocks to the system in
recent decades. What was once a sector where profits flowed
from ‘blockbuster’ drugs and a customer base willing to
pay premium prices has transformed into a quite different
world as a consequence of competition from generics along
with reduced budgets available to healthcare providers.
Compounding these problems are increasing regulatory
constraints and more challenging logistics requirements as
bio-pharmaceuticals and related products increase the need
for stricter control of temperature and shelf-life as they move
through the supply chain.
As a result there is now a significantly greater focus across
the sector on supply chain management. Previously, when
margins were higher and logistics costs were a relatively
small proportion of total costs, supply chain issues tended
to take a back seat. Now things have changed. Recent
research by UPS® has highlighted that many companies are
finding it difficult to develop supply chain capabilities that
can simultaneously take out costs whilst ensuring regulatory
compliance, track and trace, product security and stricter
temperature and shelf-life control.
Because of these pressures, a new approach to the design
and management of supply/demand networks in the industry
becomes imperative. In today’s marketplace, there is a need
for supply chains that are cost-effective, efficient and agile.
Companies operating in every industrial sector and in
every market around the world have been confronted in
recent years with significant challenges. These challenges
have come from numerous sources – economic recession,
demographic changes, geo-political upheavals to name but
a few. The healthcare and pharmaceutical industry has been
no exception and has been impacted by major changes in the
competitive and market environment.
Packaging Artwork: An Important Value Chain Process-17 SEP 2012Lora Cecere
The original goal of consumer packaging artwork management was defined to support new product launch and accelerate cost reduction opportunities within the organization. This process has become more complex. Most companies understand that it has become more complex and unwieldy, but they don’t know what to do. There are three drivers:
Supply Chain Metrics That Matter – A Focus on Auto Parts Companies 19 SEP 2017Lora Cecere
Report Details: This report is based on analysis of financial balance sheet and income statement data within the Automotive Parts industry, for the period of 2004-2016. The data is collected from YCharts.
Objective: To use the financial balance sheet and income statement data to better understand the state of the Automotive Parts industry supply chains and to determine which companies’ supply chains did the best on the delivery of a portfolio of metrics over the last 13 years.
Highlight: As the technology for automotive vehicles continues to evolve, it will become more paramount than ever for Auto Parts companies to become more demand-driven in their supply chain planning processes. Companies across the board saw their revenue drop significantly during the 2004-2016 period. Those who redefined their manufacturing and distribution processes, drove strong balance sheet results. Others learned that doing traditional retail more efficiently was not enough. As a result only one company, Autoliv Inc, made the list of Supply Chains to Admire Winners.
Supply Chain Metrics That Matter-A Focus on Semiconductor CompaniesLora Cecere
In this report, we share insights on 31 companies in the Semiconductor industry. This industry is the primary raw material provider and driver of innovation in the technology value network. Within the industry, there are three primary shifts defining the market:
1) Advanced analytics are pushing advancement in semiconductor manufacturing
2) New mobility trends are diversifying demand for automotive semiconductors
3) Security issues represent the greatest obstacle to growth of the Internet of Things, and semiconductor companies are helping address the issue
Within the technology value network, the story is survival. Price compression, technology advancement, and short product life cycles transformed supply chains. Most scrambled to keep up.
Due to the degree of change, some of the most advanced supply chain practices within any industry are in the technology value network. Despite the scramble to drive change and improve value, year-over-year change in this maturing value chain is a sea of red. In Table 1, the top number within each cell represents the average during the 2010 through 2016 time period, and the bottom number represents the percentage change in 2016 as compared to the value in 2010. So, the average growth in the Semiconductor industry was 14%, but the net change comparing the growth of 2010 to 2016 was a sharp decline of 23%.
Supply Chain Metrics That Matter: A Focus on Brick & Mortar Retail-18 FEB 2013Lora Cecere
The bricks and mortar retailer is being squeezed. Growth is slowing and margin is under pressure. With the rise of e-commerce, the role of the store is being redefined. It is about service and the customer experience. As a result, it is time to rethink the metrics that matter and focus outside-in on the shopper experience.
In this report, we share insights on the current state of bricks and mortar retail and offer our suggestions.
Brick & mortar retailers have weathered an intense decade with the persistent rise of e-commerce. The shopper has changed and recovery from the Great Recession is ongoing, but slow. Our previous Supply Chain Metrics That Matter: A Focus on Retail report focused on the broader industry trends affecting five different divisions of retailers and the challenges of multi-channel retail. This report narrows the focus to three segments of brick & mortar retailers struggling to adapt to the new world.
A retailer is not a retailer. We believe that retailers should be compared by business model. We do not believe that one can throw all retailers together and identify the “most improved” or “best” supply chain. There are too many variables and circumstances affecting the retail landscape to make valid comparisons. In our research, we find that small and well-defined peer groups offer the best way forward for understanding both segment and industry specific trends.
The industry segments analyzed in this report are grocery, mass and specialty. Grocery retailers are involved in the sale of perishable and non-perishable food stuffs. Mass retailers are larger companies focused on providing a comprehensive retail experience to their customers. Finally, specialty retailers are dedicated to specific customers, activities and goods. The companies in this analysis represent both American and global retailers.
Our grocery peer group consists of Carrefour, Delhaize Group, Safeway and The Kroger Co. The mass retailer peer group includes Costco, Metro, Target and Walmart. The choice of specialty retailers was by far the most difficult because there are so many dedicated stores in this category. For this publication, our peer group includes Bed Bath & Beyond, Dick’s Sporting Goods, Foot Locker and Ross Stores. Additional information about all of these companies is presented in the Appendix.
Executive Summary
The term ‘supply chain finance’ has different definitions on each continent. In Europe, it is often used to describe ‘tax efficiency’, or the design of the supply chain to reduce the burden of taxation of cross-border shipments. In many procurement organizations the term is often used to describe the use of favorable capital rates to finance downstream trade. In this study the focus is on the management of costs by either effectiveness of a Supply Chain Finance team or Supply Chain Center of Excellence, Sales and Operations Planning (S&OP) processes, Cost-to-Serve Analysis and Supplier Development efforts.
For the supply chain leader, managing costs is job one. It is easier said than done. The supply chain is a complex system with interrelationships between growth, inventory, cost and complexity. Cross-functional processes, organizational focus, and access to data are critical to align and maintain cost effectiveness in this complex system called supply chain. We term this model the Supply Chain Effective Frontier. This is shown in Figure 2. When companies operate on the Supply Chain Effective Frontier they maximize the value of the firm . We measure value by either Price to Tangible Book Value or Market Capitalization.
Figure 2. Supply Chain Effective Frontier
As will be shown in this report, managing costs is a struggle for most companies. While 88% of companies have implemented Enterprise Resource Planning (ERP), the hard work of process evolution and maturity continues. In this report we share the current state of supply chains in managing costs, and then take a look at the processes and organizational design factors to evaluate the impact on cost management.
Supply Chain Metrics That Matter: A Focus on the High-Tech Industry - 2016Lora Cecere
Executive Overview
High-Tech supply chains serve global markets with regional preferences. They include some of the most advanced processes and strongest supply chain leadership across all industries. As a result, the value chain made more progress than others in the course of the last decade.
Unlike other value chains, all four segments of this value chain improved inventory turns. It was through hard work, network design, and a focus on planning. While other industries implemented supply chain planning and then turned to spreadsheets, this industry got good at managing inventories. The stakes were higher. As inventories sit in the channel for the High-Tech industry, prices fall. As a result, this industry has developed some of the best inventory practices across all industries.
On the flip-side, the lack of growth and the declining margins of the Contract Manufacturing industry is a risk for this value chain. Within the High-Tech value chain, Contract Manufacturing is the weak link.
The industry will drive the autonomous supply chain. These leaders will make the digital pivot first. With some of the earliest technology adopters, and with more to gain from the adoption of technology, look for companies like Apple, Cisco, Dell, EMC, Emerson, Intel, and Samsung to drive cloud-based computing, cognitive computing, the Internet of Things (IoT), sensor development, and prescriptive analytics. The industry is also driving a shift through wide adoption and use of Open Source code from the Apache Software Foundation. These manufacturing leaders will pave the way for others. Their ability to lead will drive cross-industry demand and growth agendas.
We hope that this report is a useful guide for companies in other industries to understand the impact of technology adoption on supply chain excellence.
Executive Summary
Supply chain management it is now three decades old. The processes are maturing. With the increase in complexity in markets and new product launch, supply chain excellence matters more than ever.
Manufacturing and distribution companies are looking for insights on how to parlay advances in supply chain management into balance sheet results. This is the goal of this report.
This report is a summary of research conducted during 2015. It provides a short summary of the major insights gathered from six quantitative and four qualitative studies. For more in-depth analysis reference the full reports outlined in the appendix.
Supply Chain Metrics That Matter - A Focus on Pharmaceutical Companies - 27 A...Lora Cecere
Executive Overview
When we compiled the Supply Chains to Admire Report in August 2014, no pharmaceutical company made the list. To make the list, a company had to deliver performance (above average results for the period of 2009-2013 than their peer group on a portfolio of metrics including operating margin, inventory turns and Return on Invested Capital) and drive supply chain improvement (based on the Supply Chain Index) faster than their peer group. We believe both performance and improvement matter.
In the pharmaceutical industry, we find most companies to be stuck. They have either regressed in supply chain performance or they are at the same point as they were a decade ago. For many supply chain leaders that attend conferences, this may seem unfathomable. There is an industry belief that companies have implemented new technologies, and evolved processes, and driven improved balance sheet results.
As we will show in this report, as seen in Figure 4, this is not necessarily the case. On average, AstraZeneca has outperformed Bristol-Myers Squibb, and the industry as a whole, but they are not resilient. They have gone backwards in margin and not sustained inventory turn improvements. In contrast, Bristol-Meyers Squibb has not made progress in either performance or improvement and has remained at the same level of performance, without improvement, throughout the period.
Supply Chain Metrics That Matter: Semiconductors and Hard Disk Drives - 18 FE...Lora Cecere
Executive Overview
Supply chain leaders struggle to align corporate and supply chain strategy and drive improved performance. We term this difficult balancing act The Effective Frontier and explain it as the process of balancing growth, profitability, cycle and complexity within a company’s supply chain operations.
A supply chain is a complex system with increasing complexity. A major gap in many supply chain strategies is a nuanced understanding of supply chain potential when these elements are viewed together as a system.
The focus of this report is semiconductor and hard disk drive manufacturers. As seen in table 1, when it comes to supply chain performance, the industry is neither the best nor the worst. They fall squarely in the middle. While middle of the pack in operating margin, the industry has shown an increase in the cash-to-cash cycle and a decrease in inventory turns. With increasing complexity, the industry has struggled to maintain inventory turn performance over the period.
Companies further back in the supply chain have struggled to a higher degree to balance The Effective Frontier than those closer to usage. This is largely due to the bullwhip effect—the distortion of a demand signal as it gets passed downstream from trading partner to trading partner. The chemical industry manufacturers, like semiconductor & hard disk drive manufacturers, are three to five levels back in the supply chain. Comparing the results in table 1 for the two industries illustrates how much better the semiconductor & hard disk drive manufacturers have done in a similar orientation. Operating margin is comparable across the two, but the chemical industry has a higher cash-to-cash cycle level and almost a 50% lower inventory turns value.
Semiconductor and hard disk drive manufacturers have been successful in a challenging downstream position. Cost pressure from OEMS has not (as of yet) cut into margin, and growth levels have remained strong with the move to mobile. Inventory remains problematic with all six companies in this report, demonstrating increased DOI and decreased inventory turns, since the start of the century. Part of this is likely due to the lengthening of the global supply chain, while another part is partly due to rising product and process complexity, but it remains a concern.
Historically, the industry has made strong gains on productivity. An increasing move towards automation in the precision driven manufacturing environment is expected to continue the rise in revenue per employee performance.
In this report, we discuss the financial realities of the semiconductor and hard disk drive supply chain and offer recommendations for improvement.
Inventory Optimization in a Market-Driven World - 27 APR 2015Lora Cecere
Executive Overview
Growth is slowing and the complexity in today’s supply chain is unprecedented. As a result, within a company, inventory management is often a hot issue. Shrinking inventory spins off a one-time, and highly desirable, cash windfall. In most industries there is a connection between market capitalization and inventory management. This drives pressure to reduce inventory and question existing practices. However, while companies are quick to ask questions, they often make the wrong judgements about inventory strategies. The goal of this report is to improve this dialogue.
Most companies have invested in many inventory optimization solutions over the last decade. Within the company, there is mounting frustration about the failure of these projects to actualize and maintain targets. What most companies fail to realize is that the technology strategy needs to be worked in concert with supply chain strategy. Often we find while companies improve inventory levels through the deployment of inventory technologies, operational decisions to widen the item master or lengthen the supply chain will undermine the project targets.
There are many drivers of inventory, and the management of inventory levels requires discipline and a cross-functional focus. It is a story of people, process, and technology. Let’s start with people. Today, fewer than 5% of companies have an end-to-end focus (as defined from the customer’s customer to the supplier’s supplier), and most companies lack alignment and balance. The largest gaps between are between operational and commercial groups. (Cecere L. , Three Techniques to Improve Organizational Alignment, 2013). As companies close the organizational gap, progress is made on inventory. Likewise, when it comes to balance, 68% of organizations surveyed lack balance in Sales and Operations Planning between the commercial groups (the “S”) and the operational groups (the “OP), When balance is achieved, the organization rates itself as more agile, and aligned, and there is an 11% improvement in inventory turns (Cecere L. , Research in Review, 2014).
Supply chain processes are now over 30-years old. While there is a generalized belief that maturity of supply chain processes has improved inventory turns, as can be seen in Figure 2, the improvements in cash-to-cash have primarily been driven by lengthening payables. In industries like beverage, pharmaceuticals, consumer packaged goods and medical device, the industry averages have gone backwards (inventory turns have decreased not increased). Only the food and apparel industries have posted double-digit improvements in inventory turns. Why? Food and apparel are largely regional supply chains which are maturing. They lag consumer packaged goods in supply chain maturity. While consumer packaged goods companies are more mature, they are more global. The rise of the global multinational has greatly impacted inventory requirements.
Supply Chain Metrics That Matter: A Critical Look at Operating Margin -10 DEC...Lora Cecere
Executive Overview
If a supply chain leader cannot demonstrate improvement in operating margin, they are often fired. Consequences are severe. However, as complexity in global supply chains has increased, it has become increasingly difficult to improve profitability metrics. Among supply chain leaders, operating margin is one of the preferred measures of profitability.
Successful supply chain management is about balance and particularly the balancing of growth, profitability, cycle and complexity. This is what we call The Effective Frontier. Supply chain management is getting tougher as commodity markets get more volatile, wage prices increase, and product life cycles shorten. It is up to the supply chain leader to design the network and processes to protect margin and balance the supply chain. This is becoming an increasingly difficult task.
The challenges are many and they vary by industry. Commodity pressure is higher than at any previous point in time as shown in Figure 2. There is a limited toolkit for how to offset margin pressure. They include better planning, transportation optimization, rethinking network design, improved Sales & Operations (S&OP) execution, and Kanban events with suppliers and customers. None are easy or quick fixes.
Additionally, while many think that calculating cost and monitoring profitability should be easy, this is not true. In our research, we find that only 24% of companies surveyed can easily access total supply chain cost information. The ability to get to the data and connect the dots on cost to operating margin performance remains difficult for most. In fact, as shown in Figure 3, for 53% of survey respondents, getting to total supply chain cost is difficult.
Operating margin is a straightforward calculation with serious implications. Of the ten industries profiled in Table 1, only two have increased operating margin over the period: consumer electronics and consumer packaged goods. Furthermore, of the 18 companies profiled individually in this report, less than 40% (7/18 = 39%) have made progress on margin in 2012 compared to their result in 2000. As shown in Table 1, it is becoming more and more difficult for companies to maintain balance on their portfolio of supply chain metrics. This trend is true across all industry subgroups.
Companies with the highest operating margin tend to be the least mature in their understanding of supply chain principles. As a result, they demonstrate the worst performance in balancing competing priorities on the Supply Chain Effective Frontier and are stuck on the Supply Chain Plateau. The positions of companies, and their relative successes over the last decade, are shown in figure 4.
Table 1 is sorted by average operating margin with pharmaceutical companies returning the highest average value at 0.25 over the period. With the patent cliff, and significant changes in the healthcare environment including ongoing implementation of the Affordable Care Act, ...
Putting Together the Pieces - A Guide to S&OP Technology Selection- 20 AUGUST...Lora Cecere
This report is the third in a three-part series. First we define a market-driven value network, then we apply these concepts to the Sales and Operations Planning process, and finally, we discuss the purchase of technology to enable this vision. Here are links to the reports:
• Building Market-driven Value Networks
• Market-driven Sales and Operations Planning
• Putting Together the Pieces
This report is based on nine years of observations of the Sales and Operations Software market’s evolution. It is built on the premise that the best research is based on year-over-year studies and ongoing market triangulation.
Supply Chain Metrics That Matter: A Closer Look at the Cash-To-Cash Cycle (20...Lora Cecere
Executive Overview
When it comes to metrics that matter, the cash-to-cash cycle is one of the top metrics cited by supply chain professionals. It is among the best financial metrics to provide a comprehensive picture of a company’s supply chain and the management of working capital.
The supply chain is a complex system. Successful management requires both orchestration and balance. To drive supply chain excellence, companies are required to balance four competing priorities: growth, profitability, cycle management and complexity. Several popular metrics, including the cash-to-cash cycle, for a variety of industries are presented in table 1.
2016 Supply Chains to Admire - Report - 26 July 2016Lora Cecere
Executive Summary
Supply chain excellence is easier to say than define. To make progress, companies need to clearly define the journey and the goals. For many this is problematic. The goals are unclear and the financial metrics are not well-understood. We want to provide research to help supply chain leaders correct these issues.
Supply chain leaders want to improve results to drive shareholder value, but there is a problem. There is no industry standard definition of supply chain excellence or clarity on the how actions of the supply chain team drive shareholder value. In this report we try to help fill in the gaps by giving definitions to both.
The Supply Chains to Admire analysis is now in its third year. It is a deep analysis of performance, improvement, and Price to Tangible Book Value (PTBV) of 320 companies across 31 industries for the period of 2009-2015. The source data for the analysis is public reporting of balance sheets and income statements. (Our source of balance sheet and income statement data is YCharts .)
Conquering the Supply Chain Effective FrontierLora Cecere
Conquering the Supply Chain Effective Frontier - A Handbook for the Value Chain Leader to Manage Trade-offs in Defining Supply Chain Excellence
Supply chain practices are nearing their third decade of maturation. The term supply chain excellence is bandied about by leaders, consultants and technology providers, but there is no alignment on what it means.
Conventional systems of measurement for supply chain excellence are problematic. In this report, we share insights gained during interviews with 75 supply chain pioneers. Based on their feedback we created a new framework, that we define here as the Supply Chain Effective Frontier, for supply chain leaders to use to determine supply chain excellence. This methodology is based on publicly available financial balance sheet data grouped into four sets of supply chain ratios: growth, profitability, cycle, and complexity.
We believe that supply chain excellence is best defined as the alignment of the supply chain team to deliver results to meet and exceed the requirements of the business strategy. This requires a clear vision and cross-functional coordination and alignment over a multi-year road map. It needs to be holistic. A supply chain is a complex system with increasing business complexity. The analysis needs to facilitate a clear understanding of trade-offs embedded in day-to-day decision making. It is this clarity that we find missing in many teams that we work with, and it is for this reason we wrote this report.
Market-driven S&OP Report - 16 July 2012Lora Cecere
A Guidebook on How to Build a Market-driven S&OP Process
For manufacturers and retailers, supply chain is business. The Sales and Operations Planning (S&OP) process aligns the organization to the business strategy. As companies have become more global and face rising complexity, volatility and uncertainty, the importance of S&OP has increased. However, business complexity has created a gap between what companies have and what is needed. From our research, here we cite examples of these gaps:
Business Guide for Supply Chain Leaders for S&OP in the PandemicLora Cecere
The return on investment for S&OP excellence in normal times is seven months, in the pandemic excellence in S&OP matters more than ever. Here we share a business guide for supply chain leaders to drive value and eliminate the pitfalls and potholes of S&OP evolution.
How to Add Agility and Customer Focus to the Healthcare Supply ChainUPS Longitudes
The global pharmaceutical and healthcare industry has
experienced a number of severe shocks to the system in
recent decades. What was once a sector where profits flowed
from ‘blockbuster’ drugs and a customer base willing to
pay premium prices has transformed into a quite different
world as a consequence of competition from generics along
with reduced budgets available to healthcare providers.
Compounding these problems are increasing regulatory
constraints and more challenging logistics requirements as
bio-pharmaceuticals and related products increase the need
for stricter control of temperature and shelf-life as they move
through the supply chain.
As a result there is now a significantly greater focus across
the sector on supply chain management. Previously, when
margins were higher and logistics costs were a relatively
small proportion of total costs, supply chain issues tended
to take a back seat. Now things have changed. Recent
research by UPS® has highlighted that many companies are
finding it difficult to develop supply chain capabilities that
can simultaneously take out costs whilst ensuring regulatory
compliance, track and trace, product security and stricter
temperature and shelf-life control.
Because of these pressures, a new approach to the design
and management of supply/demand networks in the industry
becomes imperative. In today’s marketplace, there is a need
for supply chains that are cost-effective, efficient and agile.
Companies operating in every industrial sector and in
every market around the world have been confronted in
recent years with significant challenges. These challenges
have come from numerous sources – economic recession,
demographic changes, geo-political upheavals to name but
a few. The healthcare and pharmaceutical industry has been
no exception and has been impacted by major changes in the
competitive and market environment.
Packaging Artwork: An Important Value Chain Process-17 SEP 2012Lora Cecere
The original goal of consumer packaging artwork management was defined to support new product launch and accelerate cost reduction opportunities within the organization. This process has become more complex. Most companies understand that it has become more complex and unwieldy, but they don’t know what to do. There are three drivers:
Supply Chain Metrics That Matter – A Focus on Auto Parts Companies 19 SEP 2017Lora Cecere
Report Details: This report is based on analysis of financial balance sheet and income statement data within the Automotive Parts industry, for the period of 2004-2016. The data is collected from YCharts.
Objective: To use the financial balance sheet and income statement data to better understand the state of the Automotive Parts industry supply chains and to determine which companies’ supply chains did the best on the delivery of a portfolio of metrics over the last 13 years.
Highlight: As the technology for automotive vehicles continues to evolve, it will become more paramount than ever for Auto Parts companies to become more demand-driven in their supply chain planning processes. Companies across the board saw their revenue drop significantly during the 2004-2016 period. Those who redefined their manufacturing and distribution processes, drove strong balance sheet results. Others learned that doing traditional retail more efficiently was not enough. As a result only one company, Autoliv Inc, made the list of Supply Chains to Admire Winners.
Supply Chain Metrics That Matter-A Focus on Semiconductor CompaniesLora Cecere
In this report, we share insights on 31 companies in the Semiconductor industry. This industry is the primary raw material provider and driver of innovation in the technology value network. Within the industry, there are three primary shifts defining the market:
1) Advanced analytics are pushing advancement in semiconductor manufacturing
2) New mobility trends are diversifying demand for automotive semiconductors
3) Security issues represent the greatest obstacle to growth of the Internet of Things, and semiconductor companies are helping address the issue
Within the technology value network, the story is survival. Price compression, technology advancement, and short product life cycles transformed supply chains. Most scrambled to keep up.
Due to the degree of change, some of the most advanced supply chain practices within any industry are in the technology value network. Despite the scramble to drive change and improve value, year-over-year change in this maturing value chain is a sea of red. In Table 1, the top number within each cell represents the average during the 2010 through 2016 time period, and the bottom number represents the percentage change in 2016 as compared to the value in 2010. So, the average growth in the Semiconductor industry was 14%, but the net change comparing the growth of 2010 to 2016 was a sharp decline of 23%.
Supply Chain Metrics That Matter: A Focus on Brick & Mortar Retail-18 FEB 2013Lora Cecere
The bricks and mortar retailer is being squeezed. Growth is slowing and margin is under pressure. With the rise of e-commerce, the role of the store is being redefined. It is about service and the customer experience. As a result, it is time to rethink the metrics that matter and focus outside-in on the shopper experience.
In this report, we share insights on the current state of bricks and mortar retail and offer our suggestions.
Brick & mortar retailers have weathered an intense decade with the persistent rise of e-commerce. The shopper has changed and recovery from the Great Recession is ongoing, but slow. Our previous Supply Chain Metrics That Matter: A Focus on Retail report focused on the broader industry trends affecting five different divisions of retailers and the challenges of multi-channel retail. This report narrows the focus to three segments of brick & mortar retailers struggling to adapt to the new world.
A retailer is not a retailer. We believe that retailers should be compared by business model. We do not believe that one can throw all retailers together and identify the “most improved” or “best” supply chain. There are too many variables and circumstances affecting the retail landscape to make valid comparisons. In our research, we find that small and well-defined peer groups offer the best way forward for understanding both segment and industry specific trends.
The industry segments analyzed in this report are grocery, mass and specialty. Grocery retailers are involved in the sale of perishable and non-perishable food stuffs. Mass retailers are larger companies focused on providing a comprehensive retail experience to their customers. Finally, specialty retailers are dedicated to specific customers, activities and goods. The companies in this analysis represent both American and global retailers.
Our grocery peer group consists of Carrefour, Delhaize Group, Safeway and The Kroger Co. The mass retailer peer group includes Costco, Metro, Target and Walmart. The choice of specialty retailers was by far the most difficult because there are so many dedicated stores in this category. For this publication, our peer group includes Bed Bath & Beyond, Dick’s Sporting Goods, Foot Locker and Ross Stores. Additional information about all of these companies is presented in the Appendix.
Executive Summary
The term ‘supply chain finance’ has different definitions on each continent. In Europe, it is often used to describe ‘tax efficiency’, or the design of the supply chain to reduce the burden of taxation of cross-border shipments. In many procurement organizations the term is often used to describe the use of favorable capital rates to finance downstream trade. In this study the focus is on the management of costs by either effectiveness of a Supply Chain Finance team or Supply Chain Center of Excellence, Sales and Operations Planning (S&OP) processes, Cost-to-Serve Analysis and Supplier Development efforts.
For the supply chain leader, managing costs is job one. It is easier said than done. The supply chain is a complex system with interrelationships between growth, inventory, cost and complexity. Cross-functional processes, organizational focus, and access to data are critical to align and maintain cost effectiveness in this complex system called supply chain. We term this model the Supply Chain Effective Frontier. This is shown in Figure 2. When companies operate on the Supply Chain Effective Frontier they maximize the value of the firm . We measure value by either Price to Tangible Book Value or Market Capitalization.
Figure 2. Supply Chain Effective Frontier
As will be shown in this report, managing costs is a struggle for most companies. While 88% of companies have implemented Enterprise Resource Planning (ERP), the hard work of process evolution and maturity continues. In this report we share the current state of supply chains in managing costs, and then take a look at the processes and organizational design factors to evaluate the impact on cost management.
Supply Chain Metrics That Matter: A Focus on the High-Tech Industry - 2016Lora Cecere
Executive Overview
High-Tech supply chains serve global markets with regional preferences. They include some of the most advanced processes and strongest supply chain leadership across all industries. As a result, the value chain made more progress than others in the course of the last decade.
Unlike other value chains, all four segments of this value chain improved inventory turns. It was through hard work, network design, and a focus on planning. While other industries implemented supply chain planning and then turned to spreadsheets, this industry got good at managing inventories. The stakes were higher. As inventories sit in the channel for the High-Tech industry, prices fall. As a result, this industry has developed some of the best inventory practices across all industries.
On the flip-side, the lack of growth and the declining margins of the Contract Manufacturing industry is a risk for this value chain. Within the High-Tech value chain, Contract Manufacturing is the weak link.
The industry will drive the autonomous supply chain. These leaders will make the digital pivot first. With some of the earliest technology adopters, and with more to gain from the adoption of technology, look for companies like Apple, Cisco, Dell, EMC, Emerson, Intel, and Samsung to drive cloud-based computing, cognitive computing, the Internet of Things (IoT), sensor development, and prescriptive analytics. The industry is also driving a shift through wide adoption and use of Open Source code from the Apache Software Foundation. These manufacturing leaders will pave the way for others. Their ability to lead will drive cross-industry demand and growth agendas.
We hope that this report is a useful guide for companies in other industries to understand the impact of technology adoption on supply chain excellence.
Conquering the Supply Chain Effective Frontier - 27 NOV 2017 - ReportLora Cecere
Executive Overview
Over the course of the last decade, retailers made more progress on costs and inventory turns than manufacturers. In the rush for technology adoption, we commonly find companies overstating what is possible because they are not clear on the historical trends, and often mistakenly coached to overcommit by industry consultants to justify technology investments.
In studying supply chain metrics, we find that each industry has a definitive pattern. Few are linear. To set reasonable goals, the definitions need to be very industry specific. That is the goal of this report.
In developing supply chain strategy, one of the first objectives is defining what is possible. This involves delineating the metrics, establishing reasonable targets, and rates of improvement. In the review of strategy documents for clients, we find that most companies are not clear on any of these critical sets of assumptions. This report is designed to help. We start with the definition of metrics and then share industry progress for the period of 2006-2016. This report ends with recommendations and conclusions.
• Report Details: This report is based on the analysis of orbit chart charts showing year-over-year supply chain performance at the intersection of operating margin and inventory turns for twenty industries for the period of 2006-2016. The goal is to help supply chain leaders to understand what is possible.
• Objective: As supply chain leaders attempt to define supply chain excellence, they need guidance on industry supply chain performance and overall trends for benchmarking. The goal is to help supply chain leaders make better decisions.
• Hypothesis: Each industry is unique and a good supply chain has different characteristics based upon the specific industry it is in, the product it creates and the customers it serves. Our aim is to help supply chain leaders understand relative industry performance. As shown in this report, each individual industry is charting a unique path on supply chain performance.
Orchestrating a Supply Chain Competitive EdgeCognizant
An effective supply chain is the key to creating business value. This paper will help you benchmark your performance today and take a methodical organizational approach to improving your supply chain effectiveness.
Supply Chain Metrics That Matter: A Focus on Pharmaceutical Companies - 2016Lora Cecere
Supply Chain Metrics That Matter: A Focus on Pharmaceutical Companies – 2016
2006-2015
This report is based on analysis of financial balance sheet data and income statements for the pharmaceutical industry over the period of 2006-2015. (Data is sourced from YCharts). The report reflects insights from the pre- and post-recession periods and compares the progress of companies within the peer group(s).
RESEARCH OVERVIEW:
Report Details: This report is based on analysis of financial balance sheet and income statement data within the pharmaceutical industry, for the period of 2006-2015. The data is collected from YCharts.
Objective: To use financial balance sheet and income statement data to better understand the state of pharmaceutical supply chains and to determine which Pharmaceutical company’s supply chain did the best on the delivery of a portfolio of metrics over the last decade.
Hypothesis: The supply chain within the pharmaceutical industry is increasing in importance to deliver on the objectives of quality, drug efficacy and reliability. Risk mitigation, and counterfeiting are important cornerstones for the end-to-end supply chain vision.
Supply Chain Metrics That Matter: A Focus on Medical Device Companies – 2016Lora Cecere
Executive Overview
Globalization. Compliance. Risk Management. Corporate Social Responsibility (CSR). Patient outcomes. Over the last decade the number and variety of supply chain initiatives exploded for the medical device leader. As a result, the supply chain group, and the related business imperatives, grew in importance.
Overall the medical device supply chain fared better through the decade than other industries, despite the fact that they are smaller, more focused companies trying to become global. (see Table C in the appendix for company size). On average the industry performance on operating margin and inventory turns was better in 2006 than 2015. The reason? The medical device supply chain entered the decade as a supply chain laggard. Through focused supply chain programs they were able to catch up to the level of other industries.
Table 6. Industry Snapshot of Performance
We hope this report can be a guide to help companies understand what is possible, and how supply chain metrics drive value. In the medical device industry we find most companies to be stuck. They have either regressed in supply chain performance or they are at the same point they were a decade ago. For many supply chain leaders that attend conferences, this may seem unfathomable. There is an industry belief that companies have implemented new technologies, and evolved processes, and driven improved balance sheet results. The goal of this report is to enable benchmarking and to spark a new conversation on the definition of supply chain excellence.
Supply Chain Metrics That Matter: A Focus on the Retail Industry - 16 FEB 2017Lora Cecere
Report Details: This report is based on analysis of financial balance sheet and income statement data within the Retail industry, for the period of 2006-2015. The data is collected from YCharts.
Objective: To use financial balance sheet and income statement data to better understand the state of Grocery Retailers' and Mass Merchants' supply chains and to determine which companies’ supply chains did the best on the delivery of a portfolio of metrics over the last decade.
Highlight: During the Great Recession retailers faced strong declines in spending. It was a critical time, but for many it was an opportunity to emerge stronger. Those who redefined their stores for the dollar-conscious customer or built new and innovative formats while driving supply chain innovation, drove strong balance sheet results. Others learned that doing traditional retail more efficiently was not enough.
Supply Chain Metrics That Matter: A Focus on Food and Beverage Companies - 15...Lora Cecere
Executive Overview
Food and Beverage supply chains serve local markets. Regional taste buds drive localized assortment. While many are attempting to be global, they have strong regional governance drivers. As a result, growth agendas have driven an increase in items by 32% since 2010. Product complexity grew faster than growth. Average sales per item dropped 22% . This increase in complexity lengthened the long tail of the supply chain affecting both cost and inventory.
We hope this report can be a guide to help companies understand what is possible to determine more accurate set points, and understand the relationship between supply chain metric performance and value.
As will be seen, in the Food and Beverage industries we find most companies to be stuck on the critical metrics that drive value. They have either regressed in supply chain performance or they are at the same point they were a decade ago. For many supply chain leaders who attend conferences this may seem unfathomable. There is an industry belief that companies have implemented new technologies, and evolved processes, and driven improved balance sheet results. As will be shown in this report, this is not true.
The analysis also demonstrates the importance of outside-in supply chain excellence programs. Who does the best? Hershey outperforms within the Food group and makes the Supply Chains to Admire list for 2016; and while AB/InBev drives the strongest performance in the Beverage category, it is not sufficient to make the list. The goal of this report is to enable benchmarking and to spark a new conversation on value in the definition of supply chain excellence.
When it comes to sustainability reporting, companies may feel like they’re in an increasingly uncomfortable public-private vice. On one side, consumers and shareholders are pressuring organizations to be better corporate citizens and increase transparency. Governments are establishing more reporting requirements as well, which will inevitably multiply through initiatives such as the recent Sustainable Innovation Forum at COP21.
No matter how you look at it, the call for climate action is coming
in surround sound. Integrated reporting is becoming more and
more mainstream.
The good news is that sustainability programs and reporting can
boost consumer confidence, shareholder esteem — and a company’s bottom line.
EFFECTS OF SUPPLIER EFFECTIVENESS ON ORGANIZATION PERFORMANCE AT KENYA SEED C...paperpublications3
Abstract:Achieving competitive advantage in this competitive business environment is a challenge many managers face. Most organizations are faced with the delays in product delivery, ability of suppliers to concert their operating environment to create value. The supplier ineffectiveness, which affects organizational performance, which is as a result of reluctance to develop suppliers, build relations, and establish quality management and failure to use strategies which make suppliers a competitive advantage tool is a challenge. Even the process of developing suppliers, selection and retention has not helped either. The study was carried out to establish the effect of supplier effectiveness on organizational performance at Kenya Seed Company, Kitale. The main objectives which guided the research included: to establish the effects of Supplier agility on organizational performance; to investigate the process visibility on organizational performance; to find out the effect of supplier willingness on organizational performance and to determine effect of supplier capabilities on organizational performance. To explore these, a cross sectional study design was used. The target population was 360 from which 190 sample size was deduced for the study. Data was collected using focused group discussions and small groups discussions self-administered questionnaires, interview guides and content analysis to investigate the effect of supplier effectiveness on organizational performance. Findings showed that supplier effectiveness has significant positive and negative effects on performance. It was found that all the four components of supplier effectiveness influence the three dimensions of performance. The study also found out that where supplier effectiveness is high, the performance on organization is also higher, especially in areas that are affected by suppliers even though they may be internal to the buyer organization. It was therefore concluded that supplier effectiveness is an essential strategic tool for performance improvement. Hence organizations need to build relations that enhance supplier effectiveness so that performance of both the suppliers and buyer organizations can realize the benefits of this relationship in the supply chain network.
Supply Chain Metrics That Matter: A Focus on the High-Tech Industry - 2015Lora Cecere
Executive Summary: Current State of the High-Tech Industry
Globalization. Commodity inflation. Margin squeeze. Economic uncertainty. Warranty issues. Shortening product life cycles. Recalls. Labor arbitrage and outsourcing. The list of market pressures could go on and on, but one thing is clear: the high-tech industry was redefined over the course of the last decade. In Table 4 we show the progress of discrete industries for the periods of 2006-2014 and 2011- 2014. Notice there is more red (lack of progress) than green (progress) in the industry trends.
Table 4. Supply Chain Performance by Industry within the Discrete Industries
High-tech companies have the most advanced practices for inventory management, planning and analytics. They are just treading water (keeping slightly ahead of the market dynamics). The rate of change drives innovation. Within this industry there are more supply chain innovators taking a hard look and driving the adoption of prescriptive analytics and canonical value network infrastructures.
Taking a closer view at the value chain of the sub-industries within high-tech, i.e. consumer electronics, B2B Electronics, and semiconductor industries, the impact of the industry drivers and the importance of supply chain performance becomes clearer.
Table 5. Supply Chain Performance by Industry within the High-Tech Sector
The entire value chain is struggling to maintain margins and improve inventory turns. For consumer electronics and B2B electronics, growth is down, operating margins are degrading and inventory turns worsening. Supply chain matters more than ever.
2015 MHI Annual Industry Report – Supply chain innovation – Making the imposs...Leon Eymael
This year’s annual MHI Industry Report, developed in collaboration with Deloitte, delves more deeply into supply chain challenges with a specific lens on how technology innovation can help illuminate the path to the supply chain of the future.
Margin Performance Report - Exploring how companies can beat market expectationsCaroline Burns
In an environment characterized by uncertainty and global competition, margins are threatened like never before and cost optimization is running out of steam. How does margin relate to performance and how can margin be managed strategically?
Dr. Patrick Reinmoeller
Professor of Strategic Management
Cranfield School of Management
Cranfield University
Supply Chain Metrics That Matter: Driving Reliability in Margins - 6 JAN 2013Lora Cecere
Supply chain management practices are thirty years old. Over the last decade, companies have invested in technology projects to improve financial outcomes (Technology investments over this period have averaged 1.7% of revenue). The ultimate goal was to reduce costs and improve inventory management. While many supply chain leaders believe that they delivered on these metrics, we find a less persuasive story. Through analysis of publically available balance sheet and income statement data, we find that 75% of companies in process industries lost ground on margins and only 5% of companies improved their positions on the number of days of inventory. The goal of this report is to answer the question “Why?” (For more on inventory and the Cash-to-Cash Cycle, see Supply Chain Metrics That Matter: The Cash-to-Cash Cycle.)
To begin our analysis, we wanted to understand the general trends. In table 1, we share the differences in average values for the companies profiled in this report by industry for the period of 2000-2011. In general, we see a decline in operating margins (OM). There is an increase in selling, general & administrative Costs (SG&A) and revenue per employee performance. The industries have mixed results on return on assets (ROA).
1. Executive Summary
Accounting for an incredible 60 to 90% of overall expenses, supply chain costs can
be a significant lever for driving bottom-line performance. In fact, it’s estimated that
a 5% reduction in supply chain spending can increase net income by over 40%. Yet,
without a well-run supply chain, costs will rise and a business will fail to respond to
customer demands, let alone market uncertainties. In contrast, enhancing supply chain
performance can help find new sources of revenue more effectively, greatly improve
financial results, and reinforce fiscal stability by reducing costs, increasing working
capital, and strengthening customer loyalty.
But improving a company’s supply chain operations is a complex process, with
many challenges. Globalization of markets, though it opens up opportunities in both
production and distribution, also exponentially increases complexity – not to mention
susceptibility to disruptions due to manmade or natural disasters or political unrest.
In the face of such uncertainty, companies wanting to succeed need both visibility
across the supply chain and insight into performance. Metrics can both provide greater
visibility and drive insight into opportunities and risks, though it can be difficult to
choose the most effective metrics, not to mention selecting the best model for tracking
multiple and interacting metrics. Metric frameworks help standardize definitions and
facilitate benchmarking, yet real differentiation and process improvements come from
how a company monitors, interprets, and uses metrics to drive tactical and strategic
decision making. While many models to track metrics exist, the Supply Chain Operations
Reference (SCOR®
) model is one of the most widely recognized. SCOR provides a unique
structure designed to align a critical web of business processes, metrics, best practices,
and technology.
Establishing the right metrics framework as part of an overall performance management
strategy means companies can break down enterprise-level goals – such as order
fulfillment, forecast accuracy, and material costs – into department-level metrics such
as on-time delivery, plant utilization, and order processing time. Providing robust
visualizations, business analytics further translate metrics data into powerful business
insight. This helps increase visibility, drive accountability, and improve performance.
Companies such as DuPont have successfully used metrics and benchmarking to drive
ongoing supply chain improvements. The SCOR model lets such companies focus on a
standardized set of metrics, making it easier to identify, communicate, and replicate the
most effective practices. The result for even the most complex organization: the ability
to better manage an ever-changing supply chain in a highly volatile world.
Metrics vs. Analytics
A performance management
strategy requires clear metrics and
powerful analytics.
Metrics quantify results and measure the
success of an organization’s programs,
operations, and investments. For example,
project metrics inform the organization
whether the project is on time, on budget,
and meeting goals. Supply chain metrics
define and quantify the performance of the
supply chain.
Analytics use statistical methods, analysis,
and modeling to develop new insights and
understandings of business performance
based on data, such as metrics and other
inputs. Analytics focus on predicting what
will happen next and then optimizing the
related business decision.
Driving Sustained Improvements with
Supply Chain Metrics and Analytics
2. 2
Increasing Supply Chain Complexity
and Risk
Globalization Creates Complexity and Opportunity
Whatever your business or your industry, it’s constantly affected by continued
globalization. New markets emerge and regional manufacturing influence shifts. Not so
long ago, for example, the BRIC nations were referred to as “emerging.” Today, all four
are top-10 world economies: Brazil is ranked ninth, Russia sixth, and India fourth. China,
currently the world’s second-largest economy, is predicted to pass the United States in
the next few years and become number one.The Economist Intelligence Unit forecasts
the real GDP in China and India will grow faster than any other country in the world.1
Market evolutions and increasing worldwide demand for products and services mean
that supply routes will remain complex and ever-changing.
1%
4%
7%
2%
5%
8%
3%
6%
9%
10%
China
India
Middle
East
ASEAN
Latin
America
Eastern
Europe
CIS
US
Euro
Zone
UK
Japan
Africa
Figure 1: 2010 Real GDP, Year on Year Percentage Change
Such shifts have led many companies to invest heavily in BRIC countries, as well as
emerging secondary markets such as Vietnam and Turkey. However, notes SAP®
supply
chain expert Richard Howells, “Emerging markets no longer constitute an automatic
‘low-cost producer.’ Labor disputes and wage-related strikes are pushing up wages in
many regions.”
Wage increases also have other effects. On the demand side, globalization continues
to lift incomes in developing countries – making them extremely desirable not just
as manufacturing hubs but also as new and hungry markets. A company planning to
establish manufacturing or distribution, find a contract supplier, or open a regional
sales office in an emerging market must be armed with effective strategies and tactics to
monitor costs and mitigate supply risks.
Addressing Risks from Supply Disruptions
A recent report by the insurance company Swiss Re estimates that, in 2010 alone,
economic losses across the globe resulting from natural and man-made disasters
totaled $222 billion, more than triple the numbers of 2009. This included losses from
earthquakes, forest fires, oil spills, volcanic eruptions, and extreme weather conditions.
1 The Economist Intelligence Unit, Global Forecasting Service, 2010.
3. 3
Add to the list flooding, tornados, and other effects of climate change, not to mention
political unrest. Any one of these events can send major sources of supply and
demand into turmoil. Consider the price and supply volatility of raw materials, fuel,
and commodities in the wake of a major natural disaster, and how much any one
element affects the others. Howells elaborates: “Natural disasters and extreme weather
have always been a part of life. However, in today’s global economy, the impact is
exaggerated by the interdependence of our global society. If one link in the supply chain
is broken, it can have a huge ripple effect.”
In short, the more we’re connected, the more disruption in any area broadcasts
its effects throughout the world economy. Take into account multiplying levels of
complexity, and it’s clear that companies destined to survive and thrive are those
that can react quickly and flexibly across the board. Whether facing economic,
environmental, supply, or demand changes, businesses are looking for solutions that
enable responsive planning, support collaboration, and mitigate risk across supply
chain networks.
Using Metrics to Drive Performance
To respond rapidly to disruptions, supply chain managers need both flexibility and
comprehensive visibility into supply chain performance. According to Rich Sherman, a
member of the founding team for Supply Chain Council (SCC) and Director at the Council
of Supply Chain Management Professionals (CSCMP), “Whether the economy is trending
up and growth and expansions are the norm – or down and cutbacks are needed –
organizations must be able to adapt the supply chain to support their objectives.”
Continues Sherman, “For organizations desiring this level of insight and flexibility,
supply chain analytics are critical.” One valuable analytical model is the Supply Chain
Operations Reference (SCOR) from SCC, an independent, nonprofit global corporation
working to advance the state of the art in supply chain management systems
and practices.
The SCOR Model
The SCOR model provides a unique framework that links business processes, metrics,
best practices, and technology into a unified structure designed to improve the
effectiveness of supply chain management. This includes collaborating with partners to
identify and implement supply chain improvements.
SCOR helps manage common problems through a standardized set of language, metrics,
and business practices that accelerate change and improve performance. Applying SCOR
streamlines communication while dramatically improving the overall effectiveness of
daily management and targeted improvement initiatives; gains are measured using the
organization’s SCORindex. “We’ve seen drastic improvements in companies that use
SCOR; [they] are consistent top performers in their industries,” says Sherman.
4. 4
Figure 2 shows how best-in-class companies using SCOR outperform their median
competitors with more than a 50% cost advantage in supply chain costs.2
$20
$80
$140
$40
$100
$160
$60
$120
$180
$81.32
Consumer
Products/
Packaged Goods
Parity (5oth Percentile)
Supply chain management costs per $1,000 revenue
Superior (9oth Percentile)
Electronics Industrial
Products
Petroleum/
Chemical
Retail and
Wholesale
Services
$22.86
$70.12
$29.48
$80.52
$168.11
$24.60
$24.58
$91.49
$23.98
$56.36
$9.75
Figure 2: Superior Supply Chain Management is a Source of Competitive Advantage
Organizations that use SCOR:
▸ Achieve consistent annual bottom-line improvements of 1–3%
▸ Reap significant cost savings and economic returns on SCOR-related investments
▸ Grow in aggregate share value two to three times faster than the Dow Jones and
S&P 500 indexes
Leveraging Supply Chain Performance
Management
Tracking metrics using a model such as SCOR is an important piece of an overall supply
chain performance management strategy. To drive supply chain value and effectiveness,
a company must align trading partners, service providers, employees, processes,
and systems with a common set of goals and objectives. According to Siddharth
Taparia, Senior Director of Business Analytics Solution Marketing at SAP, “Supply chain
performance management is especially useful as a guide to managing the inevitable
tradeoffs that occur in running a business in ways that support corporate objectives
while mitigating risk.”
Continues Taparia, “The SAP BusinessObjects™ Supply Chain Performance
Management application is based on the SCOR model and helps measurably improve
the effectiveness of supply chain operations. With it, companies can better deliver on
mandates such as lowering costs and improving return on working capital.”
2 American Productivity and Quality Center, SCORmark benchmarking database, www.apqc.org/scc.
Spotlight on DuPont
DuPont is a multinational products and
services company. In keeping with a
corporate culture that values building
internal competencies, it is now recognized
as a leader in supply chain performance,
with powerful results.
But a decade ago, DuPont’s values and
performance didn’t line up as well as its
leaders would like. In 2001, the company
recognized the need to embrace the
supply chain as a strategic driver. Since
then, it has focused on a range of factors
affecting its supply chain, and embarked
on a 10-year journey in which it recreated
and transformed its supply chain practices
and processes. Now, in 2011, DuPont uses
both SAP software and the SCOR model
to address supply chain challenges that
are dynamic and broad at the highest
levels, and tactical and transactional at the
lowest. The changes have been deep and
wide-ranging, with striking effects across
the business.
One of the company’s foremost supply chain
experts, Peter Murray, notes, “From the
start, we realized we had a long way to go.
We had poor data quality and our practices
weren’t effective, let alone standardized.
We lacked the knowledge and processes
to manage our end-to-end supply chain.
We needed a framework to pull all the
pieces together.”
DuPont, explains Murray, understood the
strategic value of the supply chain, but
lacked a strong organizing framework
to drive it. “So we began to look at the
SCOR model,” Murray explains. “As we
incorporated SCOR, we were able to identify
processes that we needed to fix. We were
also able to build out core business metrics
that tied to financial and operational goals.”
The road to supply chain excellence wasn’t
always smooth. The company started by
“playing around with a lot of metrics – too
many metrics,” admits Murray. The result?
“Before we knew it, we had metric overload
and nobody was looking at KPIs.”
5. 5
In addition to providing a more accurate measure of whether a company is meeting
its supply chain goals, the application can warn of potential bottlenecks, identify new
opportunities, and help evaluate tradeoffs. For example, it makes little sense to set an
objective of cutting supply chain costs by 6% if these same costs would have to increase
to meet the corporate objective of increasing market share. But simply shifting the
focus to revenue growth without regard to cost, risk, or strategic impact would also be
incomplete. For instance, raising the perfect order shipment goal from, say, 92% to 98%
would be counterproductive if the resulting higher product and shipping costs would be
prohibitive for customers.
In such complex scenarios, supply chain performance management makes it possible
for a company to make better, data-supported decisions about such important
tradeoffs – including using risk management to assess the potential financial and
operational impacts of decisions on KPIs. In alignment with the SCOR model, the
SAP BusinessObjects Supply Chain Performance Management application gives
organizations the complete support to:
▸ Provide full visibility into supply chain processes from start to finish, via a hierarchy of
more than 350 KPIs
▸ Show how each metric relates to and affects the others
▸ Use this information to respond proactively to both near-term potential disruptions
and long-term supply chain trends
Strategic Goals
Supply Chain
Effectiveness
Order Management
Cost
Outbound
Transportation Cost
Fuel
Cost
Invoices
Outstanding
Supply Chain
Management Cost
Perfect Order
Fulfillment
Material
Acquisition Cost
Finished Goods
Warehouse Cost
Express
Freight
Planning and
Finance Cost
Customer
Service Cost
Returns
Level 2 Metrics
Level 1 Metrics
Level 3 Metrics
Diagnostic Metrics
Figure 3: Metrics Hierarchy Example
Taparia goes on to explain, “With the right metrics architecture, an organization can
break down enterprise level goals – such as perfect-order fulfillment, forecast accuracy,
and supply chain costs – into department-level metrics such as on-time delivery by
suppliers, plant utilization, and order cycle time.” The metrics hierarchy also helps
identify key drivers and root causes of performance, such as fuel costs, express freight,
returns, and outstanding invoices.
The SAP BusinessObjects Supply Chain Performance Management application helps
each company identify and monitor the metrics that really matter for its particular
organization, as illustrated in Figure 3. The application’s prebuilt metrics architecture is
based on the SCOR model and other industry standards frameworks, yet remains flexible
enough to meet each organization’s individual requirements. In fact, SAP received the
Spotlight on DuPont, continued from page 4
The company also focused on benchmarking
as a way to determine what portfolio of
projects and initiatives were needed to either
improve performance of the supply chain or
make a step change in capability. Comparing
typical results from other companies helped
DuPont quantify and monetize the potential
of supply chain improvements, providing the
direction the company needed to pursue the
right set of initiatives. The results of inventory
and cash performance benchmarking
during the 2009 financial downturn firmly
established the value of the approach
for DuPont.
SCOR helped DuPont use what worked and
refine what didn’t, Murray notes, and the
refinements continue even after remarkable
improvement. “Our current focus is on
standardizing the way we implement supply
chain improvements across the company.
We want to drive improved performance and
more transparency, and standardizing on the
SCOR model is a big part of this thrust.”
DuPont learned a lot from its journey,
and continues to improve. Lessons
Murray considers essential to the
company’s success:
▸ Any change made to the supply
chain must ultimately drive a desired
business outcome.
▸ Remember to constantly balance the
inevitable tradeoffs among cost, capital,
and service level.
▸ Supply chain improvements generally
require changes in three areas: processes
and effective practices; people and
behaviors; and tools, high-quality data,
and technology.
▸ Figure out how to scale a project, so
you can start small and expand in an
effective way.
▸ Competency development of people is
critical. Emphasizes Murray, “You have to
acquire the knowledge and apply it. That’s
the surest way to success.”
6. 6
SCC’s 2011 North American Supply Chain Excellence Award for Technology Advancement
to recognize excellence in methodology or product development that enables superior
supply chain performance.
Accountability, too, is a key premise for strategy-aligned supply chain execution –
one that SAP’s solution supports throughout its processes. “Once the metrics are
defined, documented, and associated with specific individuals within your supply
chain network, you are well on your way to fostering greater accountability,” concludes
Taparia. “In the end, the right metrics drive the right behavior, and behavior drives
enterprise performance.”
Conclusion
In any organization, the supply chain will continue to evolve and change, reacting to
internal pressures as well as external events large and small, natural and man-made.
To manage such complexity and volatility, businesses need improved visibility into the
drivers of supply chain performance. They must not only identify and track the right
metrics, but use analytics to model how different decisions impact risk and results.
A flexible, powerful solution that uses SCOR analysis, such as the award-winning SAP
BusinessObjects Supply Chain Performance Management application, can give even
the most complex organization the ability to better manage its supply chain – whether
through economic upticks or downturns. Companies such as DuPont have successfully
transformed the supply chain function into a strategic differentiator that contributes
to corporate performance on a daily basis. Enhanced supply chain performance and
risk management will ultimately drive financial results and organizational success by
reducing costs, increasing working capital, improving service levels, and strengthening
customer loyalty.
To learn more about how SAP solutions can help improve supply chain performance,
go to www.sap.com/scpm or www.sap.com/i2d. To learn more about SCC, go to
www.supply-chain.org.
7. About the Contributors
Peter Murray is the Supply Chain Innovation and Development Program Manager at
DuPont, and a leader in the company’s long-term supply chain transformation. He serves
on the APICS Board of Directors, is active with the SCC and the Institute of Business
Forecasting, and is one of the team that developed the APICS Certified Supply Chain
Professional body of knowledge. He is a graduate of the University of Vermont.
Richard Howells heads supply chain marketing at SAP, where he drives market direction
and positioning for SAP’s SCM solutions. Previously, he served as VP of marketing at
Marcam Solutions and helped implement ERP and SCM systems at companies such
as Nestle, Gillette, Colgate Palmolive, Rohm & Haas, Wyeth, Royal Worcester Spode,
and Dairy Crest. A regular contributor to www.forbes.com, he holds a B.S. in computer
science from the University of Mid Glamorgan in the UK.
Rich Sherman is Director of Strategic Development for the Council of Supply Chain
Management Professionals. He successfully launched supply chain advisory services for
AMR Research (now Gartner), helped develop the SCOR model, and was a member of the
founding team of the Supply Chain Council. He has held senior management positions
with Microsoft, EXE, DEC, Unisys, and Numetrix, serving clients in retail, distribution,
manufacturing, and logistics. He holds bachelor’s and master’s degrees from the
University of Notre Dame.
Siddharth Taparia is Senior Director of Business Analytics Solution Marketing at SAP. He
joined SAP as part of the 2006 acquisition of BusinessObjects, and is now responsible
for SAP Supply Chain Performance Management, a business analytics solution based
on the SCOR model. He holds a master’s degree in information and operations
management from Texas A&M University and a bachelor’s degree in engineering from
Rajiv Gandhi Technical University, India.
About Supply Chain Council
Supply Chain Council (SCC) is a global not-for-profit consortium whose methodology,
diagnostic, and benchmarking tools help organizations dramatically improve supply
chain processes.
SCOR (Supply Chain Operations Reference) is the world’s most widely recognized
framework for evaluating and comparing supply chain activities and performance.
Continually upgraded, SCOR provides a unique framework for defining and linking
performance metrics, processes, best practices, and people into a unified structure.
SCOR is a registered trademark of Supply Chain Council in the United States and Europe.
All rights reserved.