SlideShare a Scribd company logo
1 of 72
This presentation is the exclusive property of the Supply Chain
Council. Copyright © Supply Chain Council. 2006. All rights
reserved. The marks SCOR®, CCOR™, DCOR™ and SCOR
Roadmap™ are the exclusive property of the Supply Chain Council.
SCOR Framework
Introducing all elements of the Supply
Chain reference model: Standard
processes, metrics and best practices
2Copyright © Supply Chain Council, 2008. All rights reserved
SCOR Framework Workshop
• Understand the History and Context of SCOR
• Learn the Components of the SCOR Framework
• Process Nomenclature
• Process Metrics
• Process Best Practices
• Understand how to model a Supply-Chain with SCOR
• Understand how to characterize a Supply-Chain with
SCOR metrics
• Apply the SCOR framework using a simplified SCOR
Project Roadmap
2
3Copyright © Supply Chain Council, 2008. All rights reserved
Supply-Chain Council
• The SCC is an independent, not-for-profit, trade association
• Membership open to all companies and organizations
• Focus is on research, application and advancement and advancing state-of-the-art
supply chain management systems and practices
• Developer and endorser of the Supply Chain Operations Reference (SCOR®) as a
cross-industry standard for supply chain management
• Offers Training, Certification, Benchmarking, Research, Team Development,
Coaching, and Cross-standard Integration focused on the SCOR® framework
• Founded in 1996
• Approaching 1000 Association Members
• Chapters in North America, Europe, Japan, South Africa, Latin America,
Australia/New Zealand, South East Asia and Greater China, with developing
Chapters India and Middle East
Driving value through the use of SCOR®
3
4
Customerprocesses
Supplierprocesses
Product/Portfolio Management
Supply Chain
SCOR ®
Product Design
DCOR™
Sales & Support
CCOR™
Customerprocesses
Supplierprocesses
Product/Portfolio Management
Supply Chain
SCOR ®
Product Design
DCOR™
Sales & Support
CCOR™
Copyright © Supply Chain Council, 2008. All rights reserved
Supply-Chain
4
5Copyright © Supply Chain Council, 2008. All rights reserved
Supply-Chain
5
Customerprocesses
Supplierprocesses
Supply Chain
Customerprocesses
Supplierprocesses
Supply Chain
Process, arrow indicates material flow direction
Process, no material flow Information flow
DeliverMakeSource
ReturnReturn
Plan
6Copyright © Supply Chain Council, 2008. All rights reserved
SCOR: A Process Framework
6
• Process frameworks deliver the well-known concepts of
business process reengineering, benchmarking, and best
practices into a cross-functional framework
• Standard processes: Plan, Source, Make, Deliver, Return, Enable
• Standard metrics: Perfect Order Fulfillment, Cash-to-Cash Cycle Time,
Cost of Goods Sold, Order Fulfillment Cycle Time, etcetera
• Standard practices: EDI, CPFR, Cross-Training, Sales & Operations
Planning, etcetera
• Pre-defined relationships between processes, metrics and
practices and inputs and outputs
7Copyright © Supply Chain Council, 2008. All rights reserved
Capture the ‘As-is’
business activity
structure and derive
the future ‘To-be’ state
Quantify the
operational
performance of similar
companies and
establish internal
targets based on ‘best
in class’ results
Characterize the
management practices
and software solutions
that result in superior
performance
Business Process
Re-Engineering
Benchmarking Best Practices
Analysis
Process Reference
Framework
Combines Best Techniques
7
• 3 techniques become 1 integrated approach
8Copyright © Supply Chain Council, 2008. All rights reserved
End-to-End Supply Chain
8
Supplier CustomerSuppliers’
Supplier
Source
Internal or External Internal or External
Your Company
Return
Deliver MakeSource
Return
Plan
Deliver
Return
Source
Return
MakeSource
Return
Plan
Deliver
Return
DeliverMake
Plan
Return Return
Customers’
Customer
SCOR reference model
• Whether from Cow to Cone or from Rock to Ring SCOR is not limited by
organizational boundaries
9Copyright © Supply Chain Council, 2008. All rights reserved
End-to-End Supply Chain
9
Customer’s CustomerCustomerMP3 CompanySupplierSupplier’s Supplier
Sub assemblies Manufacturer Retailer ConsumerComponents
SourceDeliverSourceDeliverMakeSourceDeliverMakeSourceDeliverMakeSource
Process, arrow indicates material flow direction
10
Level 1 Level 2 Level 3 Level 4 Level 5
Scope Configuration Activity Workflow Transactions
Differentiates
Business
Differentiates
Complexity
Names Tasks Sequences Steps Links Transactions
Defines Scope Differentiates
Capabilities
Links, Metrics,
Tasks and
Practices
Job Details Details of
Automation
Framework
Language
Framework
Language
Framework
Language
Industry or
Company
Language
Technology
Specific Language
Copyright © Supply Chain Council, 2008. All rights reserved
EDI
XML
SCOR Hierarchy
10
S1 Source
Stocked
Product
S
Source
S1.2
Receive
Product
Standard SCOR practices Company/Industry definitions
11Copyright © Supply Chain Council, 2008. All rights reserved
Level 1 Level 2 Level 3 Level 4 Level 5
Scope Configuration Activity Workflow Transactions
Differentiates
Business
Differentiates
Complexity
Names Tasks Sequences Steps Links Transactions
Defines Scope Differentiates
Capabilities
Links, Metrics,
Tasks and
Practices
Job Details Details of
Automation
CxO (COO, CIO)
EVP
SVP
SVP
VP
VP
Director
Line Manager
Manager
Team Lead
Team Lead
Individuals
Programmer
Organization focused Activity focused
Organizational Hierarchy
11
EDI
XML
S1 Source
Stocked
Product
S
Source
S1.2
Receive
Product
12Copyright © Supply Chain Council, 2008. All rights reserved
SCOR Process Codification
12
• SCOR processes have unique identifiers:
1. One capital only are level 1 processes: P, S, M, D and R (5 in total)
2. A capital plus a number are level 2: P1, S2, M3, D2, D4 (15 in total)
Two groups of exceptions for level 2:
• Enable: EP, ES, EM, ED and ER (5 in total) and
• Return: SR1, DR1, SR2, DR2, SR3, DR3 (6 in total)
3. A capital plus a number, a period and a number are level 3 processes:
P1.1, P1.2, S2.1, M1.5, D3.12 (111 processes in total)
Two groups of exceptions for level 3:
• Enable: EP.1, ES.3, EM.4, ED.8, ER.1 (47 in total)
• Return: SR1.1, DR1.3, SR2.2, DR2.4, SR3.5, DR3.1 (27 in total)
• X = level 1, Xn = level 2, Xn.m = level 3
13
750g minced steak 1 onion (rings)
1 tsp Worcestershire sauce 4 sesame seed buns
2 tbsp mustard 10 shredded lettuce leaves
2 sliced tomatoes 2 sliced dill pickles
10 thin slices Swiss cheese Salt and pepper
Copyright © Supply Chain Council, 2008. All rights reserved
Exercises: The Dinner Party
• The supply chain used for the exercises is a dinner party
• You will host a party this weekend with 25-40 of your dearest friends
• You will serve them burgers from your grill (barbecue)
• You are responsible for organizing the event, ingredients, grill, tools and
utensils and general well-being of your guests
• We will be using “The Dinner Party” through the rest of today to exercise
different modeling characteristics
• Ingredients of a burger:
14Copyright © Supply Chain Council, 2008. All rights reserved
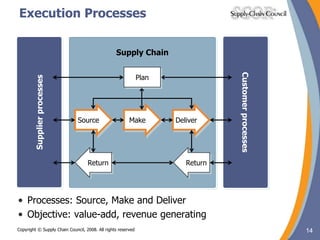
Execution Processes
14
Customerprocesses
Supplierprocesses
Supply Chain
Customerprocesses
Supplierprocesses
Supply Chain
DeliverMakeSource
ReturnReturn
Plan
• Processes: Source, Make and Deliver
• Objective: value-add, revenue generating
15Copyright © Supply Chain Council, 2008. All rights reserved
Level: Different capabilities
Stocked Product (S1, M1, D1)
• Inventory Driven (Plan)
• Standard Material Orders
• High Fill-rate, short turnaround
Make-to-Order (S2, M2, D2)
• Customer Order Driven
• Configurable Materials
• Longer turn-around times
Engineer-to-Order (S3, M3, D3)
• Customer Requirements Driven
• Sourcing New Materials
• Longest long lead-times, low fill rates
D1R1 I1M1S1 D1
I2
R1
D2R2 D2
S1
M2S2
I3
R1
D3R3
R1
R2
D3
R1
M3S3
S1
S2
Capability Models
15
16Copyright © Supply Chain Council, 2008. All rights reserved
Source (Process ID: S)
• Objectives of this process:
• The ordering, delivery, receipt and transfer of raw material
items, subassemblies, product and/or services.
• Key processes comprehended:
• Schedule product deliveries
• Receive, inspect, and hold materials
• Issue material to Make or Deliver processes
• Supplier/Vendor Agreements
• Vendor certification and feedback, sourcing quality
• Manage Raw Materials inventories
• Freight, import/export documentation
• Hint: Receiving processes? Probably Source in SCOR
16
17Copyright © Supply Chain Council, 2008. All rights reserved
Source Configurations
• Configurations:
• Source Stocked Product (Process ID: S1)
• The ordering and receiving of existing products, components and
services from existing contracts, based on requirement plans.
• Source Make-to-Order (Process ID: S2)
• The ordering and receiving of existing products, components and
services for a unique and identified customer order.
• Source Engineer-to-Order (Process ID: S3)
• The selection, ordering and receiving of specialized products or
services that are designed and/or built based on the requirements
or specifications of a particular customer order or contract.
17
18Copyright © Supply Chain Council, 2008. All rights reserved
Stocked Product (S1) Make-to-Order (S2) Engineer-to-Order (S3)
S2.1 Schedule Product
Deliveries
S3.1 Identify Sources of
Supply
S3.2 Select Final Supplier(s)
and Negotiate
S1.1 Schedule Product
Deliveries
S3.3 Schedule Product
Deliveries
S1.2 Receive Product S2.2 Receive Product S3.4 Receive Product
S1.3 Verify Product S2.3 Verify Product S3.5 Verify Product
S1.4 Transfer Product S2.4 Transfer Product S3.6 Transfer Product
S1.5 Authorize Supplier
Payment
S2.5 Authorize Supplier
Payment
S3.7 Authorize Supplier
Payment
Source Process Elements
18
21Copyright © Supply Chain Council, 2008. All rights reserved
Make (Process ID: M)
21
• Objectives of this process:
• The process of adding value to products through mixing, separating,
forming, machining, and chemical processes.
• Key Processes Comprehended:
• Schedule production, request and receive material from
Source and/or Make processes
• Manufacture, assemble/disassemble and test product,
package, hold/release product
• Managing product quality and engineering changes
• Managing facilities and equipment, production status
workflow and capacity management
• Manage Work-In-Process (WIP) inventories
• Hint: Itemnumber change? Probably Make in SCOR
22Copyright © Supply Chain Council, 2008. All rights reserved
Make Configurations
• Make-to-Stock (Process ID: M1)
• The making of standard products and services. Planning (Plan)
processes determine what, how much and when to make.
• Make-to-Order (Process ID: M2)
• The making of standard or configurable products and services for
unique customer orders. Customer orders determine what, how much
and when to make. Customer orders can be traced throughout the
Make process.
• Engineer-to-Order (Process ID: M3)
• The making of specialized products or services that are fully or
partially designed and made based on the unique requirements and
specifications of a particular customer order or contract. Customer
orders and specifications can be traced throughout the Make process.
22
23Copyright © Supply Chain Council, 2008. All rights reserved
Make-to-Stock (M1) Make-to-Order (M2) Engineer-to-Order (M3)
M1.1 Schedule Production
Activities
M2.1 Schedule Production
Activities
M3.1 Finalize Production
Engineering
M3.2 Schedule Production
Activities
M1.2 Issue Material M2.2 Issue Sourced/In-
Process Product
M3.3 Issue Sourced/In-Process
Product
M1.3 Produce and Test M2.3 Produce and Test M3.4 Produce and Test
M1.4 Package M2.4 Package M3.5 Package
M1.5 Stage Product M2.5 Stage Finished Product M3.6 Stage Finished Product
M1.6 Release Product to
Deliver
M2.6 Release Finished
Product to Deliver
M3.7 Release Product to
Deliver
M1.7 Waste Disposal M2.7 Waste Disposal M3.8 Waste Disposal
Make Process Elements
23
2525Copyright © Supply Chain Council, 2008. All rights reserved
Deliver (Process ID: D)
• Objectives of this process:
• Perform customer-facing order management and order fulfillment
activities including outbound logistics.
• Key processes comprehended:
• Product, service and price quotations
• Order entry and maintenance
• Order consolidation, picking, packing, labeling and shipping
• Import/export documentation
• Customer delivery and installation
• Logistics and Freight Management
• Manage Finished Goods inventories
• Hint: Order taking or Shipping? Probably Deliver in SCOR
26Copyright © Supply Chain Council, 2008. All rights reserved
Deliver Configurations
26
• Deliver Stocked Product (Process ID: D1)
• The delivery of standard products (and services) that are maintained in a
finished goods state prior to the receipt of a customer order.
• Deliver Make-to-Order Product (Process ID: D2)
• The delivery of standard or configurable products and services that are
obtained (Source or Make) for a customer order.
• Deliver Engineer-to-Order Product (Process ID: D3)
• The delivery of specialized products and services that have been fully or
partially designed in negotiation and based on requirements from a
customer order and customer provided specifications
• Deliver Retail Product (Process ID: D4)
• The delivery of standards goods in a retail store
27Copyright © Supply Chain Council, 2008. All rights reserved
Deliver Process Elements (1/3)
27
Stocked Products (D1) Make-to-Order (D2) Engineer-to-Order (D3)
D1.1 Process Inquiry & Quote D2.1 Process Inquiry & Quote D3.1 Obtain & Respond to
RFP/RFQ¹
D1.2 Receive, Enter &
Validate Order
D2.2 Receive, Configure,
Enter & Validate Order
D3.2 Negotiate & Receive
Contract
D1.3 Reserve Inventory &
Determine Delivery
Date
D2.3 Reserve Inventory &
Determine Delivery Date
D3.3 Enter Order, Commit
Resources & Launch
Program
D1.4 Consolidate Orders D2.4 Consolidate Orders D3.4 Schedule Installation
D1.5 Build Loads D2.5 Build Loads D3.5 Build Loads
D1.6 Route Shipments D2.6 Route Shipments D3.6 Route Shipments
D1.7 Select Carriers & Rate
Shipments
D2.7 Select Carriers & Rate
Shipments
D3.7 Select Carriers & Rate
Shipments
¹ RFP = Request for Proposal, RFQ = Request for Quote
28Copyright © Supply Chain Council, 2008. All rights reserved
Deliver Process Elements (2/3)
28
Stocked Products (D1) Make-to-Order (D2) Engineer-to-Order (D3)
D1.8 Receive Product from
Source or Make
D2.8 Receive Product from
Source or Make
D3.8 Receive Product from
Source or Make
D1.9 Pick Product D2.9 Pick Product D3.9 Pick Product
D1.10 Pack Product D2.10 Pack Product D3.10 Pack Product
D1.11 Load Product & Create
Documentation
D2.11 Load Product & Create
Documentation
D3.11 Load Product & Create
Documentation
D1.12 Ship Product D2.12 Ship Product D3.12 Ship Product
D1.13 Receive & Verify
Product by Customer
D1.13 Receive & Verify Product
by Customer
D1.13 Receive & Verify
Product by Customer
D1.14 Install Product D2.14 Install Product D3.14 Install Product
D1.15 Invoice D2.15 Invoice D3.15 Invoice
29Copyright © Supply Chain Council, 2008. All rights reserved
Deliver Process Elements (3/3)
• The Retail supply chain model does
not match up to the Manufacturing
supply chain model, therefore
processes are quite different
29
Retail Products (D4)
D4.1 Generate Stocking
Schedule
D4.2 Receive Product at
Store
D4.3 Pick Product from
Backroom
D4.4 Stock Shelf
D4.5 Fill Shopping Cart
D4.6 Checkout
D4.7 Deliver and/or Install
30Copyright © Supply Chain Council, 2008. All rights reserved
Control processes: Plan, Enable
• Plan and Enable processes prepare the supply-chain to
ensure smooth execution
• Planning processes balance the need for resources,
materials, capacity, etc. with the availability of these
resources. This includes prioritization if needed.
• Enable processes address 8 control aspects for the supply
chain. They monitor compliance, deliver information from
other process areas and highlight dependencies
on these other process areas. They also
support maintenance of relationships
with suppliers.
30
31Copyright © Supply Chain Council, 2008. All rights reserved
Planning Processes
31
Customerprocesses
Supplierprocesses
Supply Chain
Customerprocesses
Supplierprocesses
Supply Chain
DeliverMakeSource
ReturnReturn
Plan
• Processes: Plan
• Objective: Drive/coordinate execution processes
32Copyright © Supply Chain Council, 2008. All rights reserved
Plan (Process ID: P)
32
• Objectives of this process:
• The process of determining requirements and corrective actions to
achieve supply chain objectives
• Key Processes Comprehended:
• Supply chain revenue planning/forecasting
• Materials requirement planning
• Factory, repair, maintenance facilities capacity planning
• Distribution requirements planning
• Manage planning parameters
• Hint: Forecasting, S&OP, MRP?
Probably Plan in SCOR
33Copyright © Supply Chain Council, 2008. All rights reserved
Plan Configurations (1/2)
33
• Plan Supply Chain (Process ID: P1)
• Planning overall supply chain targets. Plan Supply Chain drives and
coordinates P2, P3, P4 and P5 plans (Compare to “Revenue plan”, or
“Budget” in certain industries)
• Plan Source (Process ID: P2)
• Planning of material ordering and receiving activities. Plan Source
calculates which materials need to be available when to support the
production plan (P3) and/or the delivery plan (P4). (Compare to
“Materials Requirements Plan”)
• Plan Make (Process ID: P3)
• Planning of production and/or MRO activities. Plan Make ensures the
production resources (capacity) are in place as needed and may
generate production orders. (Compare to “Production Plan”)
34Copyright © Supply Chain Council, 2008. All rights reserved
Plan Configurations (2/2)
34
• Plan Deliver (Process ID: P4)
• Planning of order management, material handling and transportation
activities. Plan Deliver ensures resources are in
place as needed and may generate or recalculate shipping dates based
on material availability. (Compare to “Shipment Plan”, “Load Planning”)
• Plan Return (Process ID: P5)
• Planning of the reverse logistics shipping and material handling capacity.
Note: This does not include the maintenance, repair or overhaul activity
planning as those are Make processes.
35
Plan Make
Plan Source
Plan Supply ChainPlan Supply Chain
P1.1
P1.2
P1.3 P1.4
P1.1
P1.2
P1.3 P1.4
P2.1
P2.2
P2.3 P2.4
P3.1
P3.2
P3.3 P3.4 2
1
to P3.2
end full cycle begin next cycle
Copyright © Supply Chain Council, 2008. All rights reserved
Plan Processes
• Planning is an iterative process:
1. The output of Plan Supply Chain is the input for Plan Source, Plan
Make, Plan Deliver and Plan Return
2. The output of Plan Source, Plan Make, Plan Deliver and Plan Return
are inputs for Plan Supply Chain; The output of one cycle is the
input for the next cycle
35
36Copyright © Supply Chain Council, 2008. All rights reserved
Enable Processes
36
Customerprocesses
Supplierprocesses
Supply Chain
Customerprocesses
Supplierprocesses
Supply Chain
DeliverMakeSource
ReturnReturn
Plan
• Processes: Enable Plan, Enable Source, Enable Make,
Enable Deliver and Enable Return
37Copyright © Supply Chain Council, 2008. All rights reserved
Enable Processes
37
• Objective:
The Enable processes are five groups of processes under Plan, Source,
Make , Deliver and Return with 3 distinct types of objectives:
1. Manage process performance
2. Manage process control data
3. Manage process relationships
• Key processes comprehended:
• Managing business rules and monitoring adherence
• Measuring supply chain performance and determine corrective action
• Managing risk and environmental impact
• Managing the supply chain network and facilities
• Hint: Equipment or plant maintenance? Probably Enable
38Copyright © Supply Chain Council, 2008. All rights reserved
Enable Categories
38
• Enable Plan (Process ID: EP)
• Performance, data and relationship management processes for all types
of planning processes: Plan Supply Chain, Plan Source, Plan Make, Plan
Deliver and Plan Return. Examples: maintain planning cycles, monitor
planning accuracy, manage supply chain risks.
• Enable Source (Process ID: ES)
• Performance, data and relationship management processes for all
receiving activities and supplier related processes. Examples: Monitor
supplier performance, maintain what is sourced where.
• Enable Make (Process ID: EM)
• Enable management processes for manufacturing, repair and overhaul
type processes. Examples: BOM maintenance, preventive equipment
maintenance, monitoring capacity utilization/shortage.
39Copyright © Supply Chain Council, 2008. All rights reserved
Enable Categories
39
• Enable Deliver (Process ID: ED)
• Performance, data and relationship management processes for all order
management, warehouse and distribution activities and forwarder related
processes. Examples: Monitor order management and forwarder
performance, maintain a distribution network, managing risk.
• Enable Return (Process ID: ER)
• Enable management processes for all types of reverse logistics processes:
MRO returns, defective product returns and excess inventory returns.
Examples: Maintain return approval rules, Maintain issue tracking
software, maintain a return distribution network.
40Copyright © Supply Chain Council, 2008. All rights reserved
Reverse Processes
40
Customerprocesses
Supplierprocesses
Supply Chain
Customerprocesses
Supplierprocesses
Supply Chain
DeliverMakeSource
ReturnReturn
Plan
• Processes: Return (Source Return, Deliver Return)
• Objective: reverse material flows
41Copyright © Supply Chain Council, 2008. All rights reserved
Return (Process ID: R)
41
• Objective of this process:
• Moving material from customer back through supply chain to address
defects in product, ordering, or manufacturing, or to perform upkeep
activities.
• Key Processes Comprehended
• Identification of the need to return a product or asset
• Requesting and issuing return authorization
• Inspection and disposition decision-making
• Transfer/Disposition of product or asset
• Managing return transportation capacity
• Managing returned material inventories
• Hint: Reverse material flow? Probably Return in SCOR
42Copyright © Supply Chain Council, 2008. All rights reserved
Return Configurations
42
• Return Defective Products (Process IDs: SR1 and DR1)
• The return of products because the product is defective, the wrong
product was ordered or shipped.
• Return Maintenance, Repair & Overhaul (IDs: SR2 and DR2)
• The return of products or assets to perform preventative maintenance,
(end-of-life) overhaul or repairs due to breakage/aging with use
• Return Excess Products (Process IDs SR3 and DR3)
• The return of excess inventories and inventories of product which will be
retired (end-of-life excess). The product is new and in original packaging.
• SR = Source Return, DR = Deliver Return
• Positioning Source Return and Deliver Return
• Consider the flow of goods; Notice the positions of Source and Deliver
• Now, notice the positions of Source Return and Deliver Return
Supplier CustomerMy Company
Deliver
Return
Source
Return
Source
Return
Deliver
Return
CustomerMy Company
Deliver Source SourceDeliver
Supplier
43Copyright © Supply Chain Council, 2008. All rights reserved
Return Configurations
43
44Copyright © Supply Chain Council, 2008. All rights reserved
Modeling with SCOR
• Drivers for modeling: Why do you model
• Business opportunities:
• Strategy Development
• Merger, Acquisition or Divestiture (Companies or Supply Chains)
• Process optimization and Re-engineering
• Standardization, Streamlining and Management alignment
• New business start-up (Company and Supply Chain start-ups)
• Benchmarking
• Process Outsourcing
• Technology services:
• Software implementation (ERP, PLM, QC)
• Workflow & Service Oriented Architecture
44
45Copyright © Supply Chain Council, 2008. All rights reserved
Different Model Types
• SCOR recognizes different types of models. Each serving a
different purpose:
• Business Scope diagram: Set the scope for a project or organization
• Geographic Map (a.k.a. Geo Map): Describes material flows in a
geographic context; Highlights node¹ complexity or redundancy
• Thread Diagram: Material flow diagram, focused on level 2 process
connectivity; Describes high level process complexity or redundancy
• Workflow or Process Models: Information, material and work flow
diagram at level 3 (or beyond); Highlights information, people and
system interaction issues
¹) A node represents a logical or geographic entity in a supply chain.
Examples: Warehouse, Factory, Store
45
• Steps to create a Business Scope Diagram
1. Create or open the business scope diagram template
2. Identify customers of your organization or project and enter these in the
customers column in the scope diagram.
3. Identify and enter the key nodes within your organization or project. A
node represents a logical or geographic entity in the supply chain.
Consider: Warehouse, Factory, Store, HQ etc.
4. Identify and enter the suppliers of your organization or project
5. Optionally link the nodes to reflect material and/or information flows. Use
a different color and/or stroke differentiate material and information
flows. Example:
46Copyright © Supply Chain Council, 2008. All rights reserved
Creating a Scope Diagram
46
Material and information flow
Information flow
Supplier My Organization CustomerSupplier My Organization Customer
Supplier My Organization Customer
47Copyright © Supply Chain Council, 2008. All rights reserved
Creating a Scope Diagram
47
Steps to create a Business Scope Diagram
1. Create or open the business scope diagram template
2. Identify and enter the customers of your project or
organization
3. Identify and enter the key nodes within your project
or organization
4. Identify and enter the suppliers of your project or
organization
5. Optionally link the nodes to reflect material and/or
information flows (using different color/stroke)
Flash Inc.
Battery ltd.
Comps
Factory DC Retail Inc.
mp3 HQ
234
Flash Inc.
Battery ltd.
Comps
Factory DC Retail Inc.
mp3 HQ
55
1
Suppliers mp3, Inc. Customers
Service Providers
48Copyright © Supply Chain Council, 2008. All rights reserved
The Result: Scope Diagram
48
Flash Inc.
Battery ltd.
Components
Factory
Warehouse
Retail, Inc.
mp3 HQ
Material and information flow
Information flow
49Copyright © Supply Chain Council, 2008. All rights reserved
Modeling with SCOR
49
Steps to create the Geographic Map:
1. Create geographic context (a.k.a. the map)
2. Draw and name your customers on the map
a. Identify the level 2 processes
b. List the level 2 processes in the customer on your map
3. Beginning with your customers, repeat this for every node on the map:
a. Identify all supplying nodes (where does material come from)
b. Draw and name these supplying nodes on the map
c. Identify the level 2 processes
d. list these in the node on your map
e. Draw the material flows (arrows connecting the nodes)
Repeat until you have included all your suppliers/nodes
50
Retail, Inc
S1, P2
b
France
Spain
UK
Germany
2
China
India
Copyright © Supply Chain Council, 2008. All rights reserved
Creating a Geographic Map
50
Steps to create the Geographic Map:
1. Create geographic context (a.k.a. the map)
2. Draw and name your customers on the map
a. Identify the level 2 processes
b. List the level 2 processes in the customer node
3. Starting with your customers, repeat for each node:
a. Identify all supplying nodes
b. Draw and name these supplying nodes
c. Identify the level 2 processes
d. List the level 2 processes in each node
e. Draw the material flows (connecting arrows)
Repeat until you have included all your suppliers
1
MP3 Factory
S1, M1, D1
3
b¹
d¹
Drive Supplier
D1, P1, P4
b²
d²
e²
e¹
51
Drive Supplier
D1, P1, P4
Battery Supplier
D1, P1, P4
Retail, Inc
S1, P2
MP3 Factory
P3, S1, M1, D1
HQ
P1, P2, D2, S2
Copyright © Supply Chain Council, 2008. All rights reserved
Result: The Geographic Map
51
Question: No flow from HQ; Why?
52Copyright © Supply Chain Council, 2008. All rights reserved
Modeling with SCOR
52
1. Orders are faxed in and entered in OMS
2. Every night the orders are scheduled
3. The orders are released to the factory
based on the delivery date offset
4. Factory creates and schedules factory
work orders in SFCS
1
D2.2 Receive, Enter, Validate Order
D2.3 Reserve Inventory & Determine
Delivery Date
M2.1 Schedule Production Activities
2
Steps to establish SCOR process models (workflows)
1. Obtain generic descriptions (this is what people describe)
2. Map these generic descriptions to SCOR process IDs (normalize)
3. Create swimming lanes to reflect organizational boundaries
4. Create workflow with these SCOR processes
5. Add description to workflows to reflect inputs/outputs of the processes
6. Optionally add other relevant information
53Copyright © Supply Chain Council, 2008. All rights reserved
Elements of a Business Process
53
not in SCOR
organization
activity
business rules
technology
measurements
inputs outputs
people
metrics
best practices
geography
platform
interfaceskills
• Process is defined by more than just activity
54Copyright © Supply Chain Council, 2008. All rights reserved
Obtaining Generic Descriptions
54
• Staple-Yourself-To-An-Order;
• Proven technique to obtain generic language process descriptions:
• Follow the logical flow of an order through the process.
• Each level 1 process has an order (except Plan): Customer order for
Deliver, Production order for Make, Purchase order for Source and
Return Authorization for Return.
• For each order start with the process of order creation and follow the
order and document each activity until the order is completed/closed.
• Similarly follow the steps of the planning cycles you encounter.
• Finally cover any process you have missed so far; Use your SCOR list of
processes as a check-list.
• Hint: To obtain generic descriptions for an end-to-end supply chain: Start
with Plan, then Deliver, Make, Source.
55Copyright © Supply Chain Council, 2008. All rights reserved
Obtaining Generic Descriptions
55
• The purpose of capturing process is to understand it and
remove, adjust or repair it where needed
• Recognize process characteristics:
• 'Measurements': It takes 30 minutes to build…
• 'Business rule': The plan is updated weekly…
• 'People': This is handled by Joanna on Thursdays …
• 'Business rule': This is done to provide .. with .. data..
• 'Inputs' or 'triggers': When we receive the document..
• 'Outputs': We send them the document..
• 'Technology': We print the document from the .. system..
• 'Business rules': We need two copies of the form ..
• Verify hearsay statements, to eliminate perception
56Copyright © Supply Chain Council, 2008. All rights reserved
SCOR Metrics
• Definitions:
• Performance Attribute: a characteristic to describe a strategy.
Performance attributes serve as classification for KPIs and metrics
• Key Performance Indicator (KPI): a metric that is representative
to measure the overall performance or state-of-affairs
• Metric: a standard for measurement
• Measurement: an observation that reduces the
• amount of uncertainty about the value of a quantity
• SCOR metrics: Diagnostic metrics
• Linked to business objectives
• Highlight the gap in performance
• Change over time is more valuable than a single sample
56
57
Attribute Strategy
Reliability (RL) Consistently getting the orders right, product
meets quality requirements
Responsiveness (RS) The consistent speed of providing
products/services to customers
Agility (AG) The ability to respond to changes in the
market (external influences)
Cost (CO) The cost associated with managing and
operating the supply chain
Assets (AM) The effectiveness in managing the supply
chain’s assets in support of fulfillment
Copyright © Supply Chain Council, 2008. All rights reserved
CustomerInternal
Performance Attributes
57
Question: What is/are the most important attributes to achieve your
supply chain strategy?
58Copyright © Supply Chain Council, 2008. All rights reserved
‘Levels’ in Metrics
• Level 1: Strategic metrics a.k.a. Key Performance Indicators
• Measure overall supply chain performance; health of the supply chain
• Set the scope and objectives for a supply chain, project or organization
• Translate a business problem or strategy into something measurable
• Establish the priority or priorities for organization
• Level 2: Diagnostic metrics
• Measure a part of the supply chain and/or a part of the strategic metric
• Provide direction to where problems originate
• Caution: Level 2 metrics do not by definition add up to a level 1 metric
• Beyond level 1 and 2: all metrics are called level 3
• SCOR does not specify levels for metrics that are not level 1 or 2
• These metrics serve as further diagnostic tools
58
59Copyright © Supply Chain Council, 2008. All rights reserved
SCOR Metrics Codification
59
• SCOR metrics have unique identifiers:
1. Two capitals are performance attributes: RL, RS, AG, CO and AM (5)
2. Two capitals, a period the number one (1) and a number are strategic
(a.k.a. level 1) metrics:
RL.1.1, RS.1.1, AG.1.1, CO.1.1, CO.1.2, AM.1.3 (10 in total)
3. Two capitals, a period the number two (2) and a number are diagnostic
(a.k.a. level 2) metrics:
RL.2.1, RS.2.1, AG.2.1, CO.2.1, CO.2.2, AM.2.7 (36 in total)
4. Two capitals, a period the number three (3) and a number are diagnostic
(or level 3) metrics:
RL.3.1, RS.3.1, AG.3.1, CO.3.149, CO.3.151, AM.3.44 (>500)
• XX = performance attribute,
• XX.1.n = level 1, XX.2.n = level 2, and so on
• Measuring strategy: KPIs are strategic (level 1) metrics
60
Attribute Strategic metric
Reliability RL.1.1 Perfect Order Fulfillment
Responsiveness RS.1.1 Order Fulfillment Cycle Time
Agility AG.1.1 Upside Supply Chain Flexibility
AG.1.2 Supply Chain Upside Adaptability
AG.1.3 Supply Chain Downside Adaptability
Cost CO.1.1 Supply Chain Management Cost
CO.1.2 Cost of Goods Sold
Assets AM.1.1 Cash-to-Cash Cycle Time
AM.1.2 Return on Supply Chain Fixed Assets
AM.1.3 Return on Working Capital
Copyright © Supply Chain Council, 2008. All rights reserved
CustomerInternal
KPIs; Strategic Metrics
60
61
Metric: RL.1.1 Perfect Order Fulfillment
Definition: The percentage of orders delivered on-time, in full.
Components of perfect include all items and quantities on-
time, using the customer’s definition of on-time, complete
documentation and in the right condition
Calculation: [Total Perfect Orders] / [Total Number of Orders]
Diagnostic
Metrics:
(examples)
• RL.2.1 % Orders Delivered in Full
• RL.2.4 Perfect Condition
• RL.3.19 % Orders Received Defect Free
• RL.3.24 % Orders Received Damage Free
Notes: An order is perfect only if all L2/L3 metrics are perfect; An
order must be: on-time AND in-full AND right condition AND
right documentation
Copyright © Supply Chain Council, 2008. All rights reserved
Strategic Reliability Metric
61
62
Metric: RS.1.1 Order Fulfillment Cycle Time
Definition: The average actual cycle time consistently achieved to fulfill
customer orders. The actual cycle time starts with the receipt
of the order and ends with the customer acceptance of the
delivery. The unit of measure is days.
Calculation: [Sum Actual Cycle Times For All Orders Delivered] / [Total
Number Of Orders Delivered]
Diagnostic
Metrics:
(examples)
• RS.2.2 Make Cycle Time
• RS.2.3 Deliver Cycle Time
• RS.3.96 Pick Product Cycle Time
Notes: Order Fulfillment Cycle Time includes dwell time. Dwell time is
the time no value add activities are performed on the order or
product, imposed by customer requirements.
Copyright © Supply Chain Council, 2008. All rights reserved
Strategic Responsiveness Metric
62
63Copyright © Supply Chain Council, 2008. All rights reserved
Strategic Agility Metrics
63
Metric: AG.1.1 Upside Supply Chain Flexibility
Definition: The number of days required to achieve an unplanned
sustainable 20% increase in quantities delivered. Seasonality
is not considered unplanned/unforeseen. The unit of measure
for flexibility is calendar days.
Calculation: The larger of the number of days required to achieve
sustainable increase for Source, Make and Deliver
Diagnostic
Metrics:
• AG.2.1 Upside Source Flexibility
• AG.2.2 Upside Make Flexibility
• AG.2.3 Upside Deliver Flexibility
Notes: This metric may have more than one Source, Make and
Deliver Flexibility component depending on the complexity of
the supply chain.
64Copyright © Supply Chain Council, 2008. All rights reserved
Metric: AM.1.1 Cash-to-Cash Cycle Time
Definition: The time it takes for cash invested in materials to flow back
into the company after finished goods have been delivered to
customers. The unit of measure for Cash-to-Cash Cycle Time
is calendar days
Calculation: [Inventory Days of Supply] + [Days Sales Outstanding] –
[Days Payable Outstanding]
Diagnostic
Metrics:
• AM.2.1 Days Sales Outstanding (DSO)
• AM.2.2 Inventory Days of Supply (IDOS)
• AM.2.3 Days Payable Outstanding (DPO)
Notes: For services, the time between paying the resources assigned
to a service and receiving payment for the service delivery.
Strategic Asset Metrics
64
65Copyright © Supply Chain Council, 2008. All rights reserved
Metric: AM.1.2 Return on Supply Chain Fixed Assets
Definition: The return an organization receives on its invested capital in
supply chain fixed assets. This includes the fixed assets used
to Plan, Source, Make, Deliver and Return. Examples of fixed
assets include land, buildings, machinery, trucks
Calculation: ([Supply Chain Revenue] – [COGS] – [Supply Chain
Management Costs]) / [Supply Chain Fixed Assets]
Diagnostic
Metrics:
• AM.3.11 Deliver Fixed Assets Value
• AM.3.18 Make Fixed Assets Value
• AM.3.20 Plan Fixed Asset Value
• AM.3.27 Source Fixed Assets Value
Notes: Supply-Chain Revenue is the operating revenue generated
from a supply chain. This does not include non-operating
revenue, such as investments, etc..
Strategic Asset Metrics
65
66Copyright © Supply Chain Council, 2008. All rights reserved
Metrics and Analysis
66
• Levels in metrics help root cause performance issues
• Strategic metrics (level 1) can be diagnosed by investigating the level 2
metrics.
• Different types of relationships exist between a metric (the ‘parent’) and
it’s diagnostic metrics (the ‘children’):
1. The parent is the sum of it’s children (e.g. time and cost)
2. The children are multiplied to calculate the parent (e.g. yield)
3. The relationship is undefined (but can be statistically observed)
• Diagnostic metrics don’t necessarily add up to their parents:
Order Fulfillment Cycle Time IS NOT the sum of Deliver Cycle Time +
Make Cycle Time + Source Cycle Time for most supply chains
67Copyright © Supply Chain Council, 2008. All rights reserved
Metrics Data
67
• Each company will need to develop a tool or instructions
where to source the data for the SCOR metrics
• There are two types of data:
• Recorded data; obtain from transactional systems such as ERP
(Enterprise Resource Planning), WMS (Warehouse Management System),
financial systems, etc. For example: compare time-stamps in these
systems to calculate cycle times.
• Observed data; obtain through interviews, error logs, audits and/or time-
studies. For example the observed percentage of orders requiring
additional customer setup in a system, percentage of manual repackaging
events on the shipping dock.
• There is no easy button
68Copyright © Supply Chain Council, 2008. All rights reserved
Scorecards and SCORcards
• Definitions
• Scorecard: A visual display of the most important information needed
to achieve one or more objectives, consolidated and arranged in a
single view
• Balanced Scorecard: A scorecard providing metrics related to four
organizational strategies: financial, customer, internal process, and
employee learning and growth
• SCORcard: A scorecard providing metrics related to five supply chain
strategies: reliability, responsiveness, Agility, cost and assets
• Importance
• Communicate supply chain priorities
• Monitor all strategic areas, not just the top priority
68
69Copyright © Supply Chain Council, 2008. All rights reserved
SCORcard Metrics Selection
• SCORcard metric requirements:
• Measurable and quantifiable
Avoid 'feel good' metrics like supplier satisfaction or customer
satisfaction, unless they are an aggregation of well-defined detail
metrics. Framework-based metrics simplify the selection process.
• Linkage to responsibility
Avoid metrics that have no impact on performance reviews (supplier
or employee), ensure the metric is linked to the (right) process
owner at the right level.
• Ensure metric is well-defined
Multiple interpretations of a metric may lead to 'work-arounds' and
negation of the effort. SCOR metrics are pre-defined; limiting the
discussion on metric definitions.
69
70Copyright © Supply Chain Council, 2008. All rights reserved
Metrics Selection
• Interpreting the definitions
• Customer facing metrics should be measured as close to the
customer experience as possible.
• The moment of order submission instead of order entry
• Delivered performance instead of shipping performance
• Received quality instead of produced or shipped quality
• Measure what makes sense: Don’t have data; approximate the
missing component until you will be able to obtain the data
• Tip: It is not about how you think it should be measured, ask your
customer what is important to him/her
• And: Internal focused metrics also have a customer
70
71Copyright © Supply Chain Council, 2008. All rights reserved
Benchmarking
• Definitions
• Benchmarking: Comparing an organization’s performance,
products, practices, and/or services with those of other organizations
that operate in the same or comparable industry
• Parity: Being equal in performance; No real advantage over others
• Advantage: Being in a favorable position; In a stronger position
than
• Superior: Being of high rank or quality; Leading
• Usage
• Establish Goals. Know where you are relative to others (competitors
or peers), and express where you're going.
• Monitor Performance. Track relative progress you and others (your
competitors or peers) make.
71
72Copyright © Supply Chain Council, 2008. All rights reserved
Benchmark Requirements
72
• Compare like for like
• Using standard metrics
A numerical comparison of the performance of two companies in the
same industry may not have value when the metric is different.
• Measuring the same process/business model
Avoid comparing the performance of a make-to-stock process to an
engineer-to-order process. The purpose of these processes is different,
measure them accordingly.
• Demographics
Make sure you understand the other organizations in the
benchmark. Regional differences, and differences in
product, or services may influence results.
73Copyright © Supply Chain Council, 2008. All rights reserved
Best Practices
73
• Definitions:
• Best practice: "A current, structured, proven and repeatable method
for making a positive impact on desired operational results."
• Current: Must not be emerging and can not be antiquated
• Structured: Has clearly stated Goal, Scope, Process, and Procedure
• Proven: Success has been demonstrated in a working environment
and can be linked to key metrics
• Repeatable: The practice has been proven in multiple environments.
• Importance
• Alternatives to the way you do business
• Equalize the competitive landscape
74Copyright © Supply Chain Council, 2008. All rights reserved
Types of Practices
• Best practices are Current, structured, proven and
repeatable methods for making a positive impact on
desired operational results.
• Leading practices are innovations adopted by single
companies or industries which provide dramatically
improved performance in a process, but because of
proprietary restrictions, or novelty, are not widely known
or adopted.
• Worst practices or Poor practices: Practices that are
known to produce negative impacts on operational results.
74
This presentation is the exclusive property of the Supply Chain
Council. Copyright © Supply Chain Council. 2006. All rights
reserved. The marks SCOR®, CCOR™, DCOR™ and SCOR
Roadmap™ are the exclusive property of the Supply Chain Council.
www.supply-chain.org
info@supply-chain.org

More Related Content

What's hot

Unit 5 strategic issues in logistics lscm (32 pages)logistics management
Unit 5 strategic issues in logistics   lscm (32 pages)logistics management Unit 5 strategic issues in logistics   lscm (32 pages)logistics management
Unit 5 strategic issues in logistics lscm (32 pages)logistics management
Suzana Vaidya
 
manajemen pemasaran Chapter 13 merancang dan mengelola jasa
manajemen pemasaran Chapter 13 merancang dan mengelola jasamanajemen pemasaran Chapter 13 merancang dan mengelola jasa
manajemen pemasaran Chapter 13 merancang dan mengelola jasa
Cn Beng
 
Supply chain management
Supply chain managementSupply chain management
Supply chain management
Aniket Verma
 
Logistic management
Logistic managementLogistic management
Logistic management
Vijay Singh
 
Supply Chain Management And Logistics PowerPoint Presentation Slides
Supply Chain Management And Logistics PowerPoint Presentation SlidesSupply Chain Management And Logistics PowerPoint Presentation Slides
Supply Chain Management And Logistics PowerPoint Presentation Slides
SlideTeam
 

What's hot (20)

6. Teknik Pemilihan Supplier & Pengukuran Performansi_ Materi Pelatihan "MANA...
6. Teknik Pemilihan Supplier & Pengukuran Performansi_ Materi Pelatihan "MANA...6. Teknik Pemilihan Supplier & Pengukuran Performansi_ Materi Pelatihan "MANA...
6. Teknik Pemilihan Supplier & Pengukuran Performansi_ Materi Pelatihan "MANA...
 
Supply chain management and logistics management
Supply chain management and logistics managementSupply chain management and logistics management
Supply chain management and logistics management
 
CPFR Presentation
CPFR PresentationCPFR Presentation
CPFR Presentation
 
Unit 5 strategic issues in logistics lscm (32 pages)logistics management
Unit 5 strategic issues in logistics   lscm (32 pages)logistics management Unit 5 strategic issues in logistics   lscm (32 pages)logistics management
Unit 5 strategic issues in logistics lscm (32 pages)logistics management
 
manajemen pemasaran Chapter 13 merancang dan mengelola jasa
manajemen pemasaran Chapter 13 merancang dan mengelola jasamanajemen pemasaran Chapter 13 merancang dan mengelola jasa
manajemen pemasaran Chapter 13 merancang dan mengelola jasa
 
Supply chain management ppt @ doms
Supply chain management ppt @ doms Supply chain management ppt @ doms
Supply chain management ppt @ doms
 
Service Operations Management Challenges
Service Operations Management ChallengesService Operations Management Challenges
Service Operations Management Challenges
 
Logistics operations in india
Logistics operations in indiaLogistics operations in india
Logistics operations in india
 
Supply chain management
Supply chain managementSupply chain management
Supply chain management
 
Scor
ScorScor
Scor
 
Manajemen rantai pasokan
Manajemen rantai pasokanManajemen rantai pasokan
Manajemen rantai pasokan
 
Logistic management
Logistic managementLogistic management
Logistic management
 
Logistics management
Logistics management Logistics management
Logistics management
 
Supply chain operations reference Model
Supply chain operations reference ModelSupply chain operations reference Model
Supply chain operations reference Model
 
Supply Chain Management And Logistics PowerPoint Presentation Slides
Supply Chain Management And Logistics PowerPoint Presentation SlidesSupply Chain Management And Logistics PowerPoint Presentation Slides
Supply Chain Management And Logistics PowerPoint Presentation Slides
 
Supply Chain Council
Supply Chain CouncilSupply Chain Council
Supply Chain Council
 
Strategic Sourcing & E Procurement
Strategic Sourcing & E ProcurementStrategic Sourcing & E Procurement
Strategic Sourcing & E Procurement
 
Understanding Supplier Relationship Management in SCM | AIMS UK
Understanding Supplier Relationship Management in SCM | AIMS UKUnderstanding Supplier Relationship Management in SCM | AIMS UK
Understanding Supplier Relationship Management in SCM | AIMS UK
 
Scor model
Scor modelScor model
Scor model
 
Logistik dan distribusi 5 desember 2011
Logistik dan distribusi 5 desember 2011Logistik dan distribusi 5 desember 2011
Logistik dan distribusi 5 desember 2011
 

Similar to Scor

WSO2 and Agile Path - How the WSO2 Governance Registry is being used for a k...
 WSO2 and Agile Path - How the WSO2 Governance Registry is being used for a k... WSO2 and Agile Path - How the WSO2 Governance Registry is being used for a k...
WSO2 and Agile Path - How the WSO2 Governance Registry is being used for a k...
WSO2
 
April 20 Briefing With Team
April 20 Briefing With TeamApril 20 Briefing With Team
April 20 Briefing With Team
William Francis
 

Similar to Scor (20)

Traceability Beyond Source Code: An Elusive Target?
Traceability Beyond Source Code: An Elusive Target?Traceability Beyond Source Code: An Elusive Target?
Traceability Beyond Source Code: An Elusive Target?
 
WSO2 and Agile Path - How the WSO2 Governance Registry is being used for a k...
 WSO2 and Agile Path - How the WSO2 Governance Registry is being used for a k... WSO2 and Agile Path - How the WSO2 Governance Registry is being used for a k...
WSO2 and Agile Path - How the WSO2 Governance Registry is being used for a k...
 
PLM Implementation
PLM ImplementationPLM Implementation
PLM Implementation
 
April 20 Briefing With Team
April 20 Briefing With TeamApril 20 Briefing With Team
April 20 Briefing With Team
 
Standards metadata management - version control and its governance
Standards metadata management - version control and its governanceStandards metadata management - version control and its governance
Standards metadata management - version control and its governance
 
ARC's Sid Snitkin Asset Lifecycle Management @ ARC Industry Forum 2010
ARC's Sid Snitkin Asset Lifecycle Management @ ARC Industry Forum 2010ARC's Sid Snitkin Asset Lifecycle Management @ ARC Industry Forum 2010
ARC's Sid Snitkin Asset Lifecycle Management @ ARC Industry Forum 2010
 
How to Manage APIs in your Enterprise for Maximum Reusability and Governance
How to Manage APIs in your Enterprise for Maximum Reusability and GovernanceHow to Manage APIs in your Enterprise for Maximum Reusability and Governance
How to Manage APIs in your Enterprise for Maximum Reusability and Governance
 
How to Manage APIs in your Enterprise for Maximum Reusability and Governance
How to Manage APIs in your Enterprise for Maximum Reusability and GovernanceHow to Manage APIs in your Enterprise for Maximum Reusability and Governance
How to Manage APIs in your Enterprise for Maximum Reusability and Governance
 
Analyst360 2
Analyst360 2Analyst360 2
Analyst360 2
 
Business analyst| Murex training at Analyst360
Business analyst| Murex training at Analyst360Business analyst| Murex training at Analyst360
Business analyst| Murex training at Analyst360
 
Hyperledger Austin meetup July 10, 2018
Hyperledger Austin meetup July 10, 2018Hyperledger Austin meetup July 10, 2018
Hyperledger Austin meetup July 10, 2018
 
Oracle - Hyperledger Silicon Valley meetup, June 20, 2018
Oracle - Hyperledger Silicon Valley meetup, June 20, 2018Oracle - Hyperledger Silicon Valley meetup, June 20, 2018
Oracle - Hyperledger Silicon Valley meetup, June 20, 2018
 
Just the Job: Employing Solr for Recruitment Search -Charlie Hull
Just the Job: Employing Solr for Recruitment Search -Charlie Hull Just the Job: Employing Solr for Recruitment Search -Charlie Hull
Just the Job: Employing Solr for Recruitment Search -Charlie Hull
 
Discover Rootstock ERP: Practical Tips to Manage Manufacturing Quality Across...
Discover Rootstock ERP: Practical Tips to Manage Manufacturing Quality Across...Discover Rootstock ERP: Practical Tips to Manage Manufacturing Quality Across...
Discover Rootstock ERP: Practical Tips to Manage Manufacturing Quality Across...
 
ITIL service transition
ITIL service transitionITIL service transition
ITIL service transition
 
ERP II Overview.ppt
ERP II Overview.pptERP II Overview.ppt
ERP II Overview.ppt
 
KEOGH Introduction 2010
KEOGH Introduction 2010KEOGH Introduction 2010
KEOGH Introduction 2010
 
Cloud and Network Transformation using DevOps methodology : Cisco Live 2015
Cloud and Network Transformation using DevOps methodology : Cisco Live 2015Cloud and Network Transformation using DevOps methodology : Cisco Live 2015
Cloud and Network Transformation using DevOps methodology : Cisco Live 2015
 
LeanCor Logistics Webinar: 5 Critical Components of a Lean Logistics Strategy
LeanCor Logistics Webinar: 5 Critical Components of a Lean Logistics StrategyLeanCor Logistics Webinar: 5 Critical Components of a Lean Logistics Strategy
LeanCor Logistics Webinar: 5 Critical Components of a Lean Logistics Strategy
 
DCOR.pdf
DCOR.pdfDCOR.pdf
DCOR.pdf
 

Recently uploaded

83778-77756 ( HER.SELF ) Brings Call Girls In Laxmi Nagar
83778-77756 ( HER.SELF ) Brings Call Girls In Laxmi Nagar83778-77756 ( HER.SELF ) Brings Call Girls In Laxmi Nagar
83778-77756 ( HER.SELF ) Brings Call Girls In Laxmi Nagar
dollysharma2066
 
Rekha Agarkar Escorts Service Kollam ❣️ 7014168258 ❣️ High Cost Unlimited Har...
Rekha Agarkar Escorts Service Kollam ❣️ 7014168258 ❣️ High Cost Unlimited Har...Rekha Agarkar Escorts Service Kollam ❣️ 7014168258 ❣️ High Cost Unlimited Har...
Rekha Agarkar Escorts Service Kollam ❣️ 7014168258 ❣️ High Cost Unlimited Har...
nirzagarg
 
Madiwala Call Girls: 🍓 7737669865 🍓 High Profile Model Escorts | Bangalore Es...
Madiwala Call Girls: 🍓 7737669865 🍓 High Profile Model Escorts | Bangalore Es...Madiwala Call Girls: 🍓 7737669865 🍓 High Profile Model Escorts | Bangalore Es...
Madiwala Call Girls: 🍓 7737669865 🍓 High Profile Model Escorts | Bangalore Es...
amitlee9823
 
➥🔝 7737669865 🔝▻ narsinghpur Call-girls in Women Seeking Men 🔝narsinghpur🔝 ...
➥🔝 7737669865 🔝▻ narsinghpur Call-girls in Women Seeking Men  🔝narsinghpur🔝  ...➥🔝 7737669865 🔝▻ narsinghpur Call-girls in Women Seeking Men  🔝narsinghpur🔝  ...
➥🔝 7737669865 🔝▻ narsinghpur Call-girls in Women Seeking Men 🔝narsinghpur🔝 ...
nirzagarg
 
Call Girls Bangalore Just Call 👗 7737669865 👗 Top Class Call Girl Service Ban...
Call Girls Bangalore Just Call 👗 7737669865 👗 Top Class Call Girl Service Ban...Call Girls Bangalore Just Call 👗 7737669865 👗 Top Class Call Girl Service Ban...
Call Girls Bangalore Just Call 👗 7737669865 👗 Top Class Call Girl Service Ban...
amitlee9823
 
Call Girls Kanakapura Road Just Call 👗 7737669865 👗 Top Class Call Girl Servi...
Call Girls Kanakapura Road Just Call 👗 7737669865 👗 Top Class Call Girl Servi...Call Girls Kanakapura Road Just Call 👗 7737669865 👗 Top Class Call Girl Servi...
Call Girls Kanakapura Road Just Call 👗 7737669865 👗 Top Class Call Girl Servi...
amitlee9823
 
Top Rated Call Girls Vashi : 9920725232 We offer Beautiful and sexy Call Girl...
Top Rated Call Girls Vashi : 9920725232 We offer Beautiful and sexy Call Girl...Top Rated Call Girls Vashi : 9920725232 We offer Beautiful and sexy Call Girl...
Top Rated Call Girls Vashi : 9920725232 We offer Beautiful and sexy Call Girl...
amitlee9823
 
Top Rated Call Girls South Mumbai : 9920725232 We offer Beautiful and sexy Ca...
Top Rated Call Girls South Mumbai : 9920725232 We offer Beautiful and sexy Ca...Top Rated Call Girls South Mumbai : 9920725232 We offer Beautiful and sexy Ca...
Top Rated Call Girls South Mumbai : 9920725232 We offer Beautiful and sexy Ca...
amitlee9823
 
一比一原版(PU学位证书)普渡大学毕业证学历认证加急办理
一比一原版(PU学位证书)普渡大学毕业证学历认证加急办理一比一原版(PU学位证书)普渡大学毕业证学历认证加急办理
一比一原版(PU学位证书)普渡大学毕业证学历认证加急办理
ezgenuh
 
➥🔝 7737669865 🔝▻ Asansol Call-girls in Women Seeking Men 🔝Asansol🔝 Escorts...
➥🔝 7737669865 🔝▻ Asansol Call-girls in Women Seeking Men  🔝Asansol🔝   Escorts...➥🔝 7737669865 🔝▻ Asansol Call-girls in Women Seeking Men  🔝Asansol🔝   Escorts...
➥🔝 7737669865 🔝▻ Asansol Call-girls in Women Seeking Men 🔝Asansol🔝 Escorts...
amitlee9823
 
➥🔝 7737669865 🔝▻ Bhiwandi Call-girls in Women Seeking Men 🔝Bhiwandi🔝 Escor...
➥🔝 7737669865 🔝▻ Bhiwandi Call-girls in Women Seeking Men  🔝Bhiwandi🔝   Escor...➥🔝 7737669865 🔝▻ Bhiwandi Call-girls in Women Seeking Men  🔝Bhiwandi🔝   Escor...
➥🔝 7737669865 🔝▻ Bhiwandi Call-girls in Women Seeking Men 🔝Bhiwandi🔝 Escor...
amitlee9823
 

Recently uploaded (20)

What Does The Engine Malfunction Reduced Power Message Mean For Your BMW X5
What Does The Engine Malfunction Reduced Power Message Mean For Your BMW X5What Does The Engine Malfunction Reduced Power Message Mean For Your BMW X5
What Does The Engine Malfunction Reduced Power Message Mean For Your BMW X5
 
How To Troubleshoot Mercedes Blind Spot Assist Inoperative Error
How To Troubleshoot Mercedes Blind Spot Assist Inoperative ErrorHow To Troubleshoot Mercedes Blind Spot Assist Inoperative Error
How To Troubleshoot Mercedes Blind Spot Assist Inoperative Error
 
83778-77756 ( HER.SELF ) Brings Call Girls In Laxmi Nagar
83778-77756 ( HER.SELF ) Brings Call Girls In Laxmi Nagar83778-77756 ( HER.SELF ) Brings Call Girls In Laxmi Nagar
83778-77756 ( HER.SELF ) Brings Call Girls In Laxmi Nagar
 
John Deere Tractors 6130M 6140M Diagnostic Manual
John Deere Tractors  6130M 6140M Diagnostic ManualJohn Deere Tractors  6130M 6140M Diagnostic Manual
John Deere Tractors 6130M 6140M Diagnostic Manual
 
John Deere 335 375 385 435 Service Repair Manual
John Deere 335 375 385 435 Service Repair ManualJohn Deere 335 375 385 435 Service Repair Manual
John Deere 335 375 385 435 Service Repair Manual
 
Rekha Agarkar Escorts Service Kollam ❣️ 7014168258 ❣️ High Cost Unlimited Har...
Rekha Agarkar Escorts Service Kollam ❣️ 7014168258 ❣️ High Cost Unlimited Har...Rekha Agarkar Escorts Service Kollam ❣️ 7014168258 ❣️ High Cost Unlimited Har...
Rekha Agarkar Escorts Service Kollam ❣️ 7014168258 ❣️ High Cost Unlimited Har...
 
Madiwala Call Girls: 🍓 7737669865 🍓 High Profile Model Escorts | Bangalore Es...
Madiwala Call Girls: 🍓 7737669865 🍓 High Profile Model Escorts | Bangalore Es...Madiwala Call Girls: 🍓 7737669865 🍓 High Profile Model Escorts | Bangalore Es...
Madiwala Call Girls: 🍓 7737669865 🍓 High Profile Model Escorts | Bangalore Es...
 
➥🔝 7737669865 🔝▻ narsinghpur Call-girls in Women Seeking Men 🔝narsinghpur🔝 ...
➥🔝 7737669865 🔝▻ narsinghpur Call-girls in Women Seeking Men  🔝narsinghpur🔝  ...➥🔝 7737669865 🔝▻ narsinghpur Call-girls in Women Seeking Men  🔝narsinghpur🔝  ...
➥🔝 7737669865 🔝▻ narsinghpur Call-girls in Women Seeking Men 🔝narsinghpur🔝 ...
 
Call Girls Bangalore Just Call 👗 7737669865 👗 Top Class Call Girl Service Ban...
Call Girls Bangalore Just Call 👗 7737669865 👗 Top Class Call Girl Service Ban...Call Girls Bangalore Just Call 👗 7737669865 👗 Top Class Call Girl Service Ban...
Call Girls Bangalore Just Call 👗 7737669865 👗 Top Class Call Girl Service Ban...
 
Call Girls Kanakapura Road Just Call 👗 7737669865 👗 Top Class Call Girl Servi...
Call Girls Kanakapura Road Just Call 👗 7737669865 👗 Top Class Call Girl Servi...Call Girls Kanakapura Road Just Call 👗 7737669865 👗 Top Class Call Girl Servi...
Call Girls Kanakapura Road Just Call 👗 7737669865 👗 Top Class Call Girl Servi...
 
Top Rated Call Girls Vashi : 9920725232 We offer Beautiful and sexy Call Girl...
Top Rated Call Girls Vashi : 9920725232 We offer Beautiful and sexy Call Girl...Top Rated Call Girls Vashi : 9920725232 We offer Beautiful and sexy Call Girl...
Top Rated Call Girls Vashi : 9920725232 We offer Beautiful and sexy Call Girl...
 
BOOK FARIDABAD CALL GIRL(VIP Sunny Leone) @8168257667 BOOK 24/7
BOOK FARIDABAD CALL GIRL(VIP Sunny Leone) @8168257667 BOOK  24/7BOOK FARIDABAD CALL GIRL(VIP Sunny Leone) @8168257667 BOOK  24/7
BOOK FARIDABAD CALL GIRL(VIP Sunny Leone) @8168257667 BOOK 24/7
 
Is Your BMW PDC Malfunctioning Discover How to Easily Reset It
Is Your BMW PDC Malfunctioning Discover How to Easily Reset ItIs Your BMW PDC Malfunctioning Discover How to Easily Reset It
Is Your BMW PDC Malfunctioning Discover How to Easily Reset It
 
Top Rated Call Girls South Mumbai : 9920725232 We offer Beautiful and sexy Ca...
Top Rated Call Girls South Mumbai : 9920725232 We offer Beautiful and sexy Ca...Top Rated Call Girls South Mumbai : 9920725232 We offer Beautiful and sexy Ca...
Top Rated Call Girls South Mumbai : 9920725232 We offer Beautiful and sexy Ca...
 
一比一原版(PU学位证书)普渡大学毕业证学历认证加急办理
一比一原版(PU学位证书)普渡大学毕业证学历认证加急办理一比一原版(PU学位证书)普渡大学毕业证学历认证加急办理
一比一原版(PU学位证书)普渡大学毕业证学历认证加急办理
 
➥🔝 7737669865 🔝▻ Asansol Call-girls in Women Seeking Men 🔝Asansol🔝 Escorts...
➥🔝 7737669865 🔝▻ Asansol Call-girls in Women Seeking Men  🔝Asansol🔝   Escorts...➥🔝 7737669865 🔝▻ Asansol Call-girls in Women Seeking Men  🔝Asansol🔝   Escorts...
➥🔝 7737669865 🔝▻ Asansol Call-girls in Women Seeking Men 🔝Asansol🔝 Escorts...
 
Call Girls in Malviya Nagar Delhi 💯 Call Us 🔝9205541914 🔝( Delhi) Escorts Ser...
Call Girls in Malviya Nagar Delhi 💯 Call Us 🔝9205541914 🔝( Delhi) Escorts Ser...Call Girls in Malviya Nagar Delhi 💯 Call Us 🔝9205541914 🔝( Delhi) Escorts Ser...
Call Girls in Malviya Nagar Delhi 💯 Call Us 🔝9205541914 🔝( Delhi) Escorts Ser...
 
John Deere 7430 7530 Tractors Diagnostic Service Manual W.pdf
John Deere 7430 7530 Tractors Diagnostic Service Manual W.pdfJohn Deere 7430 7530 Tractors Diagnostic Service Manual W.pdf
John Deere 7430 7530 Tractors Diagnostic Service Manual W.pdf
 
Connaught Place, Delhi Call girls :8448380779 Model Escorts | 100% verified
Connaught Place, Delhi Call girls :8448380779 Model Escorts | 100% verifiedConnaught Place, Delhi Call girls :8448380779 Model Escorts | 100% verified
Connaught Place, Delhi Call girls :8448380779 Model Escorts | 100% verified
 
➥🔝 7737669865 🔝▻ Bhiwandi Call-girls in Women Seeking Men 🔝Bhiwandi🔝 Escor...
➥🔝 7737669865 🔝▻ Bhiwandi Call-girls in Women Seeking Men  🔝Bhiwandi🔝   Escor...➥🔝 7737669865 🔝▻ Bhiwandi Call-girls in Women Seeking Men  🔝Bhiwandi🔝   Escor...
➥🔝 7737669865 🔝▻ Bhiwandi Call-girls in Women Seeking Men 🔝Bhiwandi🔝 Escor...
 

Scor

  • 1. This presentation is the exclusive property of the Supply Chain Council. Copyright © Supply Chain Council. 2006. All rights reserved. The marks SCOR®, CCOR™, DCOR™ and SCOR Roadmap™ are the exclusive property of the Supply Chain Council. SCOR Framework Introducing all elements of the Supply Chain reference model: Standard processes, metrics and best practices
  • 2. 2Copyright © Supply Chain Council, 2008. All rights reserved SCOR Framework Workshop • Understand the History and Context of SCOR • Learn the Components of the SCOR Framework • Process Nomenclature • Process Metrics • Process Best Practices • Understand how to model a Supply-Chain with SCOR • Understand how to characterize a Supply-Chain with SCOR metrics • Apply the SCOR framework using a simplified SCOR Project Roadmap 2
  • 3. 3Copyright © Supply Chain Council, 2008. All rights reserved Supply-Chain Council • The SCC is an independent, not-for-profit, trade association • Membership open to all companies and organizations • Focus is on research, application and advancement and advancing state-of-the-art supply chain management systems and practices • Developer and endorser of the Supply Chain Operations Reference (SCOR®) as a cross-industry standard for supply chain management • Offers Training, Certification, Benchmarking, Research, Team Development, Coaching, and Cross-standard Integration focused on the SCOR® framework • Founded in 1996 • Approaching 1000 Association Members • Chapters in North America, Europe, Japan, South Africa, Latin America, Australia/New Zealand, South East Asia and Greater China, with developing Chapters India and Middle East Driving value through the use of SCOR® 3
  • 4. 4 Customerprocesses Supplierprocesses Product/Portfolio Management Supply Chain SCOR ® Product Design DCOR™ Sales & Support CCOR™ Customerprocesses Supplierprocesses Product/Portfolio Management Supply Chain SCOR ® Product Design DCOR™ Sales & Support CCOR™ Copyright © Supply Chain Council, 2008. All rights reserved Supply-Chain 4
  • 5. 5Copyright © Supply Chain Council, 2008. All rights reserved Supply-Chain 5 Customerprocesses Supplierprocesses Supply Chain Customerprocesses Supplierprocesses Supply Chain Process, arrow indicates material flow direction Process, no material flow Information flow DeliverMakeSource ReturnReturn Plan
  • 6. 6Copyright © Supply Chain Council, 2008. All rights reserved SCOR: A Process Framework 6 • Process frameworks deliver the well-known concepts of business process reengineering, benchmarking, and best practices into a cross-functional framework • Standard processes: Plan, Source, Make, Deliver, Return, Enable • Standard metrics: Perfect Order Fulfillment, Cash-to-Cash Cycle Time, Cost of Goods Sold, Order Fulfillment Cycle Time, etcetera • Standard practices: EDI, CPFR, Cross-Training, Sales & Operations Planning, etcetera • Pre-defined relationships between processes, metrics and practices and inputs and outputs
  • 7. 7Copyright © Supply Chain Council, 2008. All rights reserved Capture the ‘As-is’ business activity structure and derive the future ‘To-be’ state Quantify the operational performance of similar companies and establish internal targets based on ‘best in class’ results Characterize the management practices and software solutions that result in superior performance Capture the ‘As-is’ business activity structure and derive the future ‘To-be’ state Quantify the operational performance of similar companies and establish internal targets based on ‘best in class’ results Characterize the management practices and software solutions that result in superior performance Business Process Re-Engineering Benchmarking Best Practices Analysis Process Reference Framework Combines Best Techniques 7 • 3 techniques become 1 integrated approach
  • 8. 8Copyright © Supply Chain Council, 2008. All rights reserved End-to-End Supply Chain 8 Supplier CustomerSuppliers’ Supplier Source Internal or External Internal or External Your Company Return Deliver MakeSource Return Plan Deliver Return Source Return MakeSource Return Plan Deliver Return DeliverMake Plan Return Return Customers’ Customer SCOR reference model • Whether from Cow to Cone or from Rock to Ring SCOR is not limited by organizational boundaries
  • 9. 9Copyright © Supply Chain Council, 2008. All rights reserved End-to-End Supply Chain 9 Customer’s CustomerCustomerMP3 CompanySupplierSupplier’s Supplier Sub assemblies Manufacturer Retailer ConsumerComponents SourceDeliverSourceDeliverMakeSourceDeliverMakeSourceDeliverMakeSource Process, arrow indicates material flow direction
  • 10. 10 Level 1 Level 2 Level 3 Level 4 Level 5 Scope Configuration Activity Workflow Transactions Differentiates Business Differentiates Complexity Names Tasks Sequences Steps Links Transactions Defines Scope Differentiates Capabilities Links, Metrics, Tasks and Practices Job Details Details of Automation Framework Language Framework Language Framework Language Industry or Company Language Technology Specific Language Copyright © Supply Chain Council, 2008. All rights reserved EDI XML SCOR Hierarchy 10 S1 Source Stocked Product S Source S1.2 Receive Product Standard SCOR practices Company/Industry definitions
  • 11. 11Copyright © Supply Chain Council, 2008. All rights reserved Level 1 Level 2 Level 3 Level 4 Level 5 Scope Configuration Activity Workflow Transactions Differentiates Business Differentiates Complexity Names Tasks Sequences Steps Links Transactions Defines Scope Differentiates Capabilities Links, Metrics, Tasks and Practices Job Details Details of Automation CxO (COO, CIO) EVP SVP SVP VP VP Director Line Manager Manager Team Lead Team Lead Individuals Programmer Organization focused Activity focused Organizational Hierarchy 11 EDI XML S1 Source Stocked Product S Source S1.2 Receive Product
  • 12. 12Copyright © Supply Chain Council, 2008. All rights reserved SCOR Process Codification 12 • SCOR processes have unique identifiers: 1. One capital only are level 1 processes: P, S, M, D and R (5 in total) 2. A capital plus a number are level 2: P1, S2, M3, D2, D4 (15 in total) Two groups of exceptions for level 2: • Enable: EP, ES, EM, ED and ER (5 in total) and • Return: SR1, DR1, SR2, DR2, SR3, DR3 (6 in total) 3. A capital plus a number, a period and a number are level 3 processes: P1.1, P1.2, S2.1, M1.5, D3.12 (111 processes in total) Two groups of exceptions for level 3: • Enable: EP.1, ES.3, EM.4, ED.8, ER.1 (47 in total) • Return: SR1.1, DR1.3, SR2.2, DR2.4, SR3.5, DR3.1 (27 in total) • X = level 1, Xn = level 2, Xn.m = level 3
  • 13. 13 750g minced steak 1 onion (rings) 1 tsp Worcestershire sauce 4 sesame seed buns 2 tbsp mustard 10 shredded lettuce leaves 2 sliced tomatoes 2 sliced dill pickles 10 thin slices Swiss cheese Salt and pepper Copyright © Supply Chain Council, 2008. All rights reserved Exercises: The Dinner Party • The supply chain used for the exercises is a dinner party • You will host a party this weekend with 25-40 of your dearest friends • You will serve them burgers from your grill (barbecue) • You are responsible for organizing the event, ingredients, grill, tools and utensils and general well-being of your guests • We will be using “The Dinner Party” through the rest of today to exercise different modeling characteristics • Ingredients of a burger:
  • 14. 14Copyright © Supply Chain Council, 2008. All rights reserved Execution Processes 14 Customerprocesses Supplierprocesses Supply Chain Customerprocesses Supplierprocesses Supply Chain DeliverMakeSource ReturnReturn Plan • Processes: Source, Make and Deliver • Objective: value-add, revenue generating
  • 15. 15Copyright © Supply Chain Council, 2008. All rights reserved Level: Different capabilities Stocked Product (S1, M1, D1) • Inventory Driven (Plan) • Standard Material Orders • High Fill-rate, short turnaround Make-to-Order (S2, M2, D2) • Customer Order Driven • Configurable Materials • Longer turn-around times Engineer-to-Order (S3, M3, D3) • Customer Requirements Driven • Sourcing New Materials • Longest long lead-times, low fill rates D1R1 I1M1S1 D1 I2 R1 D2R2 D2 S1 M2S2 I3 R1 D3R3 R1 R2 D3 R1 M3S3 S1 S2 Capability Models 15
  • 16. 16Copyright © Supply Chain Council, 2008. All rights reserved Source (Process ID: S) • Objectives of this process: • The ordering, delivery, receipt and transfer of raw material items, subassemblies, product and/or services. • Key processes comprehended: • Schedule product deliveries • Receive, inspect, and hold materials • Issue material to Make or Deliver processes • Supplier/Vendor Agreements • Vendor certification and feedback, sourcing quality • Manage Raw Materials inventories • Freight, import/export documentation • Hint: Receiving processes? Probably Source in SCOR 16
  • 17. 17Copyright © Supply Chain Council, 2008. All rights reserved Source Configurations • Configurations: • Source Stocked Product (Process ID: S1) • The ordering and receiving of existing products, components and services from existing contracts, based on requirement plans. • Source Make-to-Order (Process ID: S2) • The ordering and receiving of existing products, components and services for a unique and identified customer order. • Source Engineer-to-Order (Process ID: S3) • The selection, ordering and receiving of specialized products or services that are designed and/or built based on the requirements or specifications of a particular customer order or contract. 17
  • 18. 18Copyright © Supply Chain Council, 2008. All rights reserved Stocked Product (S1) Make-to-Order (S2) Engineer-to-Order (S3) S2.1 Schedule Product Deliveries S3.1 Identify Sources of Supply S3.2 Select Final Supplier(s) and Negotiate S1.1 Schedule Product Deliveries S3.3 Schedule Product Deliveries S1.2 Receive Product S2.2 Receive Product S3.4 Receive Product S1.3 Verify Product S2.3 Verify Product S3.5 Verify Product S1.4 Transfer Product S2.4 Transfer Product S3.6 Transfer Product S1.5 Authorize Supplier Payment S2.5 Authorize Supplier Payment S3.7 Authorize Supplier Payment Source Process Elements 18
  • 19. 21Copyright © Supply Chain Council, 2008. All rights reserved Make (Process ID: M) 21 • Objectives of this process: • The process of adding value to products through mixing, separating, forming, machining, and chemical processes. • Key Processes Comprehended: • Schedule production, request and receive material from Source and/or Make processes • Manufacture, assemble/disassemble and test product, package, hold/release product • Managing product quality and engineering changes • Managing facilities and equipment, production status workflow and capacity management • Manage Work-In-Process (WIP) inventories • Hint: Itemnumber change? Probably Make in SCOR
  • 20. 22Copyright © Supply Chain Council, 2008. All rights reserved Make Configurations • Make-to-Stock (Process ID: M1) • The making of standard products and services. Planning (Plan) processes determine what, how much and when to make. • Make-to-Order (Process ID: M2) • The making of standard or configurable products and services for unique customer orders. Customer orders determine what, how much and when to make. Customer orders can be traced throughout the Make process. • Engineer-to-Order (Process ID: M3) • The making of specialized products or services that are fully or partially designed and made based on the unique requirements and specifications of a particular customer order or contract. Customer orders and specifications can be traced throughout the Make process. 22
  • 21. 23Copyright © Supply Chain Council, 2008. All rights reserved Make-to-Stock (M1) Make-to-Order (M2) Engineer-to-Order (M3) M1.1 Schedule Production Activities M2.1 Schedule Production Activities M3.1 Finalize Production Engineering M3.2 Schedule Production Activities M1.2 Issue Material M2.2 Issue Sourced/In- Process Product M3.3 Issue Sourced/In-Process Product M1.3 Produce and Test M2.3 Produce and Test M3.4 Produce and Test M1.4 Package M2.4 Package M3.5 Package M1.5 Stage Product M2.5 Stage Finished Product M3.6 Stage Finished Product M1.6 Release Product to Deliver M2.6 Release Finished Product to Deliver M3.7 Release Product to Deliver M1.7 Waste Disposal M2.7 Waste Disposal M3.8 Waste Disposal Make Process Elements 23
  • 22. 2525Copyright © Supply Chain Council, 2008. All rights reserved Deliver (Process ID: D) • Objectives of this process: • Perform customer-facing order management and order fulfillment activities including outbound logistics. • Key processes comprehended: • Product, service and price quotations • Order entry and maintenance • Order consolidation, picking, packing, labeling and shipping • Import/export documentation • Customer delivery and installation • Logistics and Freight Management • Manage Finished Goods inventories • Hint: Order taking or Shipping? Probably Deliver in SCOR
  • 23. 26Copyright © Supply Chain Council, 2008. All rights reserved Deliver Configurations 26 • Deliver Stocked Product (Process ID: D1) • The delivery of standard products (and services) that are maintained in a finished goods state prior to the receipt of a customer order. • Deliver Make-to-Order Product (Process ID: D2) • The delivery of standard or configurable products and services that are obtained (Source or Make) for a customer order. • Deliver Engineer-to-Order Product (Process ID: D3) • The delivery of specialized products and services that have been fully or partially designed in negotiation and based on requirements from a customer order and customer provided specifications • Deliver Retail Product (Process ID: D4) • The delivery of standards goods in a retail store
  • 24. 27Copyright © Supply Chain Council, 2008. All rights reserved Deliver Process Elements (1/3) 27 Stocked Products (D1) Make-to-Order (D2) Engineer-to-Order (D3) D1.1 Process Inquiry & Quote D2.1 Process Inquiry & Quote D3.1 Obtain & Respond to RFP/RFQ¹ D1.2 Receive, Enter & Validate Order D2.2 Receive, Configure, Enter & Validate Order D3.2 Negotiate & Receive Contract D1.3 Reserve Inventory & Determine Delivery Date D2.3 Reserve Inventory & Determine Delivery Date D3.3 Enter Order, Commit Resources & Launch Program D1.4 Consolidate Orders D2.4 Consolidate Orders D3.4 Schedule Installation D1.5 Build Loads D2.5 Build Loads D3.5 Build Loads D1.6 Route Shipments D2.6 Route Shipments D3.6 Route Shipments D1.7 Select Carriers & Rate Shipments D2.7 Select Carriers & Rate Shipments D3.7 Select Carriers & Rate Shipments ¹ RFP = Request for Proposal, RFQ = Request for Quote
  • 25. 28Copyright © Supply Chain Council, 2008. All rights reserved Deliver Process Elements (2/3) 28 Stocked Products (D1) Make-to-Order (D2) Engineer-to-Order (D3) D1.8 Receive Product from Source or Make D2.8 Receive Product from Source or Make D3.8 Receive Product from Source or Make D1.9 Pick Product D2.9 Pick Product D3.9 Pick Product D1.10 Pack Product D2.10 Pack Product D3.10 Pack Product D1.11 Load Product & Create Documentation D2.11 Load Product & Create Documentation D3.11 Load Product & Create Documentation D1.12 Ship Product D2.12 Ship Product D3.12 Ship Product D1.13 Receive & Verify Product by Customer D1.13 Receive & Verify Product by Customer D1.13 Receive & Verify Product by Customer D1.14 Install Product D2.14 Install Product D3.14 Install Product D1.15 Invoice D2.15 Invoice D3.15 Invoice
  • 26. 29Copyright © Supply Chain Council, 2008. All rights reserved Deliver Process Elements (3/3) • The Retail supply chain model does not match up to the Manufacturing supply chain model, therefore processes are quite different 29 Retail Products (D4) D4.1 Generate Stocking Schedule D4.2 Receive Product at Store D4.3 Pick Product from Backroom D4.4 Stock Shelf D4.5 Fill Shopping Cart D4.6 Checkout D4.7 Deliver and/or Install
  • 27. 30Copyright © Supply Chain Council, 2008. All rights reserved Control processes: Plan, Enable • Plan and Enable processes prepare the supply-chain to ensure smooth execution • Planning processes balance the need for resources, materials, capacity, etc. with the availability of these resources. This includes prioritization if needed. • Enable processes address 8 control aspects for the supply chain. They monitor compliance, deliver information from other process areas and highlight dependencies on these other process areas. They also support maintenance of relationships with suppliers. 30
  • 28. 31Copyright © Supply Chain Council, 2008. All rights reserved Planning Processes 31 Customerprocesses Supplierprocesses Supply Chain Customerprocesses Supplierprocesses Supply Chain DeliverMakeSource ReturnReturn Plan • Processes: Plan • Objective: Drive/coordinate execution processes
  • 29. 32Copyright © Supply Chain Council, 2008. All rights reserved Plan (Process ID: P) 32 • Objectives of this process: • The process of determining requirements and corrective actions to achieve supply chain objectives • Key Processes Comprehended: • Supply chain revenue planning/forecasting • Materials requirement planning • Factory, repair, maintenance facilities capacity planning • Distribution requirements planning • Manage planning parameters • Hint: Forecasting, S&OP, MRP? Probably Plan in SCOR
  • 30. 33Copyright © Supply Chain Council, 2008. All rights reserved Plan Configurations (1/2) 33 • Plan Supply Chain (Process ID: P1) • Planning overall supply chain targets. Plan Supply Chain drives and coordinates P2, P3, P4 and P5 plans (Compare to “Revenue plan”, or “Budget” in certain industries) • Plan Source (Process ID: P2) • Planning of material ordering and receiving activities. Plan Source calculates which materials need to be available when to support the production plan (P3) and/or the delivery plan (P4). (Compare to “Materials Requirements Plan”) • Plan Make (Process ID: P3) • Planning of production and/or MRO activities. Plan Make ensures the production resources (capacity) are in place as needed and may generate production orders. (Compare to “Production Plan”)
  • 31. 34Copyright © Supply Chain Council, 2008. All rights reserved Plan Configurations (2/2) 34 • Plan Deliver (Process ID: P4) • Planning of order management, material handling and transportation activities. Plan Deliver ensures resources are in place as needed and may generate or recalculate shipping dates based on material availability. (Compare to “Shipment Plan”, “Load Planning”) • Plan Return (Process ID: P5) • Planning of the reverse logistics shipping and material handling capacity. Note: This does not include the maintenance, repair or overhaul activity planning as those are Make processes.
  • 32. 35 Plan Make Plan Source Plan Supply ChainPlan Supply Chain P1.1 P1.2 P1.3 P1.4 P1.1 P1.2 P1.3 P1.4 P2.1 P2.2 P2.3 P2.4 P3.1 P3.2 P3.3 P3.4 2 1 to P3.2 end full cycle begin next cycle Copyright © Supply Chain Council, 2008. All rights reserved Plan Processes • Planning is an iterative process: 1. The output of Plan Supply Chain is the input for Plan Source, Plan Make, Plan Deliver and Plan Return 2. The output of Plan Source, Plan Make, Plan Deliver and Plan Return are inputs for Plan Supply Chain; The output of one cycle is the input for the next cycle 35
  • 33. 36Copyright © Supply Chain Council, 2008. All rights reserved Enable Processes 36 Customerprocesses Supplierprocesses Supply Chain Customerprocesses Supplierprocesses Supply Chain DeliverMakeSource ReturnReturn Plan • Processes: Enable Plan, Enable Source, Enable Make, Enable Deliver and Enable Return
  • 34. 37Copyright © Supply Chain Council, 2008. All rights reserved Enable Processes 37 • Objective: The Enable processes are five groups of processes under Plan, Source, Make , Deliver and Return with 3 distinct types of objectives: 1. Manage process performance 2. Manage process control data 3. Manage process relationships • Key processes comprehended: • Managing business rules and monitoring adherence • Measuring supply chain performance and determine corrective action • Managing risk and environmental impact • Managing the supply chain network and facilities • Hint: Equipment or plant maintenance? Probably Enable
  • 35. 38Copyright © Supply Chain Council, 2008. All rights reserved Enable Categories 38 • Enable Plan (Process ID: EP) • Performance, data and relationship management processes for all types of planning processes: Plan Supply Chain, Plan Source, Plan Make, Plan Deliver and Plan Return. Examples: maintain planning cycles, monitor planning accuracy, manage supply chain risks. • Enable Source (Process ID: ES) • Performance, data and relationship management processes for all receiving activities and supplier related processes. Examples: Monitor supplier performance, maintain what is sourced where. • Enable Make (Process ID: EM) • Enable management processes for manufacturing, repair and overhaul type processes. Examples: BOM maintenance, preventive equipment maintenance, monitoring capacity utilization/shortage.
  • 36. 39Copyright © Supply Chain Council, 2008. All rights reserved Enable Categories 39 • Enable Deliver (Process ID: ED) • Performance, data and relationship management processes for all order management, warehouse and distribution activities and forwarder related processes. Examples: Monitor order management and forwarder performance, maintain a distribution network, managing risk. • Enable Return (Process ID: ER) • Enable management processes for all types of reverse logistics processes: MRO returns, defective product returns and excess inventory returns. Examples: Maintain return approval rules, Maintain issue tracking software, maintain a return distribution network.
  • 37. 40Copyright © Supply Chain Council, 2008. All rights reserved Reverse Processes 40 Customerprocesses Supplierprocesses Supply Chain Customerprocesses Supplierprocesses Supply Chain DeliverMakeSource ReturnReturn Plan • Processes: Return (Source Return, Deliver Return) • Objective: reverse material flows
  • 38. 41Copyright © Supply Chain Council, 2008. All rights reserved Return (Process ID: R) 41 • Objective of this process: • Moving material from customer back through supply chain to address defects in product, ordering, or manufacturing, or to perform upkeep activities. • Key Processes Comprehended • Identification of the need to return a product or asset • Requesting and issuing return authorization • Inspection and disposition decision-making • Transfer/Disposition of product or asset • Managing return transportation capacity • Managing returned material inventories • Hint: Reverse material flow? Probably Return in SCOR
  • 39. 42Copyright © Supply Chain Council, 2008. All rights reserved Return Configurations 42 • Return Defective Products (Process IDs: SR1 and DR1) • The return of products because the product is defective, the wrong product was ordered or shipped. • Return Maintenance, Repair & Overhaul (IDs: SR2 and DR2) • The return of products or assets to perform preventative maintenance, (end-of-life) overhaul or repairs due to breakage/aging with use • Return Excess Products (Process IDs SR3 and DR3) • The return of excess inventories and inventories of product which will be retired (end-of-life excess). The product is new and in original packaging. • SR = Source Return, DR = Deliver Return
  • 40. • Positioning Source Return and Deliver Return • Consider the flow of goods; Notice the positions of Source and Deliver • Now, notice the positions of Source Return and Deliver Return Supplier CustomerMy Company Deliver Return Source Return Source Return Deliver Return CustomerMy Company Deliver Source SourceDeliver Supplier 43Copyright © Supply Chain Council, 2008. All rights reserved Return Configurations 43
  • 41. 44Copyright © Supply Chain Council, 2008. All rights reserved Modeling with SCOR • Drivers for modeling: Why do you model • Business opportunities: • Strategy Development • Merger, Acquisition or Divestiture (Companies or Supply Chains) • Process optimization and Re-engineering • Standardization, Streamlining and Management alignment • New business start-up (Company and Supply Chain start-ups) • Benchmarking • Process Outsourcing • Technology services: • Software implementation (ERP, PLM, QC) • Workflow & Service Oriented Architecture 44
  • 42. 45Copyright © Supply Chain Council, 2008. All rights reserved Different Model Types • SCOR recognizes different types of models. Each serving a different purpose: • Business Scope diagram: Set the scope for a project or organization • Geographic Map (a.k.a. Geo Map): Describes material flows in a geographic context; Highlights node¹ complexity or redundancy • Thread Diagram: Material flow diagram, focused on level 2 process connectivity; Describes high level process complexity or redundancy • Workflow or Process Models: Information, material and work flow diagram at level 3 (or beyond); Highlights information, people and system interaction issues ¹) A node represents a logical or geographic entity in a supply chain. Examples: Warehouse, Factory, Store 45
  • 43. • Steps to create a Business Scope Diagram 1. Create or open the business scope diagram template 2. Identify customers of your organization or project and enter these in the customers column in the scope diagram. 3. Identify and enter the key nodes within your organization or project. A node represents a logical or geographic entity in the supply chain. Consider: Warehouse, Factory, Store, HQ etc. 4. Identify and enter the suppliers of your organization or project 5. Optionally link the nodes to reflect material and/or information flows. Use a different color and/or stroke differentiate material and information flows. Example: 46Copyright © Supply Chain Council, 2008. All rights reserved Creating a Scope Diagram 46 Material and information flow Information flow
  • 44. Supplier My Organization CustomerSupplier My Organization Customer Supplier My Organization Customer 47Copyright © Supply Chain Council, 2008. All rights reserved Creating a Scope Diagram 47 Steps to create a Business Scope Diagram 1. Create or open the business scope diagram template 2. Identify and enter the customers of your project or organization 3. Identify and enter the key nodes within your project or organization 4. Identify and enter the suppliers of your project or organization 5. Optionally link the nodes to reflect material and/or information flows (using different color/stroke) Flash Inc. Battery ltd. Comps Factory DC Retail Inc. mp3 HQ 234 Flash Inc. Battery ltd. Comps Factory DC Retail Inc. mp3 HQ 55 1
  • 45. Suppliers mp3, Inc. Customers Service Providers 48Copyright © Supply Chain Council, 2008. All rights reserved The Result: Scope Diagram 48 Flash Inc. Battery ltd. Components Factory Warehouse Retail, Inc. mp3 HQ Material and information flow Information flow
  • 46. 49Copyright © Supply Chain Council, 2008. All rights reserved Modeling with SCOR 49 Steps to create the Geographic Map: 1. Create geographic context (a.k.a. the map) 2. Draw and name your customers on the map a. Identify the level 2 processes b. List the level 2 processes in the customer on your map 3. Beginning with your customers, repeat this for every node on the map: a. Identify all supplying nodes (where does material come from) b. Draw and name these supplying nodes on the map c. Identify the level 2 processes d. list these in the node on your map e. Draw the material flows (arrows connecting the nodes) Repeat until you have included all your suppliers/nodes
  • 47. 50 Retail, Inc S1, P2 b France Spain UK Germany 2 China India Copyright © Supply Chain Council, 2008. All rights reserved Creating a Geographic Map 50 Steps to create the Geographic Map: 1. Create geographic context (a.k.a. the map) 2. Draw and name your customers on the map a. Identify the level 2 processes b. List the level 2 processes in the customer node 3. Starting with your customers, repeat for each node: a. Identify all supplying nodes b. Draw and name these supplying nodes c. Identify the level 2 processes d. List the level 2 processes in each node e. Draw the material flows (connecting arrows) Repeat until you have included all your suppliers 1 MP3 Factory S1, M1, D1 3 b¹ d¹ Drive Supplier D1, P1, P4 b² d² e² e¹
  • 48. 51 Drive Supplier D1, P1, P4 Battery Supplier D1, P1, P4 Retail, Inc S1, P2 MP3 Factory P3, S1, M1, D1 HQ P1, P2, D2, S2 Copyright © Supply Chain Council, 2008. All rights reserved Result: The Geographic Map 51 Question: No flow from HQ; Why?
  • 49. 52Copyright © Supply Chain Council, 2008. All rights reserved Modeling with SCOR 52 1. Orders are faxed in and entered in OMS 2. Every night the orders are scheduled 3. The orders are released to the factory based on the delivery date offset 4. Factory creates and schedules factory work orders in SFCS 1 D2.2 Receive, Enter, Validate Order D2.3 Reserve Inventory & Determine Delivery Date M2.1 Schedule Production Activities 2 Steps to establish SCOR process models (workflows) 1. Obtain generic descriptions (this is what people describe) 2. Map these generic descriptions to SCOR process IDs (normalize) 3. Create swimming lanes to reflect organizational boundaries 4. Create workflow with these SCOR processes 5. Add description to workflows to reflect inputs/outputs of the processes 6. Optionally add other relevant information
  • 50. 53Copyright © Supply Chain Council, 2008. All rights reserved Elements of a Business Process 53 not in SCOR organization activity business rules technology measurements inputs outputs people metrics best practices geography platform interfaceskills • Process is defined by more than just activity
  • 51. 54Copyright © Supply Chain Council, 2008. All rights reserved Obtaining Generic Descriptions 54 • Staple-Yourself-To-An-Order; • Proven technique to obtain generic language process descriptions: • Follow the logical flow of an order through the process. • Each level 1 process has an order (except Plan): Customer order for Deliver, Production order for Make, Purchase order for Source and Return Authorization for Return. • For each order start with the process of order creation and follow the order and document each activity until the order is completed/closed. • Similarly follow the steps of the planning cycles you encounter. • Finally cover any process you have missed so far; Use your SCOR list of processes as a check-list. • Hint: To obtain generic descriptions for an end-to-end supply chain: Start with Plan, then Deliver, Make, Source.
  • 52. 55Copyright © Supply Chain Council, 2008. All rights reserved Obtaining Generic Descriptions 55 • The purpose of capturing process is to understand it and remove, adjust or repair it where needed • Recognize process characteristics: • 'Measurements': It takes 30 minutes to build… • 'Business rule': The plan is updated weekly… • 'People': This is handled by Joanna on Thursdays … • 'Business rule': This is done to provide .. with .. data.. • 'Inputs' or 'triggers': When we receive the document.. • 'Outputs': We send them the document.. • 'Technology': We print the document from the .. system.. • 'Business rules': We need two copies of the form .. • Verify hearsay statements, to eliminate perception
  • 53. 56Copyright © Supply Chain Council, 2008. All rights reserved SCOR Metrics • Definitions: • Performance Attribute: a characteristic to describe a strategy. Performance attributes serve as classification for KPIs and metrics • Key Performance Indicator (KPI): a metric that is representative to measure the overall performance or state-of-affairs • Metric: a standard for measurement • Measurement: an observation that reduces the • amount of uncertainty about the value of a quantity • SCOR metrics: Diagnostic metrics • Linked to business objectives • Highlight the gap in performance • Change over time is more valuable than a single sample 56
  • 54. 57 Attribute Strategy Reliability (RL) Consistently getting the orders right, product meets quality requirements Responsiveness (RS) The consistent speed of providing products/services to customers Agility (AG) The ability to respond to changes in the market (external influences) Cost (CO) The cost associated with managing and operating the supply chain Assets (AM) The effectiveness in managing the supply chain’s assets in support of fulfillment Copyright © Supply Chain Council, 2008. All rights reserved CustomerInternal Performance Attributes 57 Question: What is/are the most important attributes to achieve your supply chain strategy?
  • 55. 58Copyright © Supply Chain Council, 2008. All rights reserved ‘Levels’ in Metrics • Level 1: Strategic metrics a.k.a. Key Performance Indicators • Measure overall supply chain performance; health of the supply chain • Set the scope and objectives for a supply chain, project or organization • Translate a business problem or strategy into something measurable • Establish the priority or priorities for organization • Level 2: Diagnostic metrics • Measure a part of the supply chain and/or a part of the strategic metric • Provide direction to where problems originate • Caution: Level 2 metrics do not by definition add up to a level 1 metric • Beyond level 1 and 2: all metrics are called level 3 • SCOR does not specify levels for metrics that are not level 1 or 2 • These metrics serve as further diagnostic tools 58
  • 56. 59Copyright © Supply Chain Council, 2008. All rights reserved SCOR Metrics Codification 59 • SCOR metrics have unique identifiers: 1. Two capitals are performance attributes: RL, RS, AG, CO and AM (5) 2. Two capitals, a period the number one (1) and a number are strategic (a.k.a. level 1) metrics: RL.1.1, RS.1.1, AG.1.1, CO.1.1, CO.1.2, AM.1.3 (10 in total) 3. Two capitals, a period the number two (2) and a number are diagnostic (a.k.a. level 2) metrics: RL.2.1, RS.2.1, AG.2.1, CO.2.1, CO.2.2, AM.2.7 (36 in total) 4. Two capitals, a period the number three (3) and a number are diagnostic (or level 3) metrics: RL.3.1, RS.3.1, AG.3.1, CO.3.149, CO.3.151, AM.3.44 (>500) • XX = performance attribute, • XX.1.n = level 1, XX.2.n = level 2, and so on
  • 57. • Measuring strategy: KPIs are strategic (level 1) metrics 60 Attribute Strategic metric Reliability RL.1.1 Perfect Order Fulfillment Responsiveness RS.1.1 Order Fulfillment Cycle Time Agility AG.1.1 Upside Supply Chain Flexibility AG.1.2 Supply Chain Upside Adaptability AG.1.3 Supply Chain Downside Adaptability Cost CO.1.1 Supply Chain Management Cost CO.1.2 Cost of Goods Sold Assets AM.1.1 Cash-to-Cash Cycle Time AM.1.2 Return on Supply Chain Fixed Assets AM.1.3 Return on Working Capital Copyright © Supply Chain Council, 2008. All rights reserved CustomerInternal KPIs; Strategic Metrics 60
  • 58. 61 Metric: RL.1.1 Perfect Order Fulfillment Definition: The percentage of orders delivered on-time, in full. Components of perfect include all items and quantities on- time, using the customer’s definition of on-time, complete documentation and in the right condition Calculation: [Total Perfect Orders] / [Total Number of Orders] Diagnostic Metrics: (examples) • RL.2.1 % Orders Delivered in Full • RL.2.4 Perfect Condition • RL.3.19 % Orders Received Defect Free • RL.3.24 % Orders Received Damage Free Notes: An order is perfect only if all L2/L3 metrics are perfect; An order must be: on-time AND in-full AND right condition AND right documentation Copyright © Supply Chain Council, 2008. All rights reserved Strategic Reliability Metric 61
  • 59. 62 Metric: RS.1.1 Order Fulfillment Cycle Time Definition: The average actual cycle time consistently achieved to fulfill customer orders. The actual cycle time starts with the receipt of the order and ends with the customer acceptance of the delivery. The unit of measure is days. Calculation: [Sum Actual Cycle Times For All Orders Delivered] / [Total Number Of Orders Delivered] Diagnostic Metrics: (examples) • RS.2.2 Make Cycle Time • RS.2.3 Deliver Cycle Time • RS.3.96 Pick Product Cycle Time Notes: Order Fulfillment Cycle Time includes dwell time. Dwell time is the time no value add activities are performed on the order or product, imposed by customer requirements. Copyright © Supply Chain Council, 2008. All rights reserved Strategic Responsiveness Metric 62
  • 60. 63Copyright © Supply Chain Council, 2008. All rights reserved Strategic Agility Metrics 63 Metric: AG.1.1 Upside Supply Chain Flexibility Definition: The number of days required to achieve an unplanned sustainable 20% increase in quantities delivered. Seasonality is not considered unplanned/unforeseen. The unit of measure for flexibility is calendar days. Calculation: The larger of the number of days required to achieve sustainable increase for Source, Make and Deliver Diagnostic Metrics: • AG.2.1 Upside Source Flexibility • AG.2.2 Upside Make Flexibility • AG.2.3 Upside Deliver Flexibility Notes: This metric may have more than one Source, Make and Deliver Flexibility component depending on the complexity of the supply chain.
  • 61. 64Copyright © Supply Chain Council, 2008. All rights reserved Metric: AM.1.1 Cash-to-Cash Cycle Time Definition: The time it takes for cash invested in materials to flow back into the company after finished goods have been delivered to customers. The unit of measure for Cash-to-Cash Cycle Time is calendar days Calculation: [Inventory Days of Supply] + [Days Sales Outstanding] – [Days Payable Outstanding] Diagnostic Metrics: • AM.2.1 Days Sales Outstanding (DSO) • AM.2.2 Inventory Days of Supply (IDOS) • AM.2.3 Days Payable Outstanding (DPO) Notes: For services, the time between paying the resources assigned to a service and receiving payment for the service delivery. Strategic Asset Metrics 64
  • 62. 65Copyright © Supply Chain Council, 2008. All rights reserved Metric: AM.1.2 Return on Supply Chain Fixed Assets Definition: The return an organization receives on its invested capital in supply chain fixed assets. This includes the fixed assets used to Plan, Source, Make, Deliver and Return. Examples of fixed assets include land, buildings, machinery, trucks Calculation: ([Supply Chain Revenue] – [COGS] – [Supply Chain Management Costs]) / [Supply Chain Fixed Assets] Diagnostic Metrics: • AM.3.11 Deliver Fixed Assets Value • AM.3.18 Make Fixed Assets Value • AM.3.20 Plan Fixed Asset Value • AM.3.27 Source Fixed Assets Value Notes: Supply-Chain Revenue is the operating revenue generated from a supply chain. This does not include non-operating revenue, such as investments, etc.. Strategic Asset Metrics 65
  • 63. 66Copyright © Supply Chain Council, 2008. All rights reserved Metrics and Analysis 66 • Levels in metrics help root cause performance issues • Strategic metrics (level 1) can be diagnosed by investigating the level 2 metrics. • Different types of relationships exist between a metric (the ‘parent’) and it’s diagnostic metrics (the ‘children’): 1. The parent is the sum of it’s children (e.g. time and cost) 2. The children are multiplied to calculate the parent (e.g. yield) 3. The relationship is undefined (but can be statistically observed) • Diagnostic metrics don’t necessarily add up to their parents: Order Fulfillment Cycle Time IS NOT the sum of Deliver Cycle Time + Make Cycle Time + Source Cycle Time for most supply chains
  • 64. 67Copyright © Supply Chain Council, 2008. All rights reserved Metrics Data 67 • Each company will need to develop a tool or instructions where to source the data for the SCOR metrics • There are two types of data: • Recorded data; obtain from transactional systems such as ERP (Enterprise Resource Planning), WMS (Warehouse Management System), financial systems, etc. For example: compare time-stamps in these systems to calculate cycle times. • Observed data; obtain through interviews, error logs, audits and/or time- studies. For example the observed percentage of orders requiring additional customer setup in a system, percentage of manual repackaging events on the shipping dock. • There is no easy button
  • 65. 68Copyright © Supply Chain Council, 2008. All rights reserved Scorecards and SCORcards • Definitions • Scorecard: A visual display of the most important information needed to achieve one or more objectives, consolidated and arranged in a single view • Balanced Scorecard: A scorecard providing metrics related to four organizational strategies: financial, customer, internal process, and employee learning and growth • SCORcard: A scorecard providing metrics related to five supply chain strategies: reliability, responsiveness, Agility, cost and assets • Importance • Communicate supply chain priorities • Monitor all strategic areas, not just the top priority 68
  • 66. 69Copyright © Supply Chain Council, 2008. All rights reserved SCORcard Metrics Selection • SCORcard metric requirements: • Measurable and quantifiable Avoid 'feel good' metrics like supplier satisfaction or customer satisfaction, unless they are an aggregation of well-defined detail metrics. Framework-based metrics simplify the selection process. • Linkage to responsibility Avoid metrics that have no impact on performance reviews (supplier or employee), ensure the metric is linked to the (right) process owner at the right level. • Ensure metric is well-defined Multiple interpretations of a metric may lead to 'work-arounds' and negation of the effort. SCOR metrics are pre-defined; limiting the discussion on metric definitions. 69
  • 67. 70Copyright © Supply Chain Council, 2008. All rights reserved Metrics Selection • Interpreting the definitions • Customer facing metrics should be measured as close to the customer experience as possible. • The moment of order submission instead of order entry • Delivered performance instead of shipping performance • Received quality instead of produced or shipped quality • Measure what makes sense: Don’t have data; approximate the missing component until you will be able to obtain the data • Tip: It is not about how you think it should be measured, ask your customer what is important to him/her • And: Internal focused metrics also have a customer 70
  • 68. 71Copyright © Supply Chain Council, 2008. All rights reserved Benchmarking • Definitions • Benchmarking: Comparing an organization’s performance, products, practices, and/or services with those of other organizations that operate in the same or comparable industry • Parity: Being equal in performance; No real advantage over others • Advantage: Being in a favorable position; In a stronger position than • Superior: Being of high rank or quality; Leading • Usage • Establish Goals. Know where you are relative to others (competitors or peers), and express where you're going. • Monitor Performance. Track relative progress you and others (your competitors or peers) make. 71
  • 69. 72Copyright © Supply Chain Council, 2008. All rights reserved Benchmark Requirements 72 • Compare like for like • Using standard metrics A numerical comparison of the performance of two companies in the same industry may not have value when the metric is different. • Measuring the same process/business model Avoid comparing the performance of a make-to-stock process to an engineer-to-order process. The purpose of these processes is different, measure them accordingly. • Demographics Make sure you understand the other organizations in the benchmark. Regional differences, and differences in product, or services may influence results.
  • 70. 73Copyright © Supply Chain Council, 2008. All rights reserved Best Practices 73 • Definitions: • Best practice: "A current, structured, proven and repeatable method for making a positive impact on desired operational results." • Current: Must not be emerging and can not be antiquated • Structured: Has clearly stated Goal, Scope, Process, and Procedure • Proven: Success has been demonstrated in a working environment and can be linked to key metrics • Repeatable: The practice has been proven in multiple environments. • Importance • Alternatives to the way you do business • Equalize the competitive landscape
  • 71. 74Copyright © Supply Chain Council, 2008. All rights reserved Types of Practices • Best practices are Current, structured, proven and repeatable methods for making a positive impact on desired operational results. • Leading practices are innovations adopted by single companies or industries which provide dramatically improved performance in a process, but because of proprietary restrictions, or novelty, are not widely known or adopted. • Worst practices or Poor practices: Practices that are known to produce negative impacts on operational results. 74
  • 72. This presentation is the exclusive property of the Supply Chain Council. Copyright © Supply Chain Council. 2006. All rights reserved. The marks SCOR®, CCOR™, DCOR™ and SCOR Roadmap™ are the exclusive property of the Supply Chain Council. www.supply-chain.org info@supply-chain.org