Download as PDF, PPTX
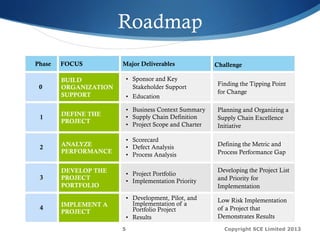
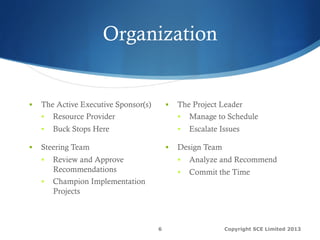
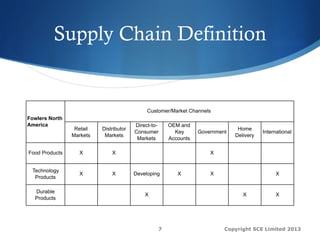
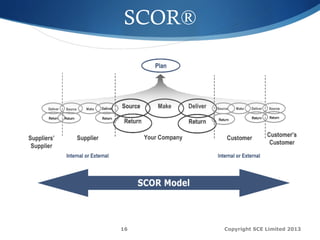
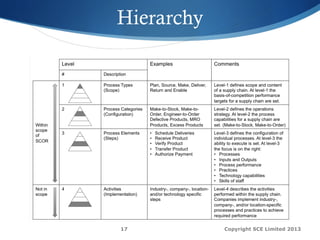
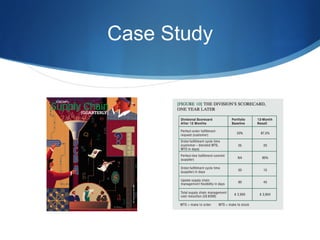


This document outlines a webinar focused on best practices for implementing the SCOR® framework in supply chain improvement initiatives, detailing key principles, metrics, and processes. It includes a roadmap for organization, performance analysis, project development, and implementation strategies, along with a case study showcasing project portfolios and anticipated benefits. Additionally, it emphasizes the importance of organizational learning and offers next steps for individuals and teams interested in adopting SCOR®.


