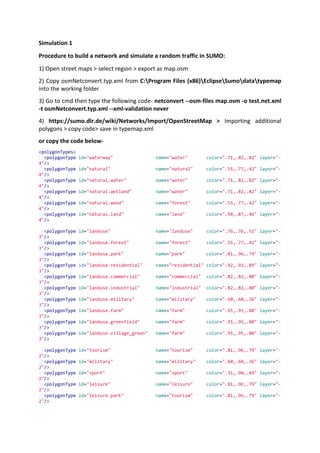
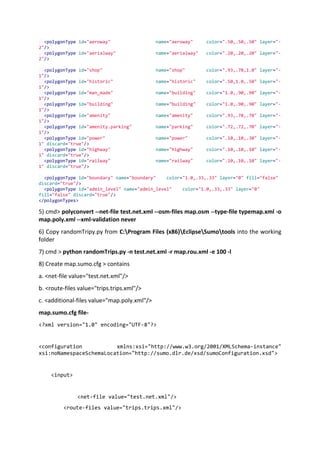
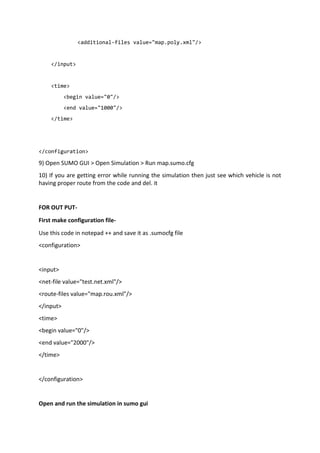
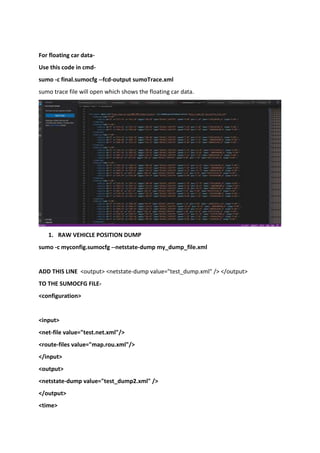
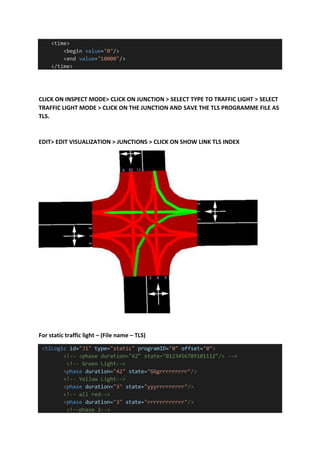
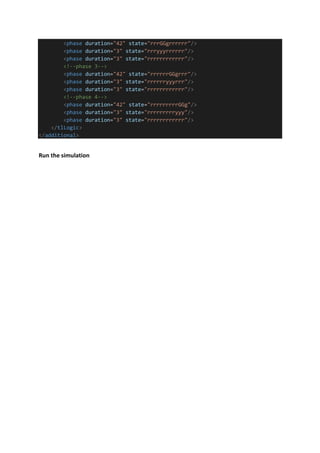
Traffic engineering involves the planning and design of roads and intersections to optimize traffic flow. Key aspects include conducting traffic studies to determine volume and patterns, installing traffic control devices like signs and signals, designing intersections, and separating road grades. Traffic signs help regulate, warn, and guide drivers while markings delineate lanes and spaces. Intersections come in various forms like squares, Ts, and Ys, with squares and roundabouts being safer options. Grade separations allow roads to cross without intersecting to reduce conflicts. Accident prevention requires both engineering solutions and enforcement of traffic rules.
The content of presentation slides describe the concept of road safety auditing and its application starting from the planning of the road project until opening the road.
INTELLIGENT TRANSPORTATION SYSTEM(ITS) PRESENTATION Mr. Lucky
It is a brief presentation on the topic of INTELLIGENT TRANSPORTATION SYSTEM(ITS). This is made by final year students of civil branch pursuing their B.tech. from Abdul Kalam Technical University.
In this presentation we try to include the basic methodologies and emerged technologies now a days in transportation system, and also the new concepts of blind turn safety and Spikes on roads at Traffic Signals.
Intelligent transportation systems (ITS) use advanced technologies like electronics, computers, communications and sensors to provide travellers with important information and improve transportation safety and efficiency. ITS applications range from basic systems like car navigation to more advanced integrated systems. Technologies involved in ITS include sensors for vehicle detection, GPS for location data, wireless communications for information sharing, and computational methods for data analysis. The benefits of ITS include safety improvements from incident detection and emergency response, increased productivity from traffic management, and reduced environmental impacts from optimized traffic flow.
Traffic engineering and traffic control devices finalLatif Hyder Wadho
This document provides an overview of traffic engineering and traffic control devices. It discusses the objectives of traffic engineering courses which are to lay a foundation of traffic engineering knowledge from both theory and practice. It also summarizes some basic traffic statistics for the US. The document then discusses several types of traffic control devices including signs, signals and markings which communicate traffic laws and regulations to drivers according to standards set by the Manual on Uniform Traffic Control Devices. It provides examples and guidelines for different types of regulatory, warning and guide signs.
This document provides guidelines for traffic signal design and operation. It discusses:
1. Signal types including fixed time, vehicle actuated, and semi-vehicle actuated signals. Signal displays include green, amber, and red indications.
2. Warrants for signal installation based on minimum vehicular or pedestrian volumes, interruption of traffic flow, or accident experience.
3. Design considerations like signal height, location, size of lenses, and maintenance procedures. Traffic data collection and site conditions should also be analyzed.
4. Coordinated signal timing using time-distance diagrams to allow continuous traffic flow at a predetermined speed along a route with multiple signals.
Origin and Destination ( O-D) Study. defined all types very well with advantages and disadvantages. Introduction of OD, Objective of OD Study
Information required for OD
OD Survey Types
Methodology
Road Side Interview Method
License Plate Method
Tag on Car method
Home Interview method
postal method
online survey method
commercial and public vehilce method survey
OD MATRIX
Desire line diagram and Flow Line diagram
Conclusion and Reference.
The document discusses various methods for conducting transportation surveys, including origin-destination surveys and traffic surveys. It describes five methods for conducting origin-destination surveys: road side interview, license plate, return post card, tag on car, and home interview. For each method, it provides details on how the method works and the type of data collected. It also discusses conducting traffic surveys to study traffic volumes, patterns, and accident-prone areas. Lastly, it covers conducting public transportation surveys through interviews, questionnaires, and external cordon rail surveys.
This document summarizes different types of traffic studies. It discusses traffic volume studies, which measure the quantity of vehicles crossing a road section over time. It also covers origin and destination studies, which collect traffic data to draw desire lines showing traffic flows between locations. The purposes of these studies include planning road facilities, traffic operations and control, and transportation scheduling. Common study methods include manual counts, automatic counters, and surveying road users about trips.
Accident study and analysis, objective, causes of accidents, and analysis of accident (collection of data and preparing reports and record) , types of accidents, and statistical analysis of accidents.
Traffic studies are carried out to analyze traffic characteristics and help decide geometric design and traffic control measures. The main traffic studies include traffic volume, speed, origin-destination, traffic flow characteristics, capacity, and accident studies. Traffic volume studies measure the number of vehicles on a road section over time and are used for planning, operations, and analysis. Speed studies measure the speeds of vehicles using methods like short-distance timing or radar guns.
Urban transportation system - methods of route assignmentStudent
The document discusses various methods of route assignment in transportation systems, including:
- All-or-nothing assignment method, which assigns all trips to the minimum path but does not account for capacity.
- Direction curve method, which predicts route usage based on travel time or distance saved on a new facility.
- Capacity restraint assignment techniques, which iteratively assign trips accounting for changing travel times due to congestion.
- Multi-route assignment technique, which recognizes that not all travelers choose the absolute minimum path and distributes trips across multiple routes factoring attributes like travel time and cost.
Transit Oriented Development (TOD) results in the creation of compact, walkable and liveable communities with access to amenities built around high quality mass transit stations. However, the discourse around TODs in India is more of a densification and value capture approach, which is necessary, but yet an incomplete conversation for the Indian context. This webinar, presented by Todd Litman, Himadri Das and Lubaina Rangwala addresses the major challenges and learnings from the ‘implementation’ of a TOD.
The webinar recording can be seen here - https://www2.gotomeeting.com/register/335456930
Related Research - http://embarqindiahub.org/reports/towards-walkable-sustainable-bengaluru-accessibility-project-indiranagar-metro-station
Related webinar - http://embarqindiahub.org/webinars/parking-effective-tool-manage-travel-demand-transit-oriented-developments
This document discusses the geometric design of rural roads. It defines geometric design and its basic principles, including that ultimate geometric requirements should be considered from the beginning. Design standards are minimum values that aim to balance safety and cost. The document outlines factors like terrain classification and their influence on design speed. It provides recommendations for elements of geometric design like road land width, carriageway width, shoulders, sight distances and more. Standards are provided to guide the geometric design of rural roads.
The document discusses various aspects of toll plaza design and operation. It describes how tolls are collected to recover construction and maintenance costs. It also discusses different toll collection methods like manual, coin machines, and electronic toll collection. The optimal number of toll booths is determined using queuing theory to minimize total delay time from queuing and merging. Level of service for toll plazas is based on density and volume-to-capacity ratios. Numerical examples calculate total delay times and the optimum number of toll booths given traffic flow and toll booth parameters.
Travel demand refers to the amount and type of travel people choose based on transport options and prices. It has two major aspects: land use and trip purpose. Land use refers to the pattern of land development in an area, which affects transportation demand through trip generation and distribution. Trip purpose is the reason for a trip, which can be classified as home-based or non-home-based. Travel demand is influenced by socioeconomic factors, location factors, and public transportation accessibility.
This document help you to prepare Triangulation Network (TIN), Hillshade Map, Slope map, interpolation and Digital Elevation Model (DEM) in a area and how to interpret them.
This document summarizes a traffic volume study conducted at Tejgaon Industrial Area in Dhaka, Bangladesh. A team of 5 students conducted classified manual counts of vehicles traveling along Shaheed Tajuddin Ahmed Avenue between Shatrasta and the flyover for 15 minutes intervals. Over 5,000 vehicles were counted, with the highest percentages being cars (54%) and CNG auto-rickshaws (22%). The average service flow rate was higher for traffic traveling from Shatrasta to the flyover compared to the opposite direction, reflecting peak travel patterns. Directional splits showed 55% of total traffic traveled from Shatrasta to the flyover.
The document summarizes a presentation on a cordon line survey. A cordon line survey studies travel patterns within an area bounded by an imaginary boundary line. The area inside the cordon line is studied extensively, looking at land use, economic activities, and travel characteristics. Travel patterns from and to areas outside the cordon line are also examined at a macro level. Key terms related to cordon line surveys include external cordon line, study area, internal and external trips, screen lines, and zones. Factors like existing and planned development, symmetric daily life patterns, safe survey locations, and compatibility with previous studies should be considered when selecting a cordon line.
This document discusses intermediate public transport (IPT) modes in India. IPT includes low-technology vehicles that occupy less space and are used for short-distance travel, providing transportation for low-income groups. The main IPT modes described are three-wheeled and motorized rickshaws, cycle rickshaws, tongas (horse-drawn carriages), six-seater auto-rickshaws, trekkers, and matador vans. Advantages of IPT include low fuel consumption, maneuverability in traffic, direct point-to-point service, low cost compared to other modes, and job opportunities. Disadvantages are that some vehicles are unsafe, unstable at high speeds, noisy,
5-Modal Split & Traffic Assignment-( Transportation and Traffic Engineering D...Hossam Shafiq I
The document discusses modal split and traffic assignment in transportation planning. It defines modal split as the process of separating trips by travel mode, usually expressed as a percentage of total trips. Traffic assignment involves allocating trips between zones to routes in the transportation network. Common traffic assignment methods include all-or-nothing assignment, which assigns all trips to the shortest route, and capacity restraint, which considers road capacity. The document provides examples of calculating modal split using a utility function and performing all-or-nothing traffic assignment on a sample network.
Traffic light signals regulate traffic flow at intersections through different colored lights and timed phases. They aim to improve safety by organizing conflicting traffic streams and increase junction capacity. A signal cycle consists of phases allotted to traffic movements, with intervals for changing lights. Sensors detect vehicle presence and adjust timings. Manual design methods calculate optimal cycle lengths and phase timings based on traffic volumes and pedestrian clearance needs to minimize delays.
This document discusses human factors that affect road safety. It begins by outlining the objectives of understanding road traffic safety, human factors, and causes of accidents. It then defines human factors and how they influence driver behavior and crash causes, such as attention, perception, and reaction time. The document also examines the driving task model and how road design can support driver expectations and abilities through consistent information presentation and accommodation of human limitations. In conclusion, it stresses the importance of road safety education to positively guide road users.
This document discusses various transportation surveys used for transportation planning including travel movement surveys, study area delineation, and transport planning surveys. It describes different types of surveys like home interview surveys, commercial vehicle surveys, taxi surveys, etc. and how origin-destination studies are conducted. It also discusses zoning of study areas, coding practices, traffic volume data collection, and inventory of transportation facilities. Various methods for conducting transportation surveys like registration questionnaires, post cards, roadside interviews, and home interviews are outlined.
This document demonstrates how to use Blackfire Player to test web APIs and applications. It shows how to:
1. Install and run Blackfire Player to define and run test scenarios against a web API.
2. Integrate Blackfire to collect performance metrics and reports during tests.
3. Dockerize the testing process to easily run the same tests against environments like staging.
The fundamentals and advance application of Node will be covered. We will explore the design choices that make Node.js unique, how this changes the way applications are built and how systems of applications work most effectively in this model. You will learn how to create modular code that’s robust, expressive and clear. Understand when to use callbacks, event emitters and streams.
Simulator customizing & testing for Xcode 9Bongwon Lee
Simulator allows you to rapidly prototype and test builds of your app during development. It provides tools to manage simulator devices, install and launch apps, pass arguments, and test in different configurations and languages. The simctl command can be used to control simulators, while Xcode builds and deploys apps to the simulator.
-- Task 2- Debugging a program with stacks- queues- and doubly-linked.docxAdamq0DJonese
/* Task 2: Debugging a program with stacks, queues, and doubly-linked lists There are a number of errors in the following program. All errors are located in main() and structure definitions. Function declarations and definitions are correct! Locate all errors, fix them (as shown below), run the program and save its output as a comment at the end of the source file. Example: int num = 10; int *ptr; num = &ptr; // <== Error: Comment the line and write the correct line below // Write a short justification where appropriate // num = &ptr; // Error #1 ptr = # Name: */ #include #include #include #include #define DUMMY_TRAILER '\177' // octal ASCII code of the // last character in the ASCII table #define NUM_CITIES 10 typedef struct { char name[12]; int temperature[5]; } CITY; // Stack and Queue Node typedef struct node NODE; struct node { CITY city; node *next; }; // Doubly Linked List Node typedef struct d_node D_NODE; struct d_node { CITY city; NODE *forw; NODE *back; }; // Stack Functions NODE *push(NODE *stack, const CITY *pStu); NODE *pop(NODE **stack); // Queue Functions void enqueue(NODE **queue, NODE **rear, const CITY *pStu); NODE *dequeue(NODE **queue, NODE **rear); // Doubly Linked List Functions D_NODE *init_list(void); int insert(D_NODE *list, const CITY *pStu); void traverse_forw(D_NODE *list); void traverse_back(D_NODE *list); // Other Functions void printCity(const CITY *pCity); int main (void) { CITY cList[NUM_CITIES] = { {"Cupertino", {88, 89, 87, 85, 89}}, {"Flagstaff", {81, 80, 88, 89, 89}}, {"Los Angeles", {87, 88, 89, 89, 90}}, {"Philadelphia", {96, 99, 99, 90, 95}}, {"Phoenix", {106, 109, 109, 100, 105}}, {"Portland", {89, 90, 85, 89, 90}}, {"Reno", {108, 105, 109, 100, 108}}, {"Salem", {85, 90, 85, 89, 90}}, {"Tucson", {107, 100, 109, 100, 108}}, {"Yreka", {101, 109, 100, 108, 109}} }; NODE *stack = NULL; NODE *top = NULL; NODE *queue = NULL, *rear = NULL; NODE *front; D_NODE *list; list = init_list(); // build stack and queue with data from an array of CITY structures srand((unsigned int)time(NULL)); int count = rand() % 10; for ( int n = 0; n < count; n++) { int i = rand() % NUM_CITIES; int duplicate = insert(list, &cList[i]); if(duplicate) { // already in the list! push(stack, &cList[i]); enqueue(&queue, &rear, cList[i]); } } // display list printf("\nLIST contents (forwards):\n"); traverse_forw(list); printf("\nLIST contents (backwards):\n"); traverse_back(list); // display stack if (top) { printf("\nSTACK contents from top to bottom:\n"); while ((top = pop(stack))) { printCity(top->city); } } else printf ("Empty Stack!\n"); // display queue if (front) { printf("\nQUEUE contents from front to rear:\n"); while ((front = dequeue( queue, rear))) { printCity(front->city); } } else printf ("Empty Queue!\n"); return 0; } /*************************************************** Displays the fileds of a CIS_CLASS structure Pre pCls - a pointer to a CIS_CLASS structure Post */ void printCity(const CITY *pCity) { printf("%-20s %3d\n",.
Ember.js is a JavaScript framework for building web applications. It provides conventions and architecture to make applications more organized and testable. Key aspects of Ember.js include Ember objects, computed properties, templates powered by Handlebars, routes for navigation, and a data modeling layer using Ember Data. Components are also used to build reusable isolated views. Ember follows a "data down, actions up" pattern where data flows from parent to child components and user actions bubble up through the components.
Highlights a bunch of different Python tricks and tips - from the stupid to the awesome (and a bit of both).
See how to register a 'str'.decode('hail_mary') codec, call_functions[1, 2, 3] instead of call_functions(1, 2, 3), creating a "Clojure-like" threading syntax by overloading the pipe operator, create useful equality mocks by overloading the equality operator, ditch JSON for pySON and put together a tiny lisp based on Norvig's awesome article.
agri inventory - nouka data collector / yaoya data convertorToshiaki Baba
This document provides instructions for setting up and using an agri inventory system called nouka and yaoya. Nouka collects data from servers using commands and sends it to the naya data store, which uses fluentd and MongoDB. It explains the components, data formats, and provides steps to get the required software and set up the system.
Taking Inspiration From The Functional WorldPiotr Solnica
No matter how crazy this may sound, taking inspiration from the functional world when programming in an OO language like Ruby turns out to be a good idea. In this talk we’re going to look at various functional ideas implemented in Ruby and see how they can improve and simplify our code, making it easier to grow and maintain applications.
This document contains PHP code for a web shell that provides various functions like file management, command execution, database operations etc. It starts a session, sets time limit and error reporting to 0. It then strips slashes from GET/POST/COOKIE variables. The rest of the code handles different requests like file upload, download, rename, delete etc and displays menus to call these functions. It also shows server information and has about page.
This document provides an introduction to Java programming including fundamental data types, variables, operators, and control flow statements. It explains that Java programs are compiled to bytecode that can run on any system with a Java Virtual Machine. The document also demonstrates a simple "Hello World" Java program to print text to the console.
This document provides an introduction to Java programming including fundamental data types, variables, operators, and control flow statements. It explains that Java programs are compiled to bytecode that can be executed on any system with a Java Virtual Machine (JVM). The document contains examples of simple Java code demonstrating basic syntax and features.
Capture the Flag (CTF) are information security challenges. They are fun, but they also provide a opportunity to practise for real-world security challenges.
In this talk we present the concept of CTF. We focus on some tools used by our team, which can also be used to solve real-world problems.
This sample program demonstrates how to access Meinberg GPS receivers via the binary data protocol. It can work via a serial port or network socket connection depending on the target operating system. It requires several other modules and supports Windows, Linux, QNX, and DOS targets. The program checks return codes from API functions, gets receiver information, status information, position, time zone, and synthesizer settings. It also has the ability to set the synthesizer frequency and phase.
This document contains code for a web application that serves geographic vector data stored in a Postgres database. It includes code to:
1) Connect to a Postgres database and import vector data from a shapefile into a table with a geometry column.
2) Define routes in a Sinatra application to serve pre-rendered web pages with the vector data visualized using SVG and embedded in HTML.
3) Include JavaScript code to pan and zoom the vector data visualization in the browser.
Hot Code is Faster Code - Addressing JVM Warm-upMark Price
What is the JVM warm-up problem, and how does it affect our software? How can we aid the runtime in optimising our programs, and is it even a good idea to do so?
This presentation explores the lifecycle of Java code, and how the JVM evolves the runtime representation of code during program execution. From bytecode to assembly and back again (via some uncommon traps), we will cover practical tips on ensuring that Java code is running fast when it matters most.
How I Built a Power Debugger Out of the Standard Library and Things I Found o...doughellmann
Smiley demonstrates how to use Python's native tracing capabilities to monitor not just what parts of your program run, but the data flowing through the program as it runs. All of the data is recorded for study after the program exits, which means you can pass different inputs and then compare the results of the runs. In this presentation, I describe the evolution of Smiley, from concept through internal API changes as I worked on the implementation. I also talk about tracing Python programs in general, and explain how the trace code in Smiley can be used to send trace data to different output destinations.
The document discusses various ways to embed Perl in C and C in Perl. It provides an overview of embedding Perl in C using ExtUtils::Embed, B::C, and XS. It also covers embedding C code in Perl using Inline::C and XS. Finally, it demonstrates examples of calling Perl functions from C code and evaluating Perl code from embedded C programs.
This document summarizes the key capabilities of Warp 10, a time series data ingestion, processing, and visualization platform:
1. Warp 10 can ingest high volumes of time series data from sensors and other IoT devices via HTTP, WebSockets, and many collection tools in a performant manner.
2. It provides a feature-rich scripting language called WarpScript that allows users to manipulate, analyze, and transform ingested time series data using over 690 functions and frameworks.
3. Warp 10 includes tools to visualize time series data in real-time through widgets that can display charts, images, and more generated from WarpScript. Dynamic tile widgets also enable building configurable
This document provides details about a mini project to study road safety improvements at an intersection in Warangal, Telangana, India. It includes a map of the study area location and details of the roads. 13 safety concerns were identified including lack of traffic signs, uncovered drainage, roadside parking, and poor road conditions. Recommendations are provided to regulate parking, add pedestrian facilities, improve road markings and signs, repair roads, limit distractions, and cover open drainage. The proposed safety measures would improve traffic flow and safety for all road users.
This document provides a seminar presentation on innovations in public transportation. It begins with an introduction to public transportation and discusses the need for it in terms of issues like traffic congestion, rising fuel costs, and environmental concerns. It then covers the evolution of various public transportation modes over time. The presentation discusses policies that promote public transportation, as well challenges to innovation in the sector like funding and regulations. Specific innovations discussed include electric buses, contactless payment systems, real-time tracking, autonomous vehicles, and integrated fare systems. The presentation concludes with a literature review covering case studies of public transportation systems and policies in various cities.
This document analyzes the strengths, weaknesses, opportunities, and threats (SWOT) of the Beohari market located in Beohari, India. The key strengths of the market are its central location in the town, famous spice shops, and accessibility. However, weaknesses include very narrow streets that cause traffic jams and noise pollution. There are opportunities to redevelop the market as the town's population grows. Threats include old buildings being demolished and increased traffic congestion if streets are not improved.
PLANNING FOR SELF RELIANT AND SUSTAINABLE CITY IN TERMS OF WATER SUPPLYshrikrishna kesharwani
This document outlines a dissertation topic on planning for a self-reliant and sustainable city in terms of water supply. The main aim is to identify solutions to make a city independent and environmentally-friendly for its water needs. The objectives include identifying existing problems, sustainability methods, and a methodology to calculate future demand. The background discusses international and national water concerns like scarcity. Major issues facing cities are identified as increased demand, groundwater depletion, and pollution. Potential solutions proposed include recycling wastewater, rainwater harvesting, and education. Parameters for analyzing solutions include cost, environmental impact, lifetime, area needs, and social acceptance. The document concludes by discussing how to calculate a city's future needs and select sustainable methods to make
This document summarizes a noise assessment study conducted in Beohari, Madhya Pradesh, India. Noise levels were measured at 4 locations over different time periods. The results found that 2 of the locations exceeded permissible noise limits for residential areas. Recommendations include banning high decibel horns and loudspeakers, improving road infrastructure, adding noise barriers like trees and walls alongside roads, and improving building insulation at noisy locations.
The document discusses an environmental impact assessment report for Phase 1 of the Surat Metro Rail Project in India. It provides general details of the project, assesses potential environmental impacts including pollution, and performs a technical analysis of urban mass transit systems. The document analyzes and draws conclusions about the environmental effects from the metro rail project.
The document discusses Transit-Oriented Development (TOD), providing definitions and outlining key principles and implementation strategies. It notes that TOD focuses on creating urban development patterns that facilitate public transit, walking and cycling. The document then lists 12 TOD principles, including mixed land uses, density optimization, and street-oriented buildings. It outlines scales of TOD from neighborhood to regional levels. Implementation is discussed as a long-term, phased process requiring partnerships. Monitoring, evaluation and capacity building are key components of the implementation framework. The document concludes with sections on enabling TOD and financing strategies like land value capture.
SUSTAINABLE TRANSPORTATION: VARIOUS PLOICIES FORMULATED IN INDIA IN REALISING...shrikrishna kesharwani
This report is made by shrikrishna kesharwani
student of M.Tech, 1st year transportation engineering
NIT WARANGAL,
FOR MORE INFORMATION CONTACT ME THROUGH INSTAGRAM
FOLLOW ME ON INSTAGRAM - @SHRIKRISHNAKESHARWANI
Evaluation of Pedestrian Safety and Road Crossing Behavior at Midblock Crosswalkshrikrishna kesharwani
This report is made by shrikrishna kesharwani
student of M.Tech, 1st year transportation engineering
NIT WARANGAL,
FOR MORE INFORMATION CONTACT ME THROUGH INSTAGRAM
FOLLOW ME ON INSTAGRAM - @SHRIKRISHNAKESHARWANI
This Seminar presentation is made by Shrikrishna Kesharwani
1ST YEAR, Transportation engineering student
NIT WARANGAL
FOLLOW ME ON INSTAGRAM
@SHRIKRISHNAKESHARWANI
Correation, Linear Regression and Multilinear Regression using R softwareshrikrishna kesharwani
The document describes performing correlation, linear regression, and multilinear regression analysis on transportation-related data using R software. It provides theory on correlation, linear regression, and multilinear regression. The procedures section outlines the steps to perform correlation analysis, simple linear regression, and multiple linear regression. The results and analysis section shows the output of applying these techniques to variables in a transportation data set and interpreting the correlation coefficients, p-values, and regression results.
sustainable transportation and various policies formulated in India in realizing sustainable urban transportation plans.
URBAN TRANSPORT PLANNING ASSIGNMENT.
MADE BY SHRIKRISHNA KESHARWANI
M. Tech 1st Year, NIT Warangal
Transportation systems have significant environmental impacts. Road transportation is a major contributor to issues like climate change, air pollution, noise pollution, and land consumption. It accounts for a large portion of emissions of greenhouse gases and air pollutants. These emissions negatively impact air quality, acid rain, smog, and climate change. Scientists and engineers are working on developing more sustainable and environmentally friendly transportation solutions, but current systems continue to pose threats to the environment through direct, indirect, and cumulative effects.
The document provides a zonal development plan for the heritage zone of Bhopal, Madhya Pradesh, India. It begins with an introduction to Bhopal's history and an analysis of the existing conditions in the heritage zone. This includes land use, demographics, infrastructure, transportation, and environmental factors. A conceptual framework is then outlined based on projected requirements. Several development strategies and proposals are presented to upgrade the zone, focusing on waterfront development, pedestrianization, metro network expansion, conservation of heritage gates, improved parking, and environmental conservation. The proposals aim to enhance the zone's heritage, infrastructure, transportation, and quality of life while complying with government policies and mobilizing necessary resources for implementation.
The document proposes transportation plans for Ujjain, India. It analyzes the existing transportation conditions, including road connectivity, public transportation, travel characteristics, and parking. Key issues identified are congestion on major roads and intersections, an improper BRTS system, and mixing of local and long-distance traffic. The proposals include redevelopment of railway stations, development of bus stands, expansion of major roads, transit-oriented development around stations, and a multimodal transit hub near the existing railway station and bus terminal to better connect transportation modes. The transit hub aims to efficiently connect the religious/cultural hub and knowledge/economic hub through improved regional transportation.
How to Build a Module in Odoo 17 Using the Scaffold MethodCeline George
Odoo provides an option for creating a module by using a single line command. By using this command the user can make a whole structure of a module. It is very easy for a beginner to make a module. There is no need to make each file manually. This slide will show how to create a module using the scaffold method.
ISO/IEC 27001, ISO/IEC 42001, and GDPR: Best Practices for Implementation and...PECB
Denis is a dynamic and results-driven Chief Information Officer (CIO) with a distinguished career spanning information systems analysis and technical project management. With a proven track record of spearheading the design and delivery of cutting-edge Information Management solutions, he has consistently elevated business operations, streamlined reporting functions, and maximized process efficiency.
Certified as an ISO/IEC 27001: Information Security Management Systems (ISMS) Lead Implementer, Data Protection Officer, and Cyber Risks Analyst, Denis brings a heightened focus on data security, privacy, and cyber resilience to every endeavor.
His expertise extends across a diverse spectrum of reporting, database, and web development applications, underpinned by an exceptional grasp of data storage and virtualization technologies. His proficiency in application testing, database administration, and data cleansing ensures seamless execution of complex projects.
What sets Denis apart is his comprehensive understanding of Business and Systems Analysis technologies, honed through involvement in all phases of the Software Development Lifecycle (SDLC). From meticulous requirements gathering to precise analysis, innovative design, rigorous development, thorough testing, and successful implementation, he has consistently delivered exceptional results.
Throughout his career, he has taken on multifaceted roles, from leading technical project management teams to owning solutions that drive operational excellence. His conscientious and proactive approach is unwavering, whether he is working independently or collaboratively within a team. His ability to connect with colleagues on a personal level underscores his commitment to fostering a harmonious and productive workplace environment.
Date: May 29, 2024
Tags: Information Security, ISO/IEC 27001, ISO/IEC 42001, Artificial Intelligence, GDPR
-------------------------------------------------------------------------------
Find out more about ISO training and certification services
Training: ISO/IEC 27001 Information Security Management System - EN | PECB
ISO/IEC 42001 Artificial Intelligence Management System - EN | PECB
General Data Protection Regulation (GDPR) - Training Courses - EN | PECB
Webinars: https://pecb.com/webinars
Article: https://pecb.com/article
-------------------------------------------------------------------------------
For more information about PECB:
Website: https://pecb.com/
LinkedIn: https://www.linkedin.com/company/pecb/
Facebook: https://www.facebook.com/PECBInternational/
Slideshare: http://www.slideshare.net/PECBCERTIFICATION
This presentation includes basic of PCOS their pathology and treatment and also Ayurveda correlation of PCOS and Ayurvedic line of treatment mentioned in classics.
Introduction to AI for Nonprofits with Tapp NetworkTechSoup
Dive into the world of AI! Experts Jon Hill and Tareq Monaur will guide you through AI's role in enhancing nonprofit websites and basic marketing strategies, making it easy to understand and apply.
How to Add Chatter in the odoo 17 ERP ModuleCeline George
In Odoo, the chatter is like a chat tool that helps you work together on records. You can leave notes and track things, making it easier to talk with your team and partners. Inside chatter, all communication history, activity, and changes will be displayed.
A workshop hosted by the South African Journal of Science aimed at postgraduate students and early career researchers with little or no experience in writing and publishing journal articles.
This presentation was provided by Steph Pollock of The American Psychological Association’s Journals Program, and Damita Snow, of The American Society of Civil Engineers (ASCE), for the initial session of NISO's 2024 Training Series "DEIA in the Scholarly Landscape." Session One: 'Setting Expectations: a DEIA Primer,' was held June 6, 2024.
Macroeconomics- Movie Location
This will be used as part of your Personal Professional Portfolio once graded.
Objective:
Prepare a presentation or a paper using research, basic comparative analysis, data organization and application of economic information. You will make an informed assessment of an economic climate outside of the United States to accomplish an entertainment industry objective.
हिंदी वर्णमाला पीपीटी, hindi alphabet PPT presentation, hindi varnamala PPT, Hindi Varnamala pdf, हिंदी स्वर, हिंदी व्यंजन, sikhiye hindi varnmala, dr. mulla adam ali, hindi language and literature, hindi alphabet with drawing, hindi alphabet pdf, hindi varnamala for childrens, hindi language, hindi varnamala practice for kids, https://www.drmullaadamali.com
Exploiting Artificial Intelligence for Empowering Researchers and Faculty, In...Dr. Vinod Kumar Kanvaria
Exploiting Artificial Intelligence for Empowering Researchers and Faculty,
International FDP on Fundamentals of Research in Social Sciences
at Integral University, Lucknow, 06.06.2024
By Dr. Vinod Kumar Kanvaria
Assessment and Planning in Educational technology.pptxKavitha Krishnan
In an education system, it is understood that assessment is only for the students, but on the other hand, the Assessment of teachers is also an important aspect of the education system that ensures teachers are providing high-quality instruction to students. The assessment process can be used to provide feedback and support for professional development, to inform decisions about teacher retention or promotion, or to evaluate teacher effectiveness for accountability purposes.
6. <additional-files value="map.poly.xml"/>
</input>
<time>
<begin value="0"/>
<end value="1000"/>
</time>
</configuration>
9) Open SUMO GUI > Open Simulation > Run map.sumo.cfg
10) If you are getting error while running the simulation then just see which vehicle is not
having proper route from the code and del. it
FOR OUT PUT-
First make configuration file-
Use this code in notepad ++ and save it as .sumocfg file
<configuration>
<input>
<net-file value="test.net.xml"/>
<route-files value="map.rou.xml"/>
</input>
<time>
<begin value="0"/>
<end value="2000"/>
</time>
</configuration>
Open and run the simulation in sumo gui
7. For floating car data-
Use this code in cmd-
sumo -c final.sumocfg --fcd-output sumoTrace.xml
sumo trace file will open which shows the floating car data.
1. RAW VEHICLE POSITION DUMP
sumo -c myconfig.sumocfg --netstate-dump my_dump_file.xml
ADD THIS LINE <output> <netstate-dump value="test_dump.xml" /> </output>
TO THE SUMOCFG FILE-
<configuration>
<input>
<net-file value="test.net.xml"/>
<route-files value="map.rou.xml"/>
</input>
<output>
<netstate-dump value="test_dump2.xml" />
</output>
<time>
8. <begin value="0"/>
<end value="2000"/>
</time>
</configuration>
Now simulate in sumo gui to get output
2. EMISSION OUTPUT
USE CODE –
sumo –c mynew.sumocfg --emission-output my_emission_file.xml
3. For getting full output use code-
sumo -c myconfig.sumocfg --full-output my_full_output.xml
open file (warning above gb)
9. Simulation 2-
Make a <sumo.net> file from netedit.
Create a four leg junction as shown below-
Save the file to a working folder then copy the randomtrips python file to the same folder
Use code in cmd- python randomTrips.py -n test.net.xml -r map.rou.xml -e 100 –l to
generate random traffic.
<trip id="0" depart="0.00" from="-E3" to="-E0"/>
<trip id="1" depart="1.00" from="-E1" to="E2"/>
<trip id="2" depart="2.00" from="-E3" to="E2"/>
<trip id="4" depart="4.00" from="-E2" to="-E0"/>
<trip id="5" depart="5.00" from="-E1" to="E2"/>
<trip id="6" depart="6.00" from="-E1" to="-E0"/>
<trip id="7" depart="7.00" from="-E3" to="E2"/>
<trip id="8" depart="8.00" from="-E1" to="E2"/>
<trip id="10" depart="10.00" from="-E3" to="E2"/>
<trip id="11" depart="11.00" from="-E2" to="-E0"/>
<trip id="12" depart="12.00" from="E0" to="E1"/>
<trip id="13" depart="13.00" from="-E1" to="-E0"/>
<trip id="14" depart="14.00" from="E0" to="E2"/>
<trip id="15" depart="15.00" from="-E3" to="-E0"/>
<trip id="16" depart="16.00" from="-E1" to="E3"/>
<trip id="17" depart="17.00" from="-E2" to="E1"/>
<trip id="18" depart="18.00" from="E0" to="E2"/>
<trip id="19" depart="19.00" from="E0" to="E2"/>
E0 -E0
E2 -E2
-E1
E1
E3
-E3
12. <time>
<begin value="0"/>
<end value="10000"/>
</time>
CLICK ON INSPECT MODE> CLICK ON JUNCTION > SELECT TYPE TO TRAFFIC LIGHT > SELECT
TRAFFIC LIGHT MODE > CLICK ON THE JUNCTION AND SAVE THE TLS PROGRAMME FILE AS
TLS.
EDIT> EDIT VISUALIZATION > JUNCTIONS > CLICK ON SHOW LINK TLS INDEX
For static traffic light – (File name – TLS)
<tlLogic id="J1" type="static" programID="0" offset="0">
<!-- <phase duration="42" state="0123456789101112"/> -->
<!-- Green Light-->
<phase duration="42" state="GGgrrrrrrrrr"/>
<!-- Yellow Light-->
<phase duration="3" state="yyyrrrrrrrrr"/>
<!-- all red-->
<phase duration="3" state="rrrrrrrrrrrr"/>
<!--phase 2-->