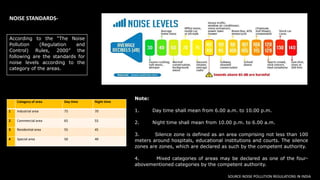
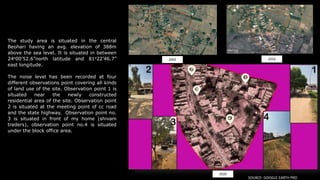
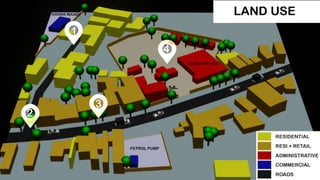
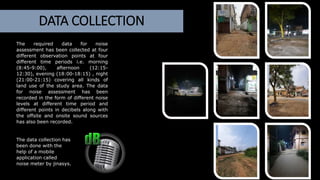
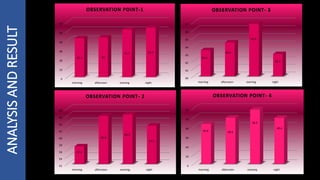
NOISE
ASSESMENT
SUBMITTED BY- SHRI KRISHNA KESHARWANI
SCHOLAR NO.- 181109005
♔
♖
♗ ♘
♙
♜
1
2
3
4
5
6
I N T R O D U C T I O N
C O N C L U S I O N
A N A L Y S I S
A N D R E S U L T
M E T H O D O L O G Y
D A T A
C O L L E C T I O N
S I T E
C H A R A C T E R S T I C S
NOISE ASSESMENT
TABLE OF
CONTENTS
INTRODUCTION
• Noise can disturb our work,
rest, sleep and
communication. It can
damage our hearing and
evoke other psychological
physiological and possibly
pathological reactions
However, because of
complexity, variability and
the interaction of noise with
other environmental factors,
the adverse health effects of
noise do not lend themselves
to a straight forward
analysis.
SOURCES OF NOISE
INDOOR SOURCES OUTDOOR SOURCES
 Air coolers
 Air conditioner
 Television.
 Music system.
 Family conflict.
 Baby crying.
 Other office and
home appliances.
 Traffic (road, rail)
 Loudspeakers.
 Vehicles horn.
 Construction
activities.
 Fire crackers.
 Industries.
 Generators.
• Noise is typically defined as
unwanted sound. Sound
which pleases the listeners is
music and that which causes
pain and annoyance is noise.
At times, what is music for
some can be noise for others.
SOURCE-NOISE POLLUTION REGULATIONS IN INDIA
Category of area Day time Night time
1 Industrial area 75 70
2 Commercial area 65 55
3 Residential area 55 45
4 Special area 50 40
According to the “The Noise
Pollution (Regulation and
Control) Rules, 2000” the
following are the standards for
noise levels according to the
category of the areas.
NOISE STANDARDS-
Note:
1. Day time shall mean from 6.00 a.m. to 10.00 p.m.
2. Night time shall mean from 10.00 p.m. to 6.00 a.m.
3. Silence zone is defined as an area comprising not less than 100
meters around hospitals, educational institutions and courts. The silence
zones are zones, which are declared as such by the competent authority.
4. Mixed categories of areas may be declared as one of the four-
abovementioned categories by the competent authority.
SOURCE-NOISE POLLUTION REGULATIONS IN INDIA
INTRODUCTION TO THE
LITERATURE
FINALIZING AIMS AND
OBJECTIVE OF THE STUDY
COLLECTION OF PRIMARY DATA
AND SECONDARY DATA
DATA PUNCHING
DATA ANALYSIS
IDENTIFICATION OF PROBLEMS
AND ISSUES
REPORT COMPLETITION AND
SUBMISSION
METHODOLOGY
SITE CHARACTERSTICS
 There are total 64 house hold in the area
 And the approximate population of the area is 64 x 4 = 256.
 The total area of the site is 47,551sq m.
 There are two types of road present in the area one is the cc road
and another one is the state highway which is the black tar road.
 Width of cc road is 3 meters and the width of state highway is
4.5m.
 Settlement pattern –organic development.
ABOUT STUDY AREA -
Beohari is a Nagar Panchayat city in district of Shahdol, Madhya
Pradesh.
Beohari is rich in mineral resources, including marble, iron ore,
clay, sand and unexplored petroleum products. Beohari is
economically rich and is politically active since Independence. The
Beohari city is divided into 15 wards. The Beohari Nagar Panchayat
has population of 24,545 of which 12,745 are males while 11,800
are females as per report released by Census India 2011.
ABOUT BEOHARI -
SOURCE- CENSUS 2011
2002 2010
2020
The study area is situated in the central
Beohari having an avg. elevation of 388m
above the sea level. It is situated in between
24o00’52.6”north latitude and 81o22’46.7”
east longitude.
The noise level has been recorded at four
different observations point covering all kinds
of land use of the site. Observation point 1 is
situated near the newly constructed
residential area of the site. Observation point
2 is situated at the meeting point of cc road
and the state highway. Observation point no.
3 is situated in front of my home (shivam
traders), observation point no.4 is situated
under the block office area.
SOURCE- GOOGLE EARTH PRO
The required data for noise
assessment has been collected at four
different observation points at four
different time periods i.e. morning
(8:45-9:00), afternoon (12:15-
12:30), evening (18:00-18:15) , night
(21:00-21:15) covering all kinds of
land use of the study area. The data
for noise assessment has been
recorded in the form of different noise
levels at different time period and
different points in decibels along with
the offsite and onsite sound sources
has also been recorded.
The data collection has
been done with the
help of a mobile
application called
noise meter by jinasys.
DATA COLLECTION
DATE PERIOD START STOP peak Leq max min avr
20-10-2020 morning 08:46 08:47 57.8 43.8 54.7 36.4 42.1
Birds sound audible,several
vehicle passed,cooler noise was
audible
birds , vehicles passing through
nearby road, vehicle horn
20-10-2020 afternoon 12:14 12:16 55.6 51.3 98.1 35.5 43 vehicles,pedestrians
vehicles passing through nearby
main road, vehicle horn
20-10-2020 evening 17:58 18:00 65.5 55.6 69.4 42.4 51.7 vehicles,pedestrians
music coming out from the
loudspeakers at the nearby temple
was audible,vechiles passing through
near by main road
20-10-2020 night 20:59 21:01 65.3 58.5 67.3 45 53.7 vehicles,pedestrians
music coming out from the
loudspeakers at the nearby temple
was audible,vechiles passing through
near by main road
On site noise source
OBSERVATION POINT - 1
Off site noise source
MEASUREMENT NOISE LEVEL (dB)
DATE PERIOD START STOP peak Leq max min avr
20-10-2020 morning 08:48 08:50 73.0.8 61 72.8 48.8 57.1
pedestrians,several vehicles
passed vehicles and there horn noise
20-10-2020 afternoon 12:12 12:14 74.5 67.2 72.7 56.4 65.9
noise coming out from the welding
machine shop,pedestrians,vehices
vehicles noise,noise coming out
from the nearby construction site
20-10-2020 evening 18:03 18:05 79.2 67.3 72.7 56.6 66.3 vehicles,pedestrians
vehicles noise,noise coming out
from the nearby construction site
20-10-2020 night 21:02 21:04 84.7 64.2 69.5 57.9 63.1 vehicles,pedestrians vehicles
OBSERVATION POINT- 2
MEASUREMENT NOISE LEVEL (dB)
On site noise source Off site noise source
DATE PERIOD START STOP peak Leq max min avr
20-10-2020 morning 08:51 08:53 70.9 65.8 74 51.7 63.4
pedestrians,music system,several
vehicles passed vehicles
20-10-2020 afternoon 12:09 12:12 73.1 65.1 70.6 58.2 64.4 vehicles,pedestrians vehicles
20-10-2020 evening 18:08 18:10 79 67.6 79 60.2 66.8
vehicles,pedestrians,loud
speakers vehicles
20-10-2020 night 21:04 21:06 73.9 64.2 70 56.5 62.9 vehicles,pedestrians vehicles
OBSERVATION POINT- 3
MEASUREMENT NOISE LEVEL (dB)
On site noise source Off site noise source
DATE PERIOD START STOP peak Leq max min avr
20-10-2020 morning 08:55 08:57 67.1 48.8 61.2 27.5 42.9 Birds , pedestrians loudspeaker,vehicle horn
20-10-2020 afternoon 12:18 12:20 78.7 55.7 70.4 42..4 49.6 pedestrians loudspeaker,vehicle horn
20-10-2020 evening 18:13 18:15 71.2 59.4 66.5 50.1 58.3 pedestrians loudspeaker,vehicle horn
20-10-2020 night 21:10 21:12 62.8 49.7 56.2 45.5 49.4
music coming out from the
loudspeakers at the nearby durga
pandal was audible,vechiles passing
through near by main road
MEASUREMENT NOISE LEVEL (dB)
On site noise source Off site noise source
OBSERVATION POINT- 4
0
10
20
30
40
50
60
morning afternoon evening night
42.1 43
51.7 53.7
OBSERVATION POINT-1
52
54
56
58
60
62
64
66
68
morning afternoon evening night
57.1
65.9
66.3
63.1
OBSERVATION POINT- 2
60
61
62
63
64
65
66
67
morning afternoon evening night
63.4
64.4
66.8
62.9
OBSERVATION POINT- 3
0
10
20
30
40
50
60
morning afternoon evening night
42.9 49.6
58.3
49.4
OBSERVATION POINT- 4
ANALYSIS
AND
RESULT
0
10
20
30
40
50
60
70
P O I N T - 1
P O I N T - 2
P O I N T - 3
P O I N T - 4
51.7
66.3 66.8
58.3
EVENING
0
10
20
30
40
50
60
70
P O I N T - 1
P O I N T - 2
P O I N T - 3
P O I N T - 4
53.7
63.1
62.9
49.4
NIGHT
0
10
20
30
40
50
60
70
P O I N T - 1
P O I N T - 2
P O I N T - 3
P O I N T - 4
43
65.9
64.4
49.6
AFTERNOON
0
10
20
30
40
50
60
70
P O I N T - 1
P O I N T - 2
P O I N T - 3
P O I N T - 4
42.1
57.1
63.4
42.9
MORNING
The measurements of noise levels have been recorded in working day (Monday 20-10-2020) at the four different
observation points at selected site in vicinity of Beohari. The analysis has revealed the following points-
 The noise pollution levels are more than the permissible limits at the observation point 2 and 3 if we consider that as a
residential area. However the other two points 1 and 4 have noise emissions under the permissible limits.
 The maximum noise levels are especially determined by the heavy traffic, technical Status of the vehicles and quality of
the road situation.
 Evening time is the peak time of the noise level for points 2, 3 and 4.the major source of noise at this time period is
the traffic on the road.
 The variation in the noise levels at the observation points is directly related to the distance between the state highway
and the location of the point and also to the sound barriers like trees and walls coming in between the noise source
and the point.
 It is suggested that the necessary abatement measures to reduce the noise levels in these areas should be
implemented in order to improve the present status of human health and environment of the study area located in the
Beohari.
RESULT
CONCLUSION
• By analyzing the data it has been found that the sound barriers like trees and walls are actually helping in reducing the noise
intensity at observation point 1 and 4.
• As compared to the other two points i.e. observation point 2 and 3 , points 1 and 4 have recorded low noise level because of the
distance from the main road and also due to the presence of various sound barriers like trees ,buildings and walls between the
state highway and the points .
•
• Only two points (2 and 3) have recorded high noise levels therefore the following measures should be taken with the aim of
reducing the noise level produced by different sources:
•
 Banning the use of high decibel horns.
 Banning the loudspeakers.
 the rehabilitation of the infrastructure of the street networks of ways with intense traffic;
 the implementation of the technical measures for noise levels;
 Creating noise barriers alongside the road like trees and walls. Or grass walls.
 blocking the ways of noise propagation by creating protection curtains, including green spaces within inhabited areas;
 Performing special isolation for buildings against one or more types of environmental noise combined with ventilation or
conditioned air facilities, in order to maintain high values of the isolations against environmental noise.

Noise assessment

  • 1.
    NOISE ASSESMENT SUBMITTED BY- SHRIKRISHNA KESHARWANI SCHOLAR NO.- 181109005
  • 2.
    ♔ ♖ ♗ ♘ ♙ ♜ 1 2 3 4 5 6 I NT R O D U C T I O N C O N C L U S I O N A N A L Y S I S A N D R E S U L T M E T H O D O L O G Y D A T A C O L L E C T I O N S I T E C H A R A C T E R S T I C S NOISE ASSESMENT TABLE OF CONTENTS
  • 3.
    INTRODUCTION • Noise candisturb our work, rest, sleep and communication. It can damage our hearing and evoke other psychological physiological and possibly pathological reactions However, because of complexity, variability and the interaction of noise with other environmental factors, the adverse health effects of noise do not lend themselves to a straight forward analysis. SOURCES OF NOISE INDOOR SOURCES OUTDOOR SOURCES  Air coolers  Air conditioner  Television.  Music system.  Family conflict.  Baby crying.  Other office and home appliances.  Traffic (road, rail)  Loudspeakers.  Vehicles horn.  Construction activities.  Fire crackers.  Industries.  Generators. • Noise is typically defined as unwanted sound. Sound which pleases the listeners is music and that which causes pain and annoyance is noise. At times, what is music for some can be noise for others. SOURCE-NOISE POLLUTION REGULATIONS IN INDIA
  • 4.
    Category of areaDay time Night time 1 Industrial area 75 70 2 Commercial area 65 55 3 Residential area 55 45 4 Special area 50 40 According to the “The Noise Pollution (Regulation and Control) Rules, 2000” the following are the standards for noise levels according to the category of the areas. NOISE STANDARDS- Note: 1. Day time shall mean from 6.00 a.m. to 10.00 p.m. 2. Night time shall mean from 10.00 p.m. to 6.00 a.m. 3. Silence zone is defined as an area comprising not less than 100 meters around hospitals, educational institutions and courts. The silence zones are zones, which are declared as such by the competent authority. 4. Mixed categories of areas may be declared as one of the four- abovementioned categories by the competent authority. SOURCE-NOISE POLLUTION REGULATIONS IN INDIA
  • 5.
    INTRODUCTION TO THE LITERATURE FINALIZINGAIMS AND OBJECTIVE OF THE STUDY COLLECTION OF PRIMARY DATA AND SECONDARY DATA DATA PUNCHING DATA ANALYSIS IDENTIFICATION OF PROBLEMS AND ISSUES REPORT COMPLETITION AND SUBMISSION METHODOLOGY
  • 6.
    SITE CHARACTERSTICS  Thereare total 64 house hold in the area  And the approximate population of the area is 64 x 4 = 256.  The total area of the site is 47,551sq m.  There are two types of road present in the area one is the cc road and another one is the state highway which is the black tar road.  Width of cc road is 3 meters and the width of state highway is 4.5m.  Settlement pattern –organic development. ABOUT STUDY AREA - Beohari is a Nagar Panchayat city in district of Shahdol, Madhya Pradesh. Beohari is rich in mineral resources, including marble, iron ore, clay, sand and unexplored petroleum products. Beohari is economically rich and is politically active since Independence. The Beohari city is divided into 15 wards. The Beohari Nagar Panchayat has population of 24,545 of which 12,745 are males while 11,800 are females as per report released by Census India 2011. ABOUT BEOHARI - SOURCE- CENSUS 2011
  • 7.
    2002 2010 2020 The studyarea is situated in the central Beohari having an avg. elevation of 388m above the sea level. It is situated in between 24o00’52.6”north latitude and 81o22’46.7” east longitude. The noise level has been recorded at four different observations point covering all kinds of land use of the site. Observation point 1 is situated near the newly constructed residential area of the site. Observation point 2 is situated at the meeting point of cc road and the state highway. Observation point no. 3 is situated in front of my home (shivam traders), observation point no.4 is situated under the block office area. SOURCE- GOOGLE EARTH PRO
  • 10.
    The required datafor noise assessment has been collected at four different observation points at four different time periods i.e. morning (8:45-9:00), afternoon (12:15- 12:30), evening (18:00-18:15) , night (21:00-21:15) covering all kinds of land use of the study area. The data for noise assessment has been recorded in the form of different noise levels at different time period and different points in decibels along with the offsite and onsite sound sources has also been recorded. The data collection has been done with the help of a mobile application called noise meter by jinasys. DATA COLLECTION
  • 11.
    DATE PERIOD STARTSTOP peak Leq max min avr 20-10-2020 morning 08:46 08:47 57.8 43.8 54.7 36.4 42.1 Birds sound audible,several vehicle passed,cooler noise was audible birds , vehicles passing through nearby road, vehicle horn 20-10-2020 afternoon 12:14 12:16 55.6 51.3 98.1 35.5 43 vehicles,pedestrians vehicles passing through nearby main road, vehicle horn 20-10-2020 evening 17:58 18:00 65.5 55.6 69.4 42.4 51.7 vehicles,pedestrians music coming out from the loudspeakers at the nearby temple was audible,vechiles passing through near by main road 20-10-2020 night 20:59 21:01 65.3 58.5 67.3 45 53.7 vehicles,pedestrians music coming out from the loudspeakers at the nearby temple was audible,vechiles passing through near by main road On site noise source OBSERVATION POINT - 1 Off site noise source MEASUREMENT NOISE LEVEL (dB) DATE PERIOD START STOP peak Leq max min avr 20-10-2020 morning 08:48 08:50 73.0.8 61 72.8 48.8 57.1 pedestrians,several vehicles passed vehicles and there horn noise 20-10-2020 afternoon 12:12 12:14 74.5 67.2 72.7 56.4 65.9 noise coming out from the welding machine shop,pedestrians,vehices vehicles noise,noise coming out from the nearby construction site 20-10-2020 evening 18:03 18:05 79.2 67.3 72.7 56.6 66.3 vehicles,pedestrians vehicles noise,noise coming out from the nearby construction site 20-10-2020 night 21:02 21:04 84.7 64.2 69.5 57.9 63.1 vehicles,pedestrians vehicles OBSERVATION POINT- 2 MEASUREMENT NOISE LEVEL (dB) On site noise source Off site noise source
  • 12.
    DATE PERIOD STARTSTOP peak Leq max min avr 20-10-2020 morning 08:51 08:53 70.9 65.8 74 51.7 63.4 pedestrians,music system,several vehicles passed vehicles 20-10-2020 afternoon 12:09 12:12 73.1 65.1 70.6 58.2 64.4 vehicles,pedestrians vehicles 20-10-2020 evening 18:08 18:10 79 67.6 79 60.2 66.8 vehicles,pedestrians,loud speakers vehicles 20-10-2020 night 21:04 21:06 73.9 64.2 70 56.5 62.9 vehicles,pedestrians vehicles OBSERVATION POINT- 3 MEASUREMENT NOISE LEVEL (dB) On site noise source Off site noise source DATE PERIOD START STOP peak Leq max min avr 20-10-2020 morning 08:55 08:57 67.1 48.8 61.2 27.5 42.9 Birds , pedestrians loudspeaker,vehicle horn 20-10-2020 afternoon 12:18 12:20 78.7 55.7 70.4 42..4 49.6 pedestrians loudspeaker,vehicle horn 20-10-2020 evening 18:13 18:15 71.2 59.4 66.5 50.1 58.3 pedestrians loudspeaker,vehicle horn 20-10-2020 night 21:10 21:12 62.8 49.7 56.2 45.5 49.4 music coming out from the loudspeakers at the nearby durga pandal was audible,vechiles passing through near by main road MEASUREMENT NOISE LEVEL (dB) On site noise source Off site noise source OBSERVATION POINT- 4
  • 13.
    0 10 20 30 40 50 60 morning afternoon eveningnight 42.1 43 51.7 53.7 OBSERVATION POINT-1 52 54 56 58 60 62 64 66 68 morning afternoon evening night 57.1 65.9 66.3 63.1 OBSERVATION POINT- 2 60 61 62 63 64 65 66 67 morning afternoon evening night 63.4 64.4 66.8 62.9 OBSERVATION POINT- 3 0 10 20 30 40 50 60 morning afternoon evening night 42.9 49.6 58.3 49.4 OBSERVATION POINT- 4 ANALYSIS AND RESULT
  • 14.
    0 10 20 30 40 50 60 70 P O IN T - 1 P O I N T - 2 P O I N T - 3 P O I N T - 4 51.7 66.3 66.8 58.3 EVENING 0 10 20 30 40 50 60 70 P O I N T - 1 P O I N T - 2 P O I N T - 3 P O I N T - 4 53.7 63.1 62.9 49.4 NIGHT 0 10 20 30 40 50 60 70 P O I N T - 1 P O I N T - 2 P O I N T - 3 P O I N T - 4 43 65.9 64.4 49.6 AFTERNOON 0 10 20 30 40 50 60 70 P O I N T - 1 P O I N T - 2 P O I N T - 3 P O I N T - 4 42.1 57.1 63.4 42.9 MORNING
  • 15.
    The measurements ofnoise levels have been recorded in working day (Monday 20-10-2020) at the four different observation points at selected site in vicinity of Beohari. The analysis has revealed the following points-  The noise pollution levels are more than the permissible limits at the observation point 2 and 3 if we consider that as a residential area. However the other two points 1 and 4 have noise emissions under the permissible limits.  The maximum noise levels are especially determined by the heavy traffic, technical Status of the vehicles and quality of the road situation.  Evening time is the peak time of the noise level for points 2, 3 and 4.the major source of noise at this time period is the traffic on the road.  The variation in the noise levels at the observation points is directly related to the distance between the state highway and the location of the point and also to the sound barriers like trees and walls coming in between the noise source and the point.  It is suggested that the necessary abatement measures to reduce the noise levels in these areas should be implemented in order to improve the present status of human health and environment of the study area located in the Beohari. RESULT
  • 16.
    CONCLUSION • By analyzingthe data it has been found that the sound barriers like trees and walls are actually helping in reducing the noise intensity at observation point 1 and 4. • As compared to the other two points i.e. observation point 2 and 3 , points 1 and 4 have recorded low noise level because of the distance from the main road and also due to the presence of various sound barriers like trees ,buildings and walls between the state highway and the points . • • Only two points (2 and 3) have recorded high noise levels therefore the following measures should be taken with the aim of reducing the noise level produced by different sources: •  Banning the use of high decibel horns.  Banning the loudspeakers.  the rehabilitation of the infrastructure of the street networks of ways with intense traffic;  the implementation of the technical measures for noise levels;  Creating noise barriers alongside the road like trees and walls. Or grass walls.  blocking the ways of noise propagation by creating protection curtains, including green spaces within inhabited areas;  Performing special isolation for buildings against one or more types of environmental noise combined with ventilation or conditioned air facilities, in order to maintain high values of the isolations against environmental noise.