Downloaded 1,047 times


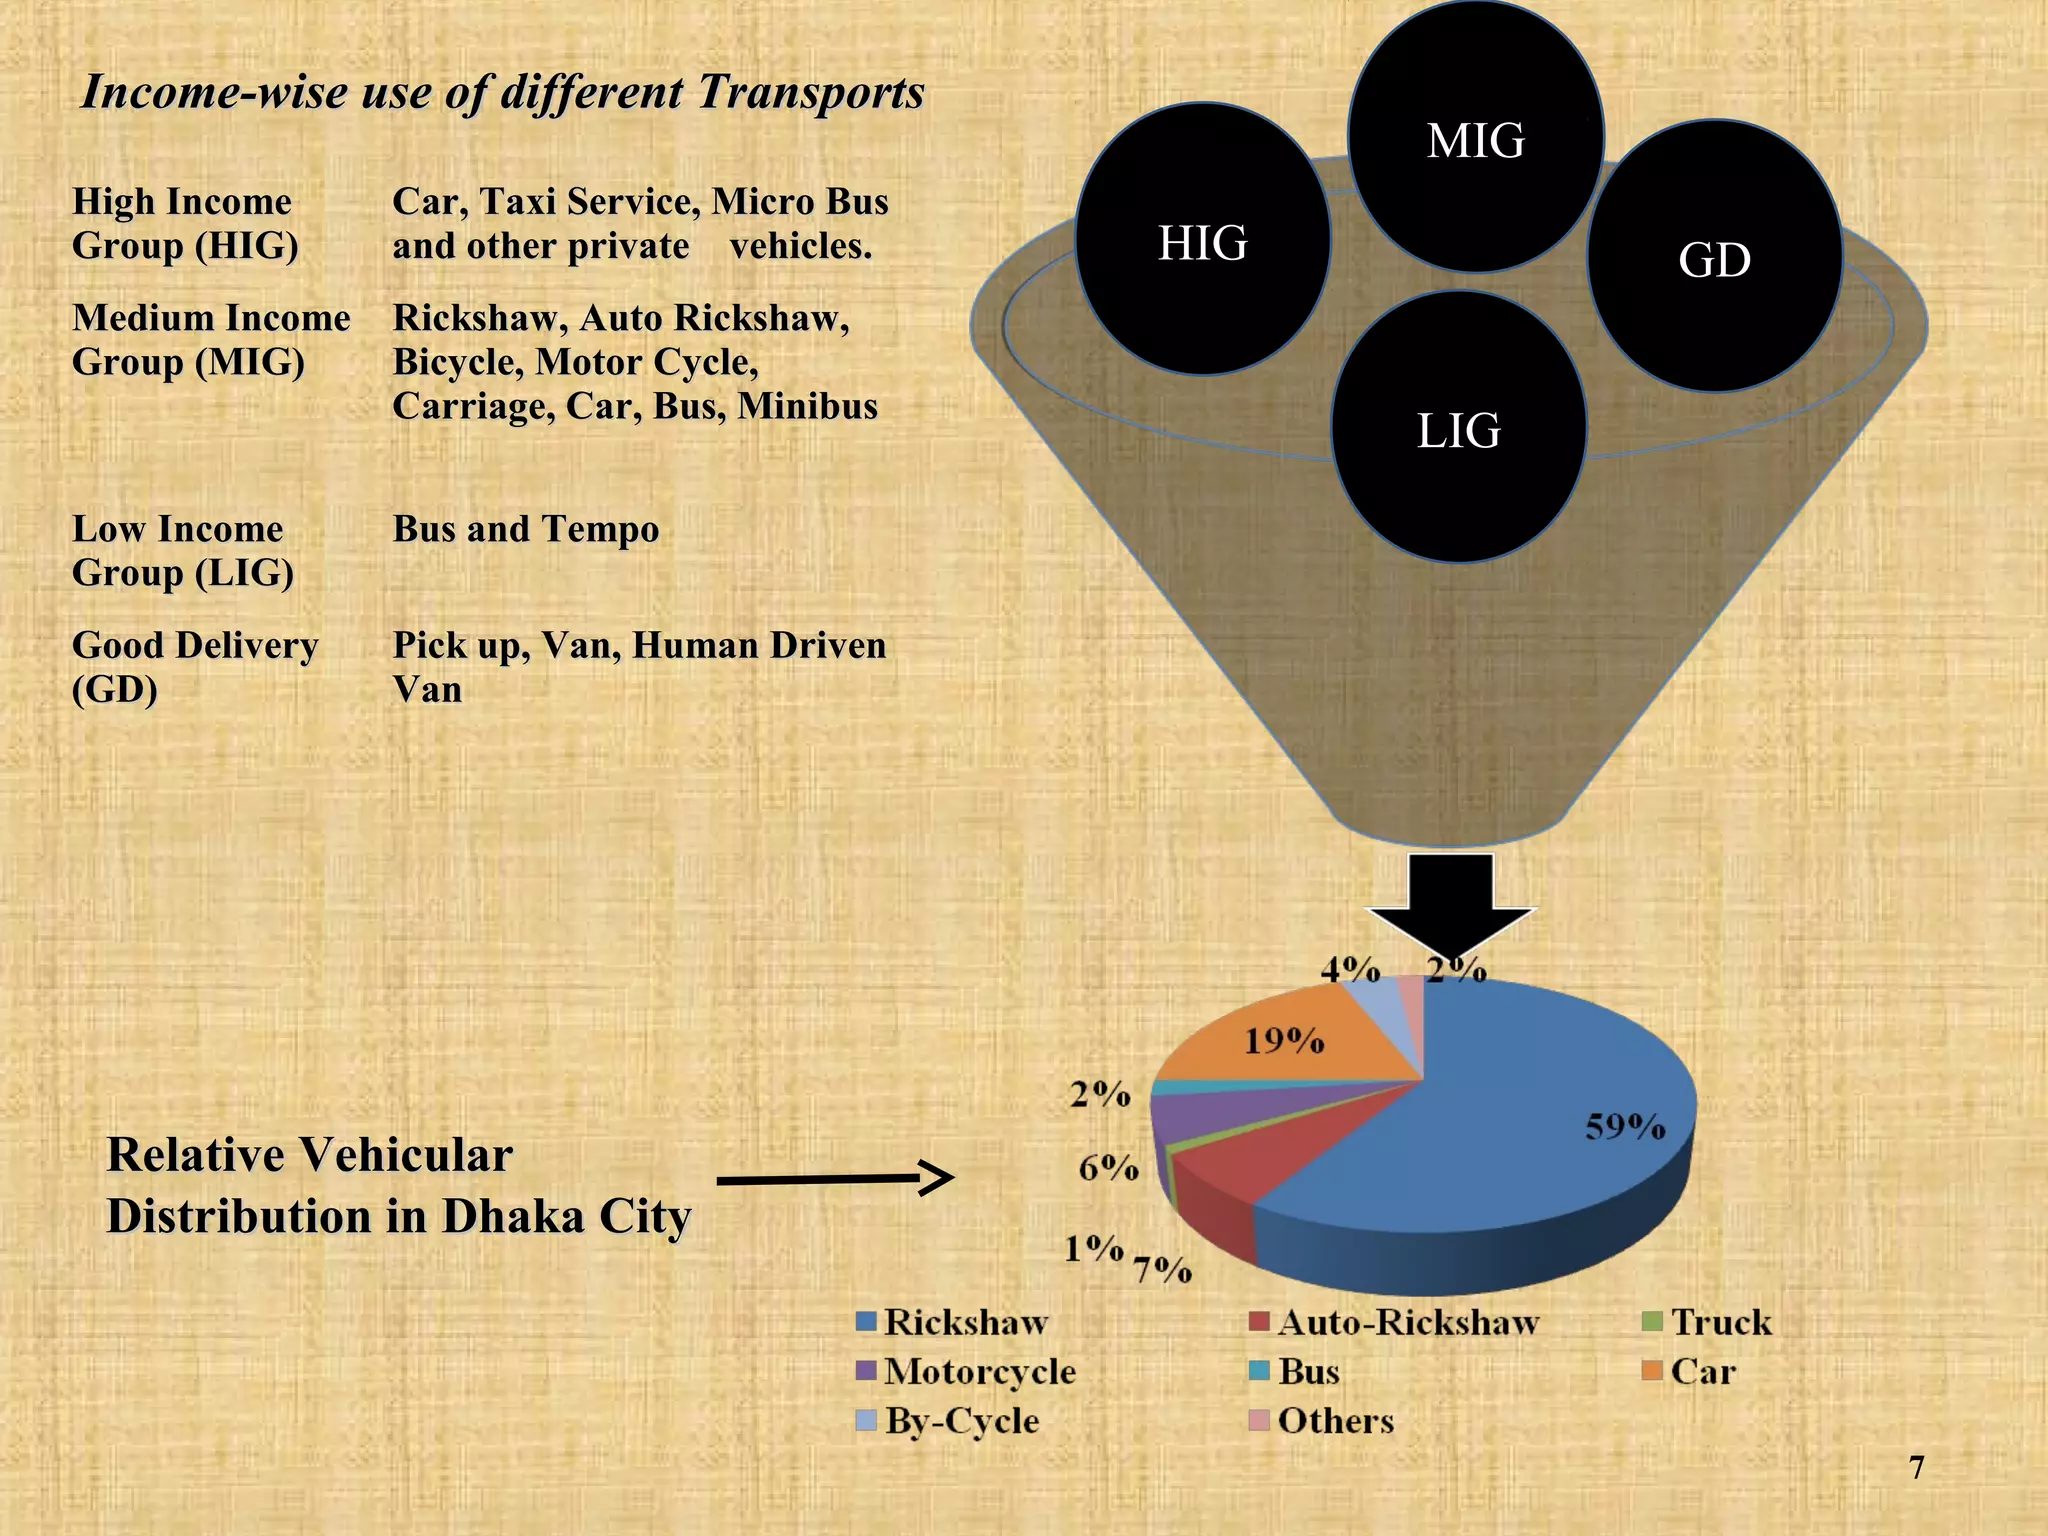

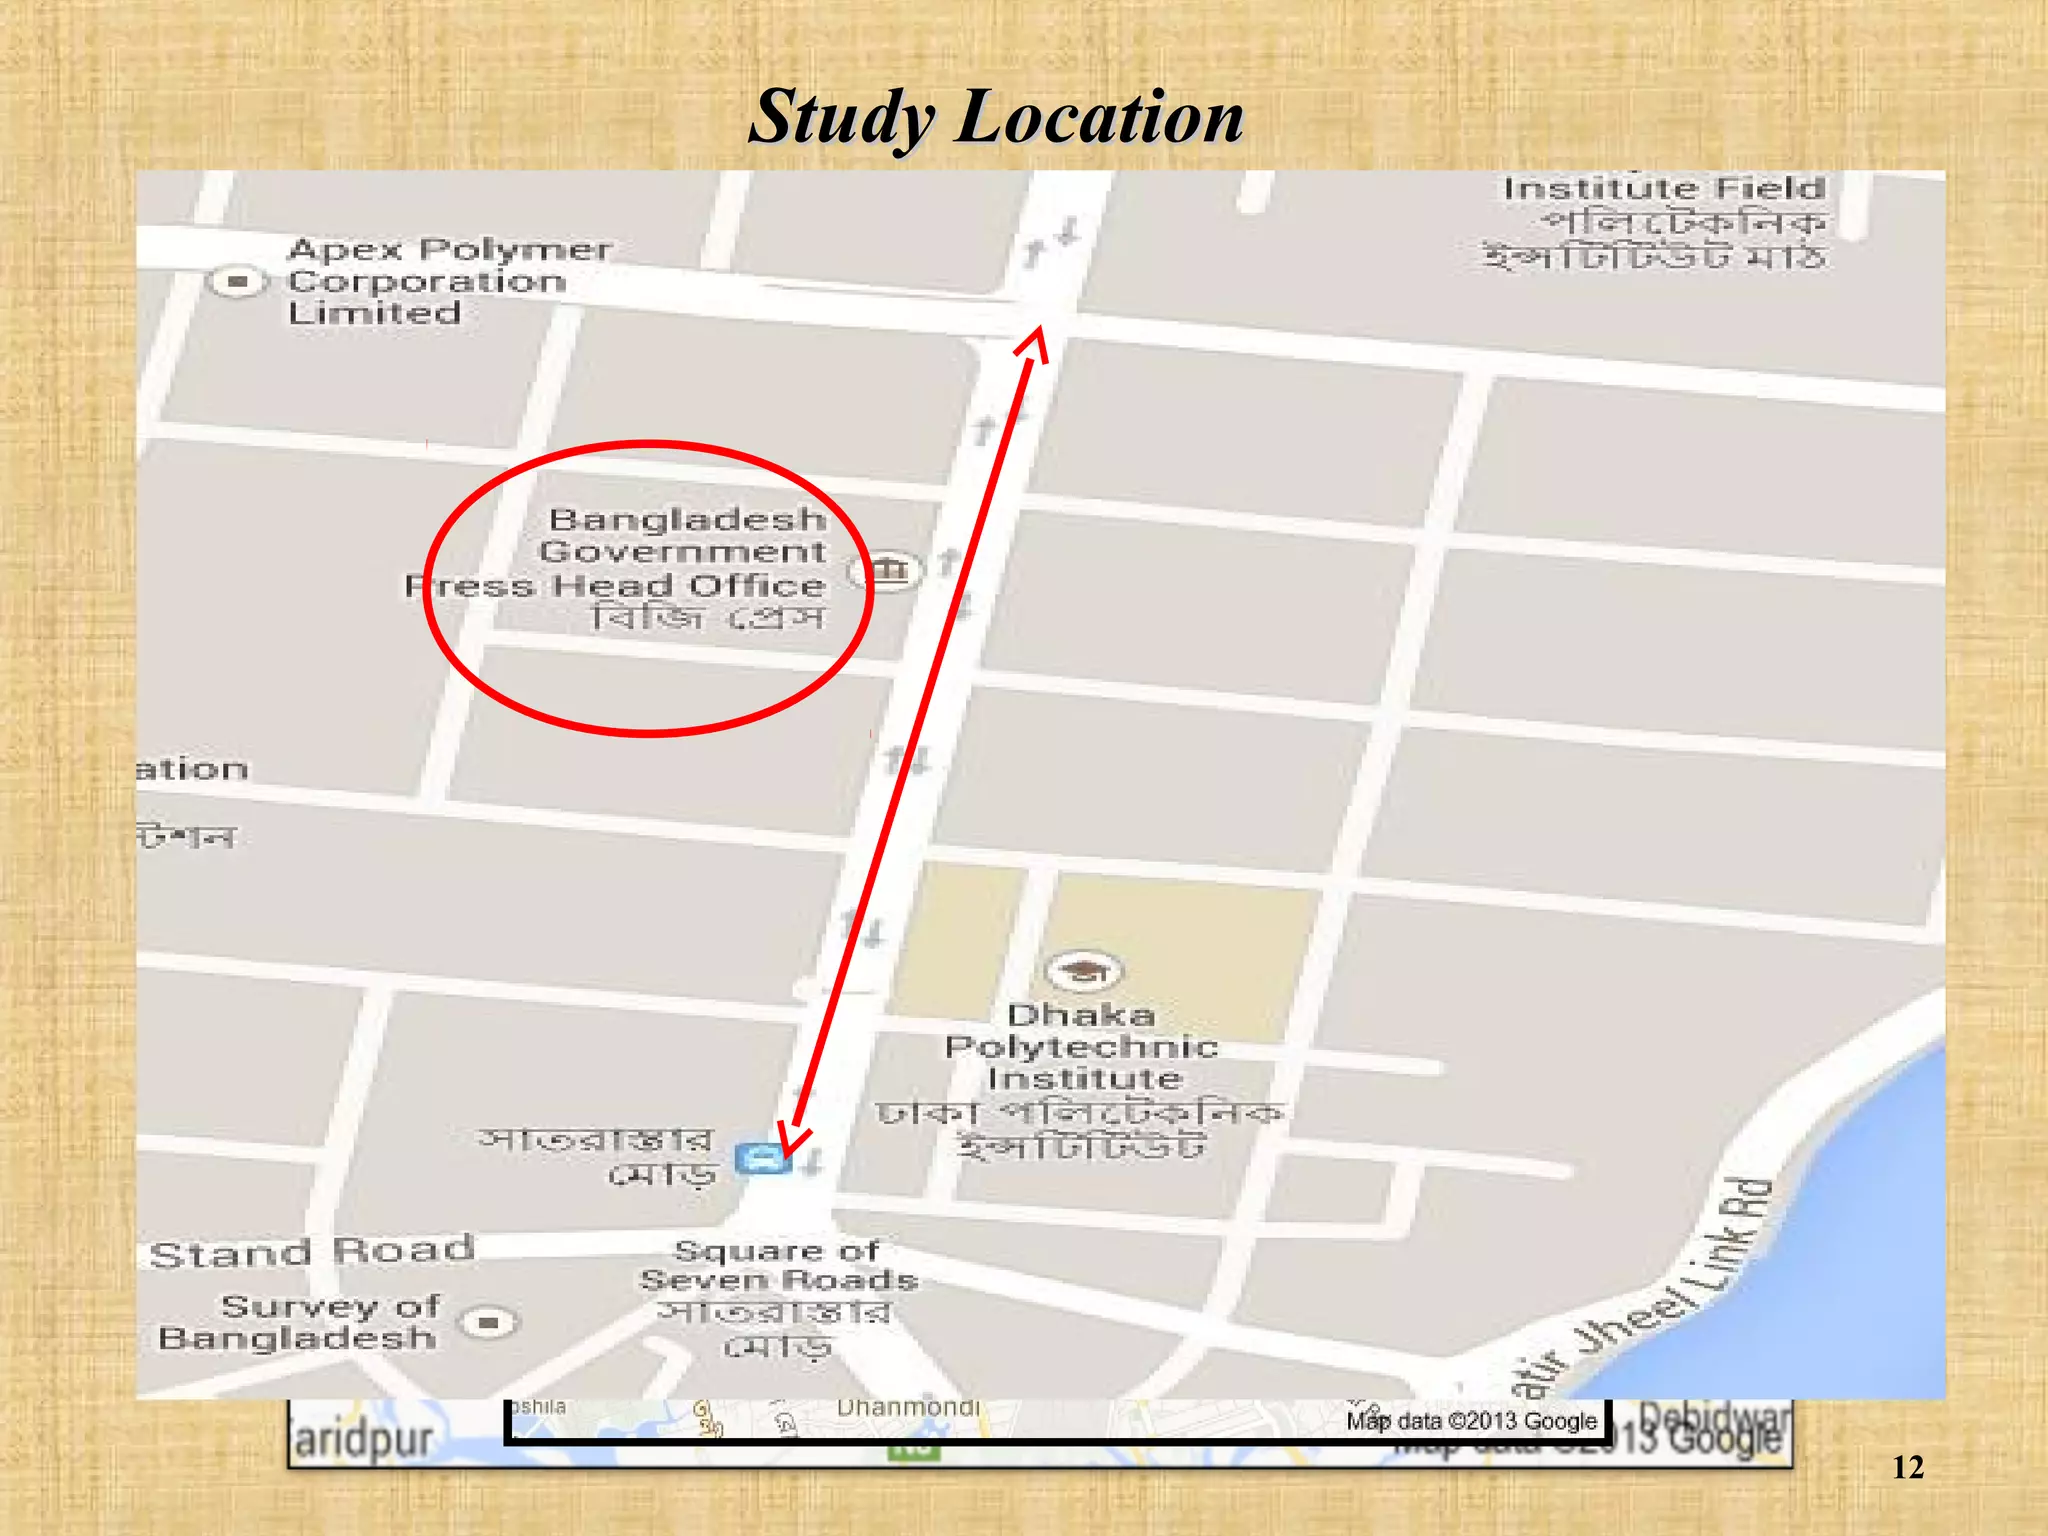


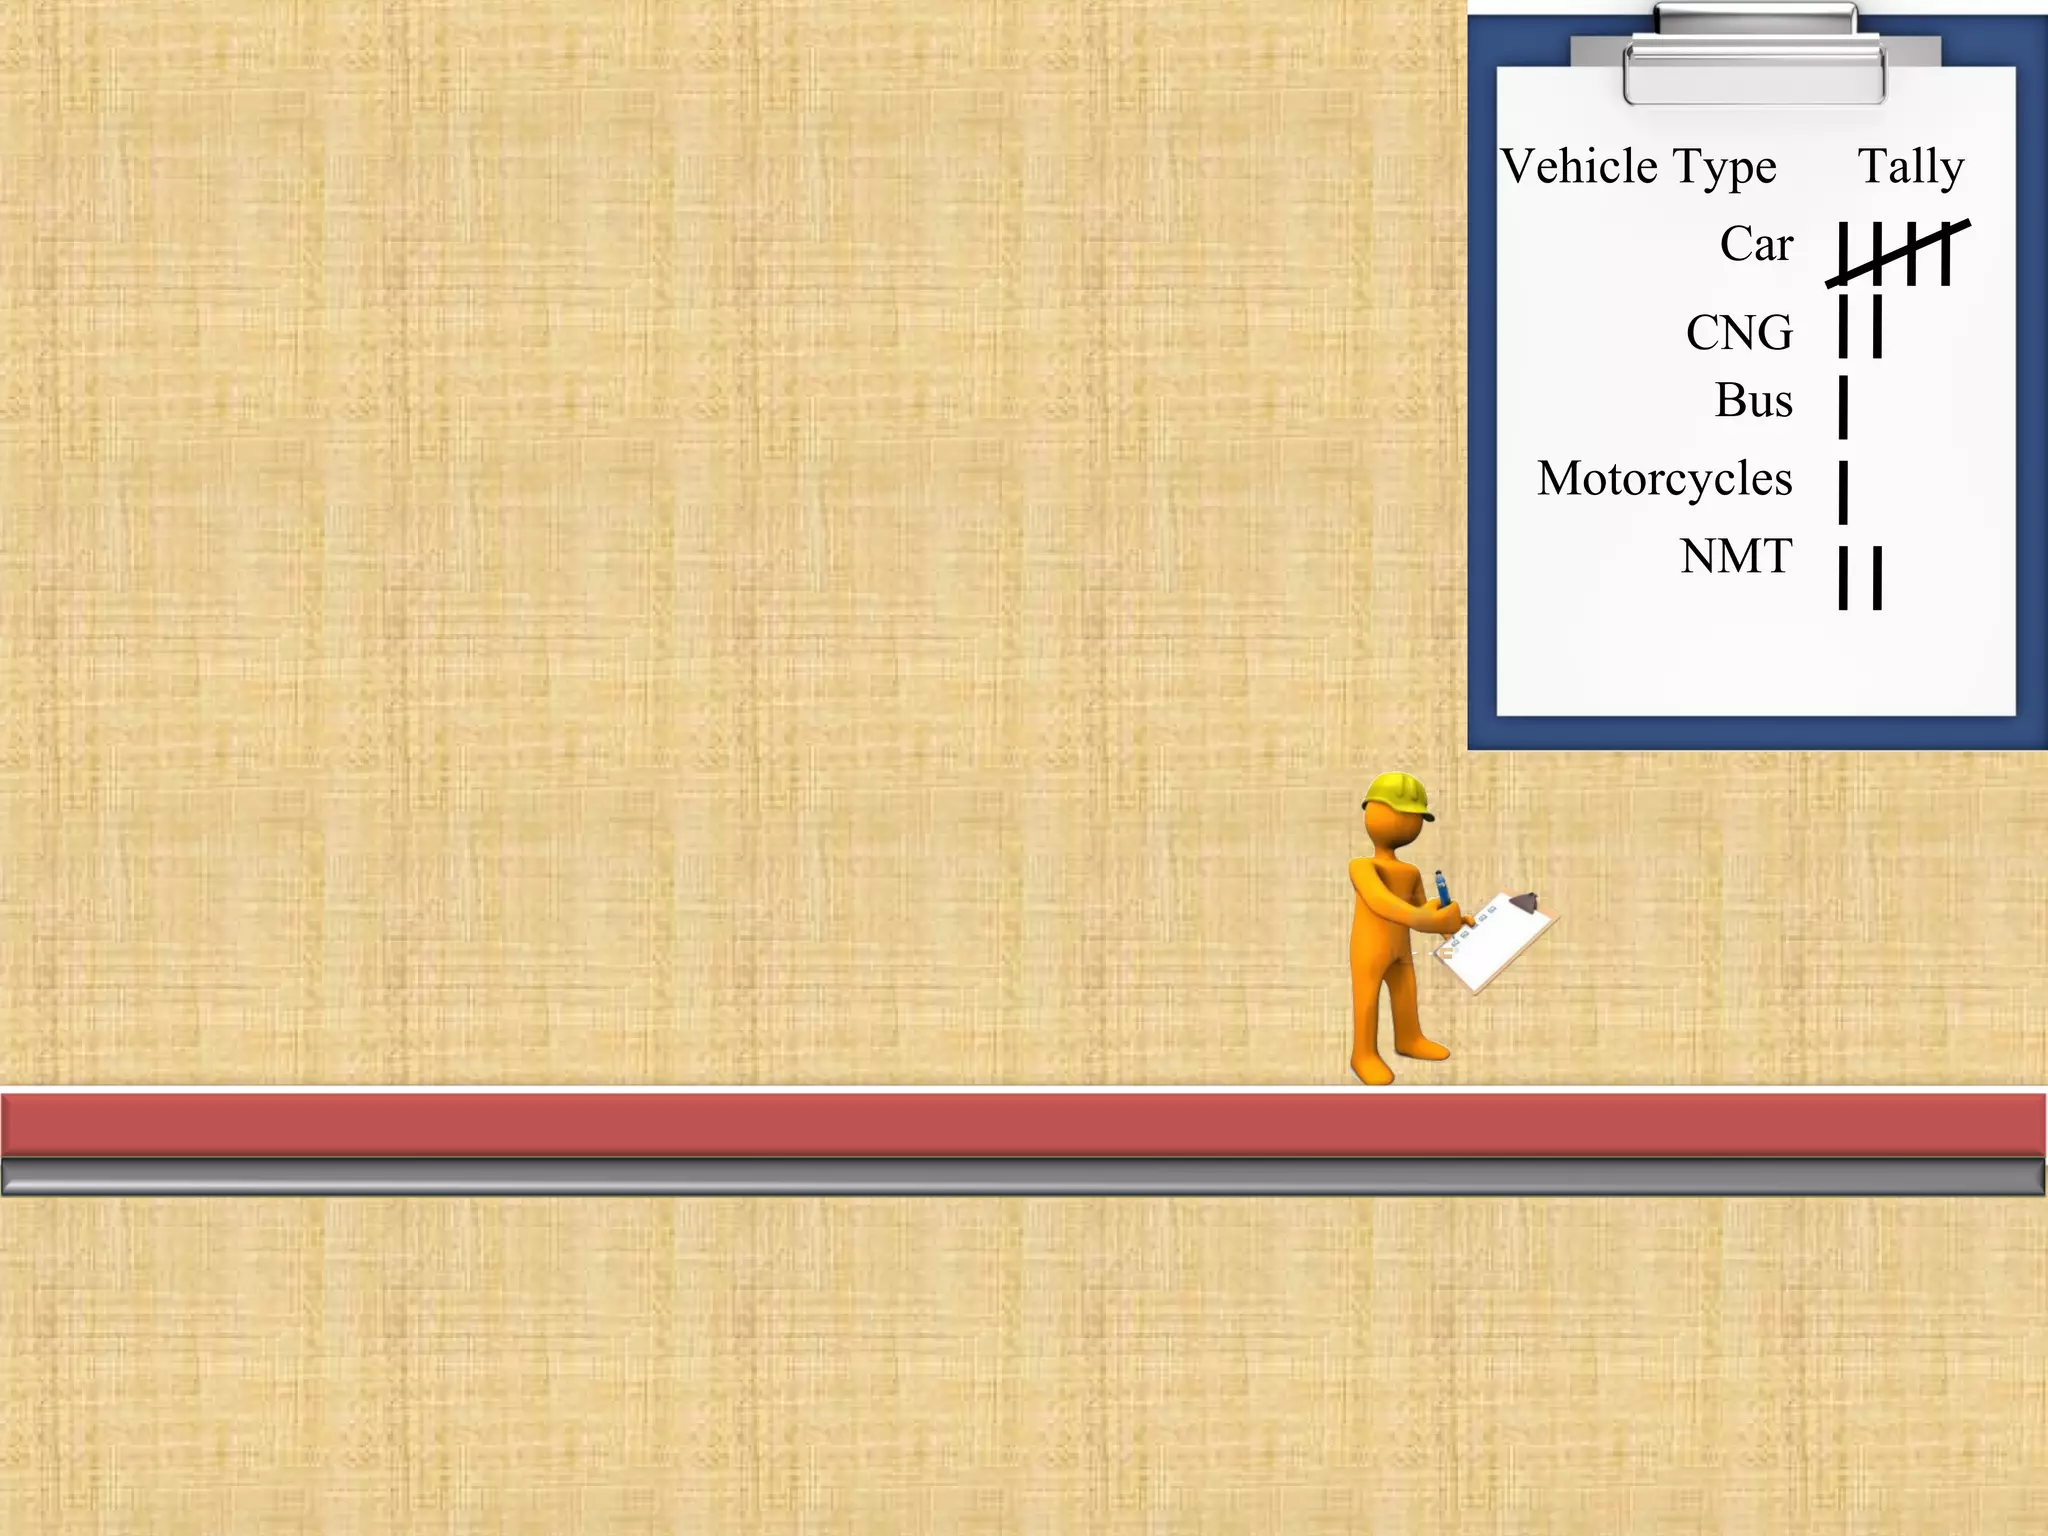
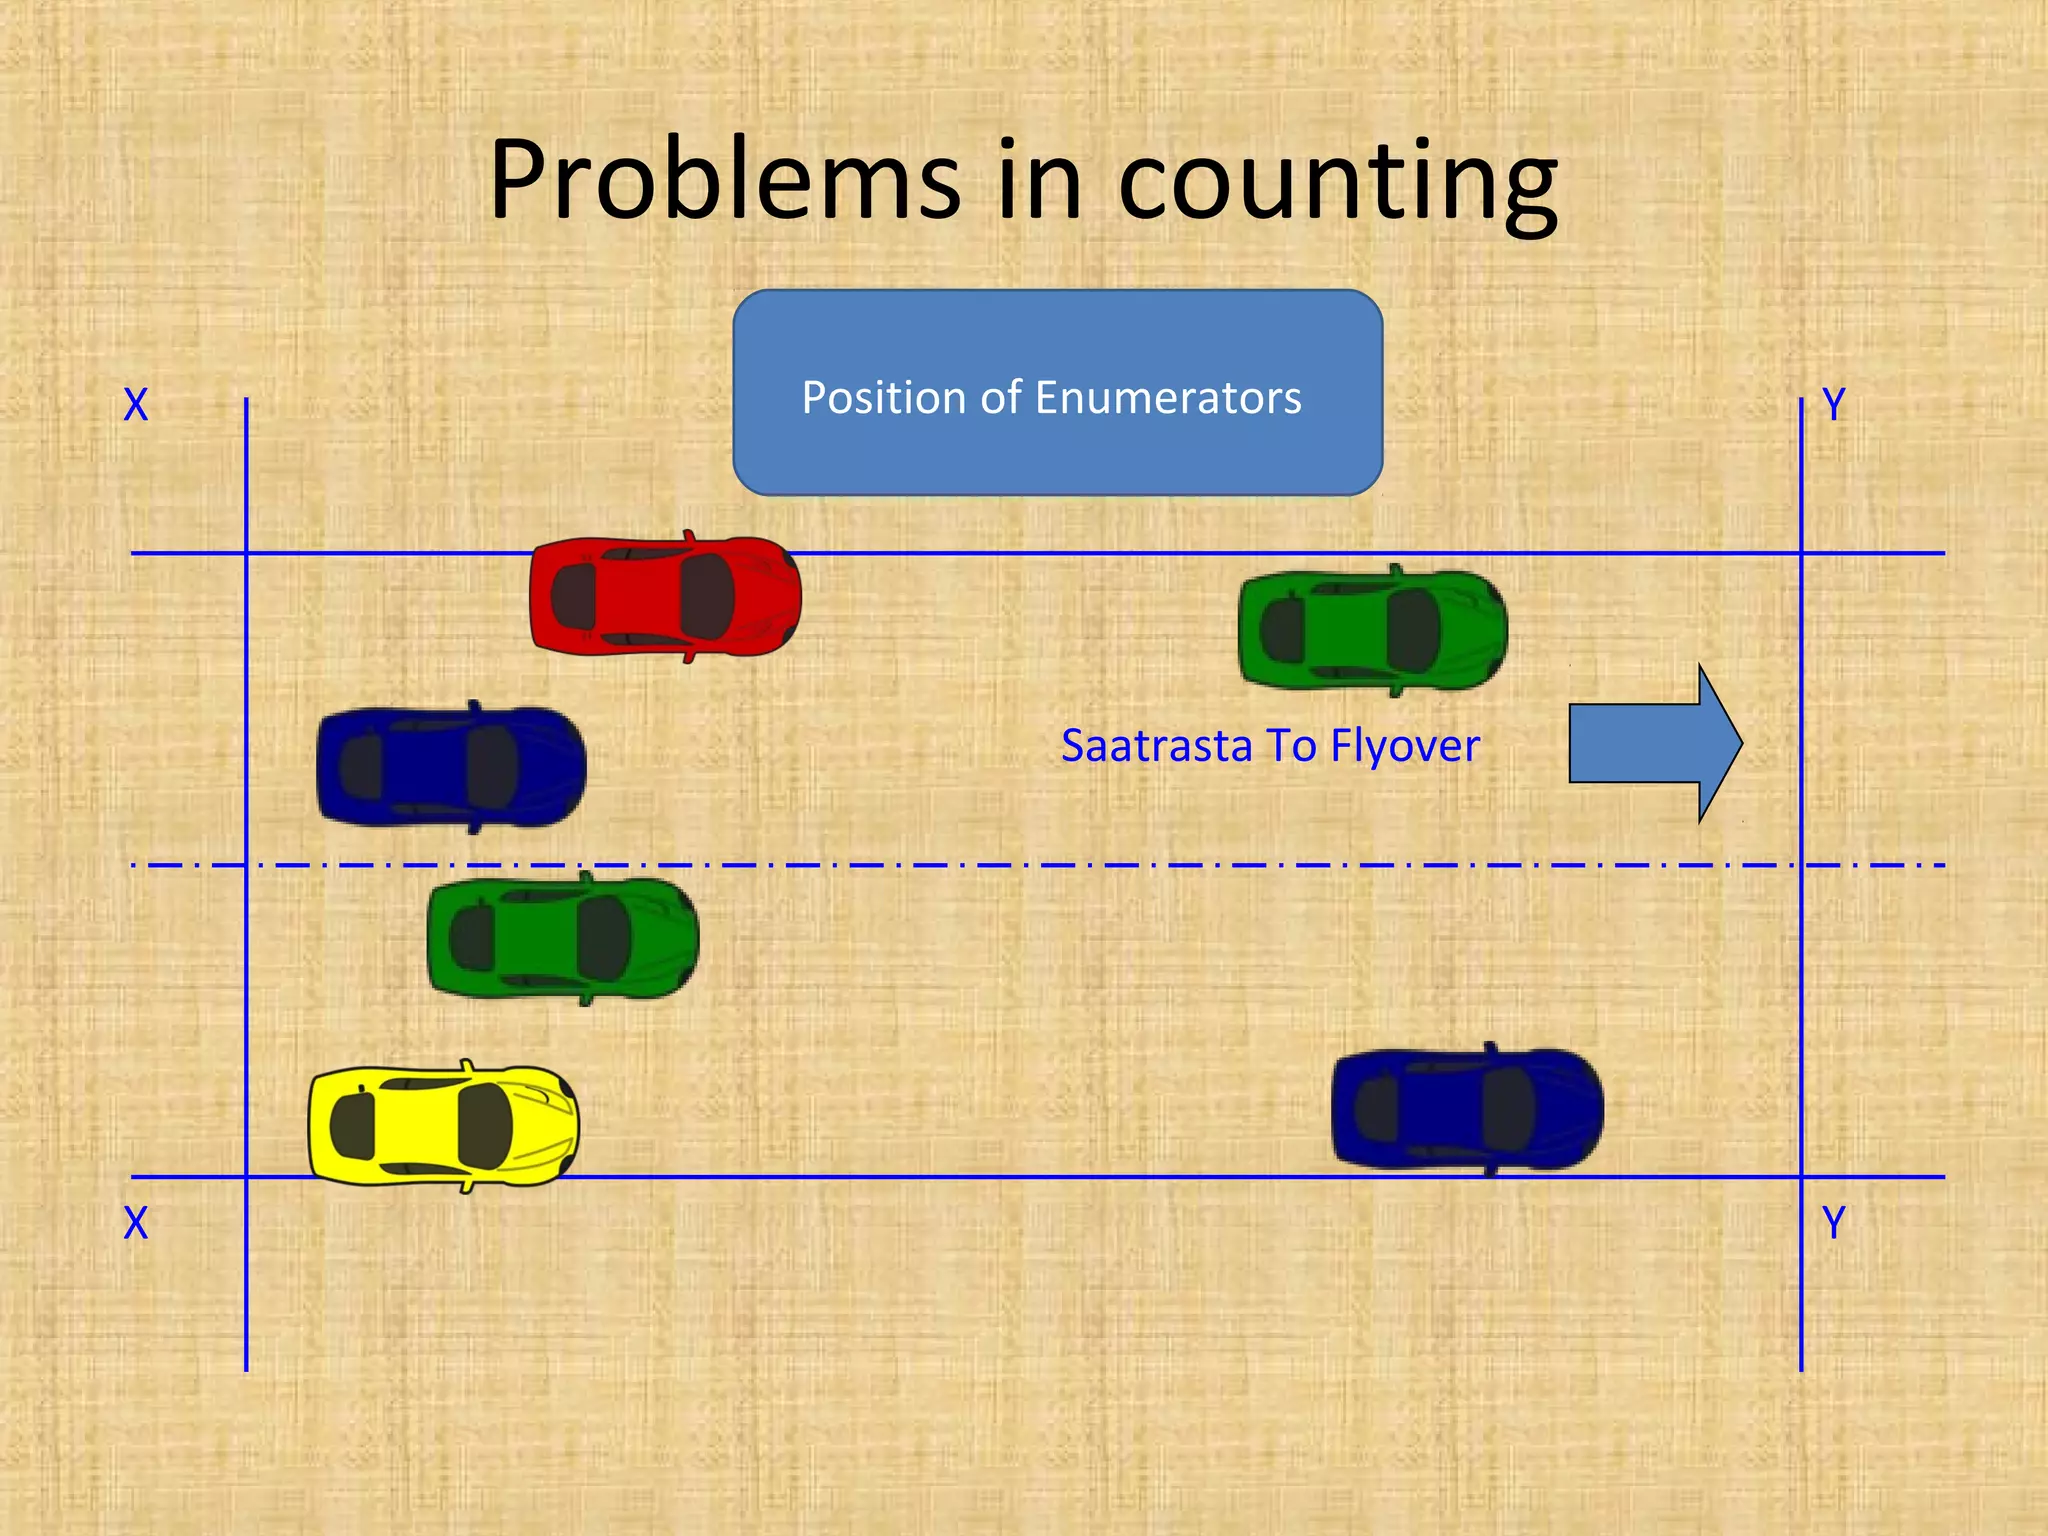
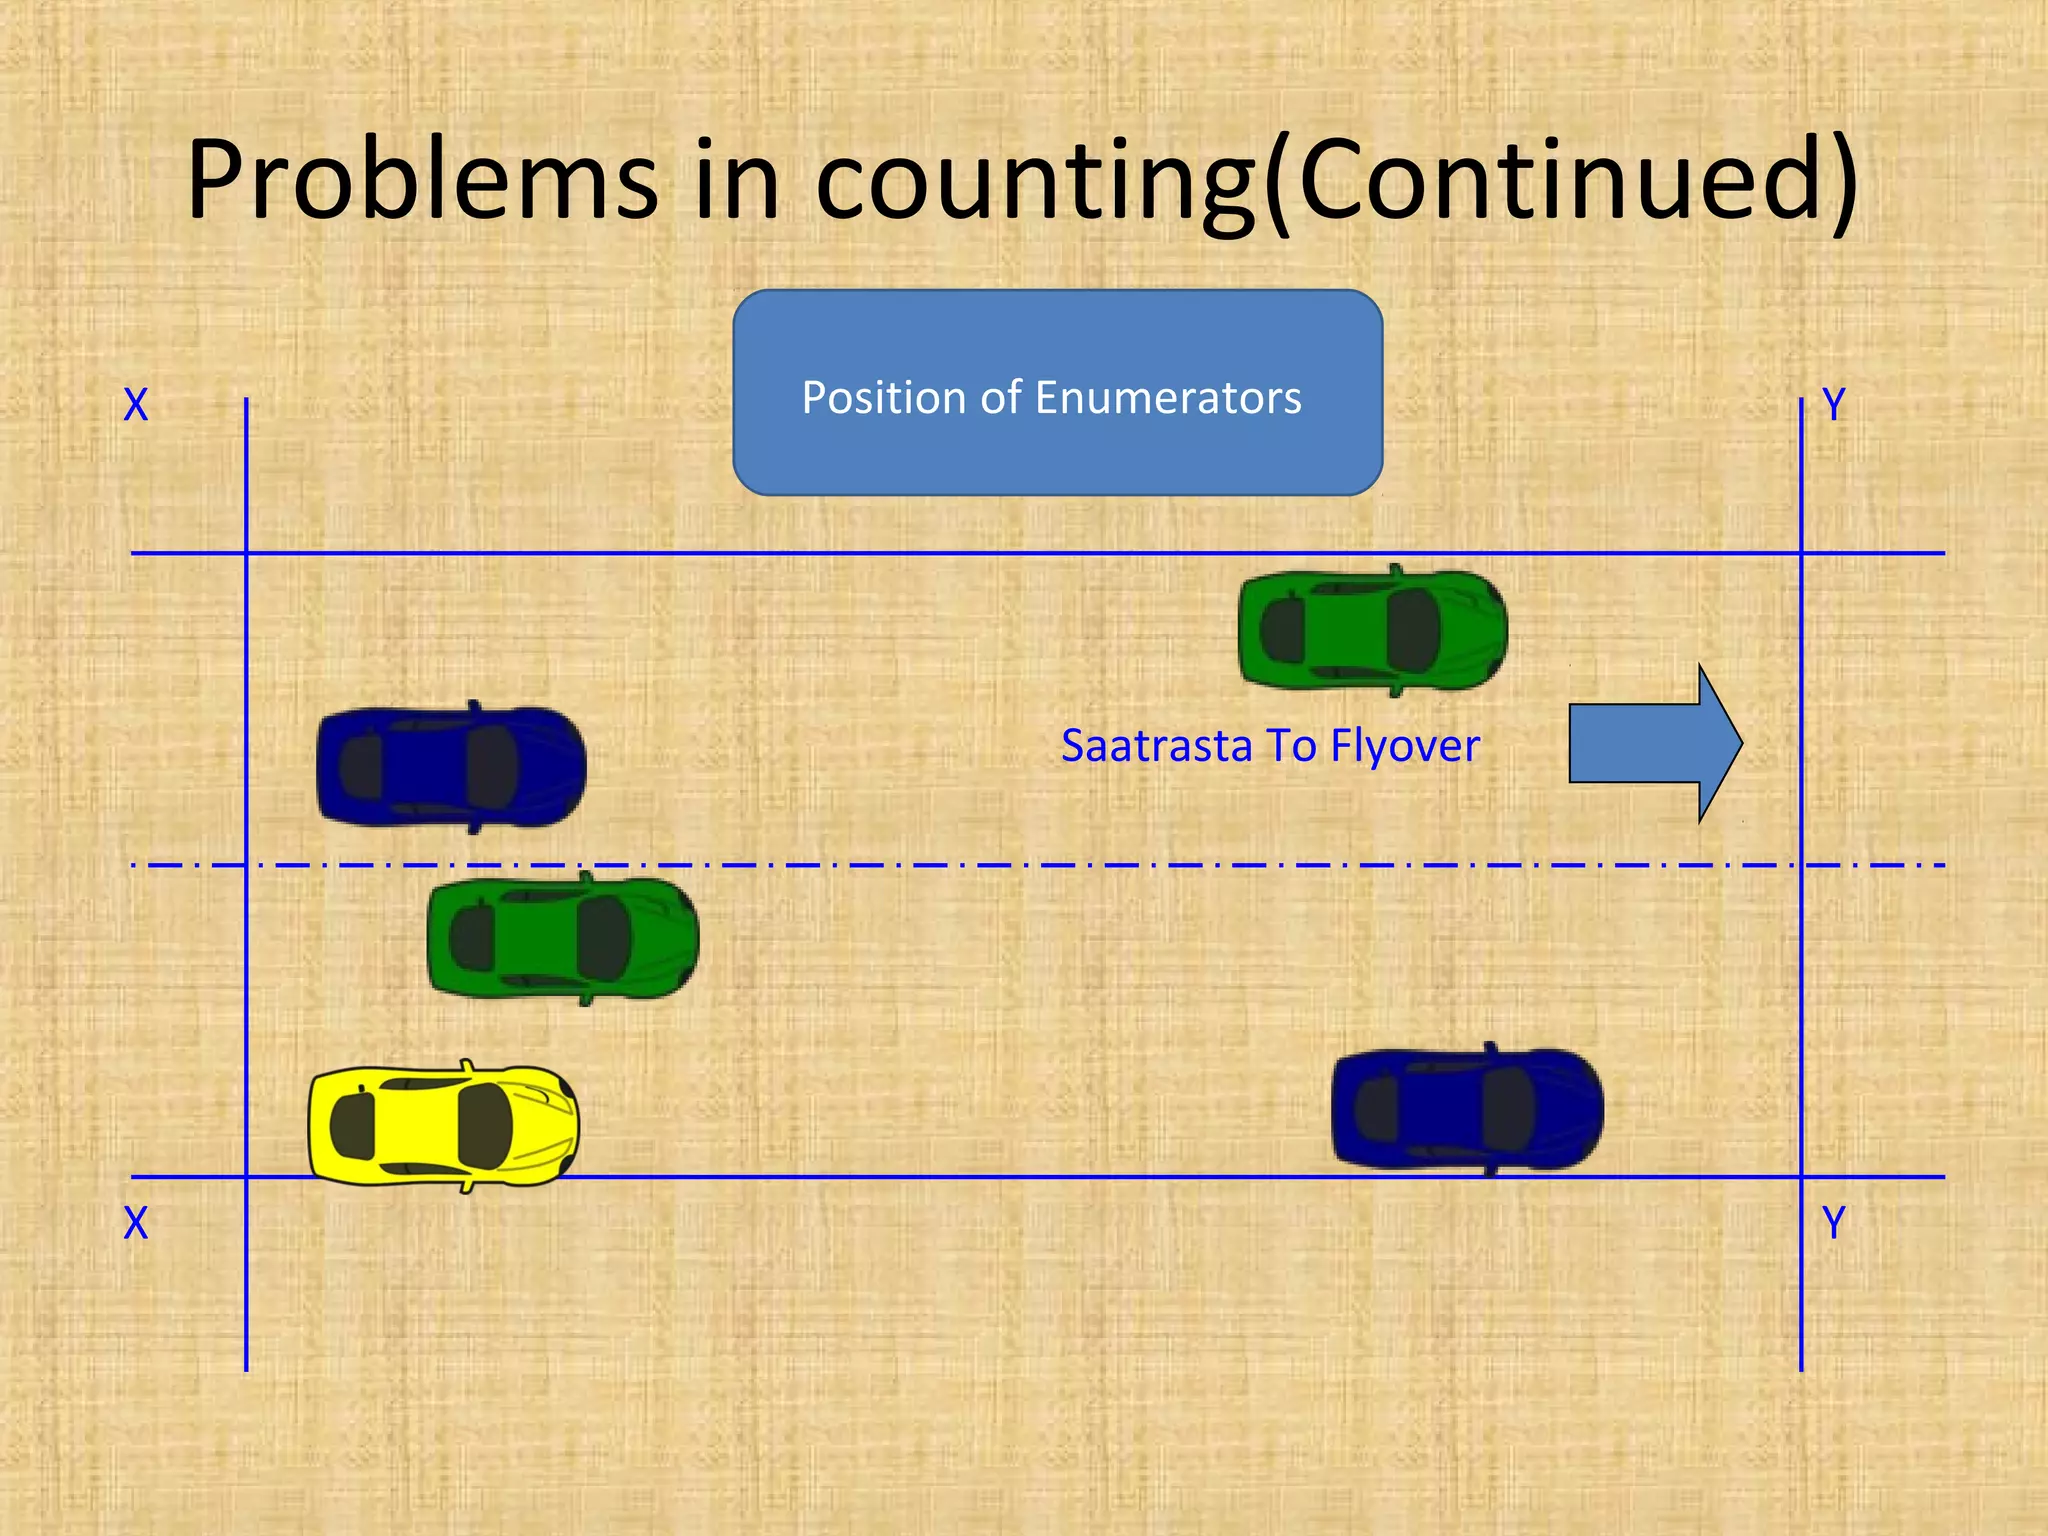
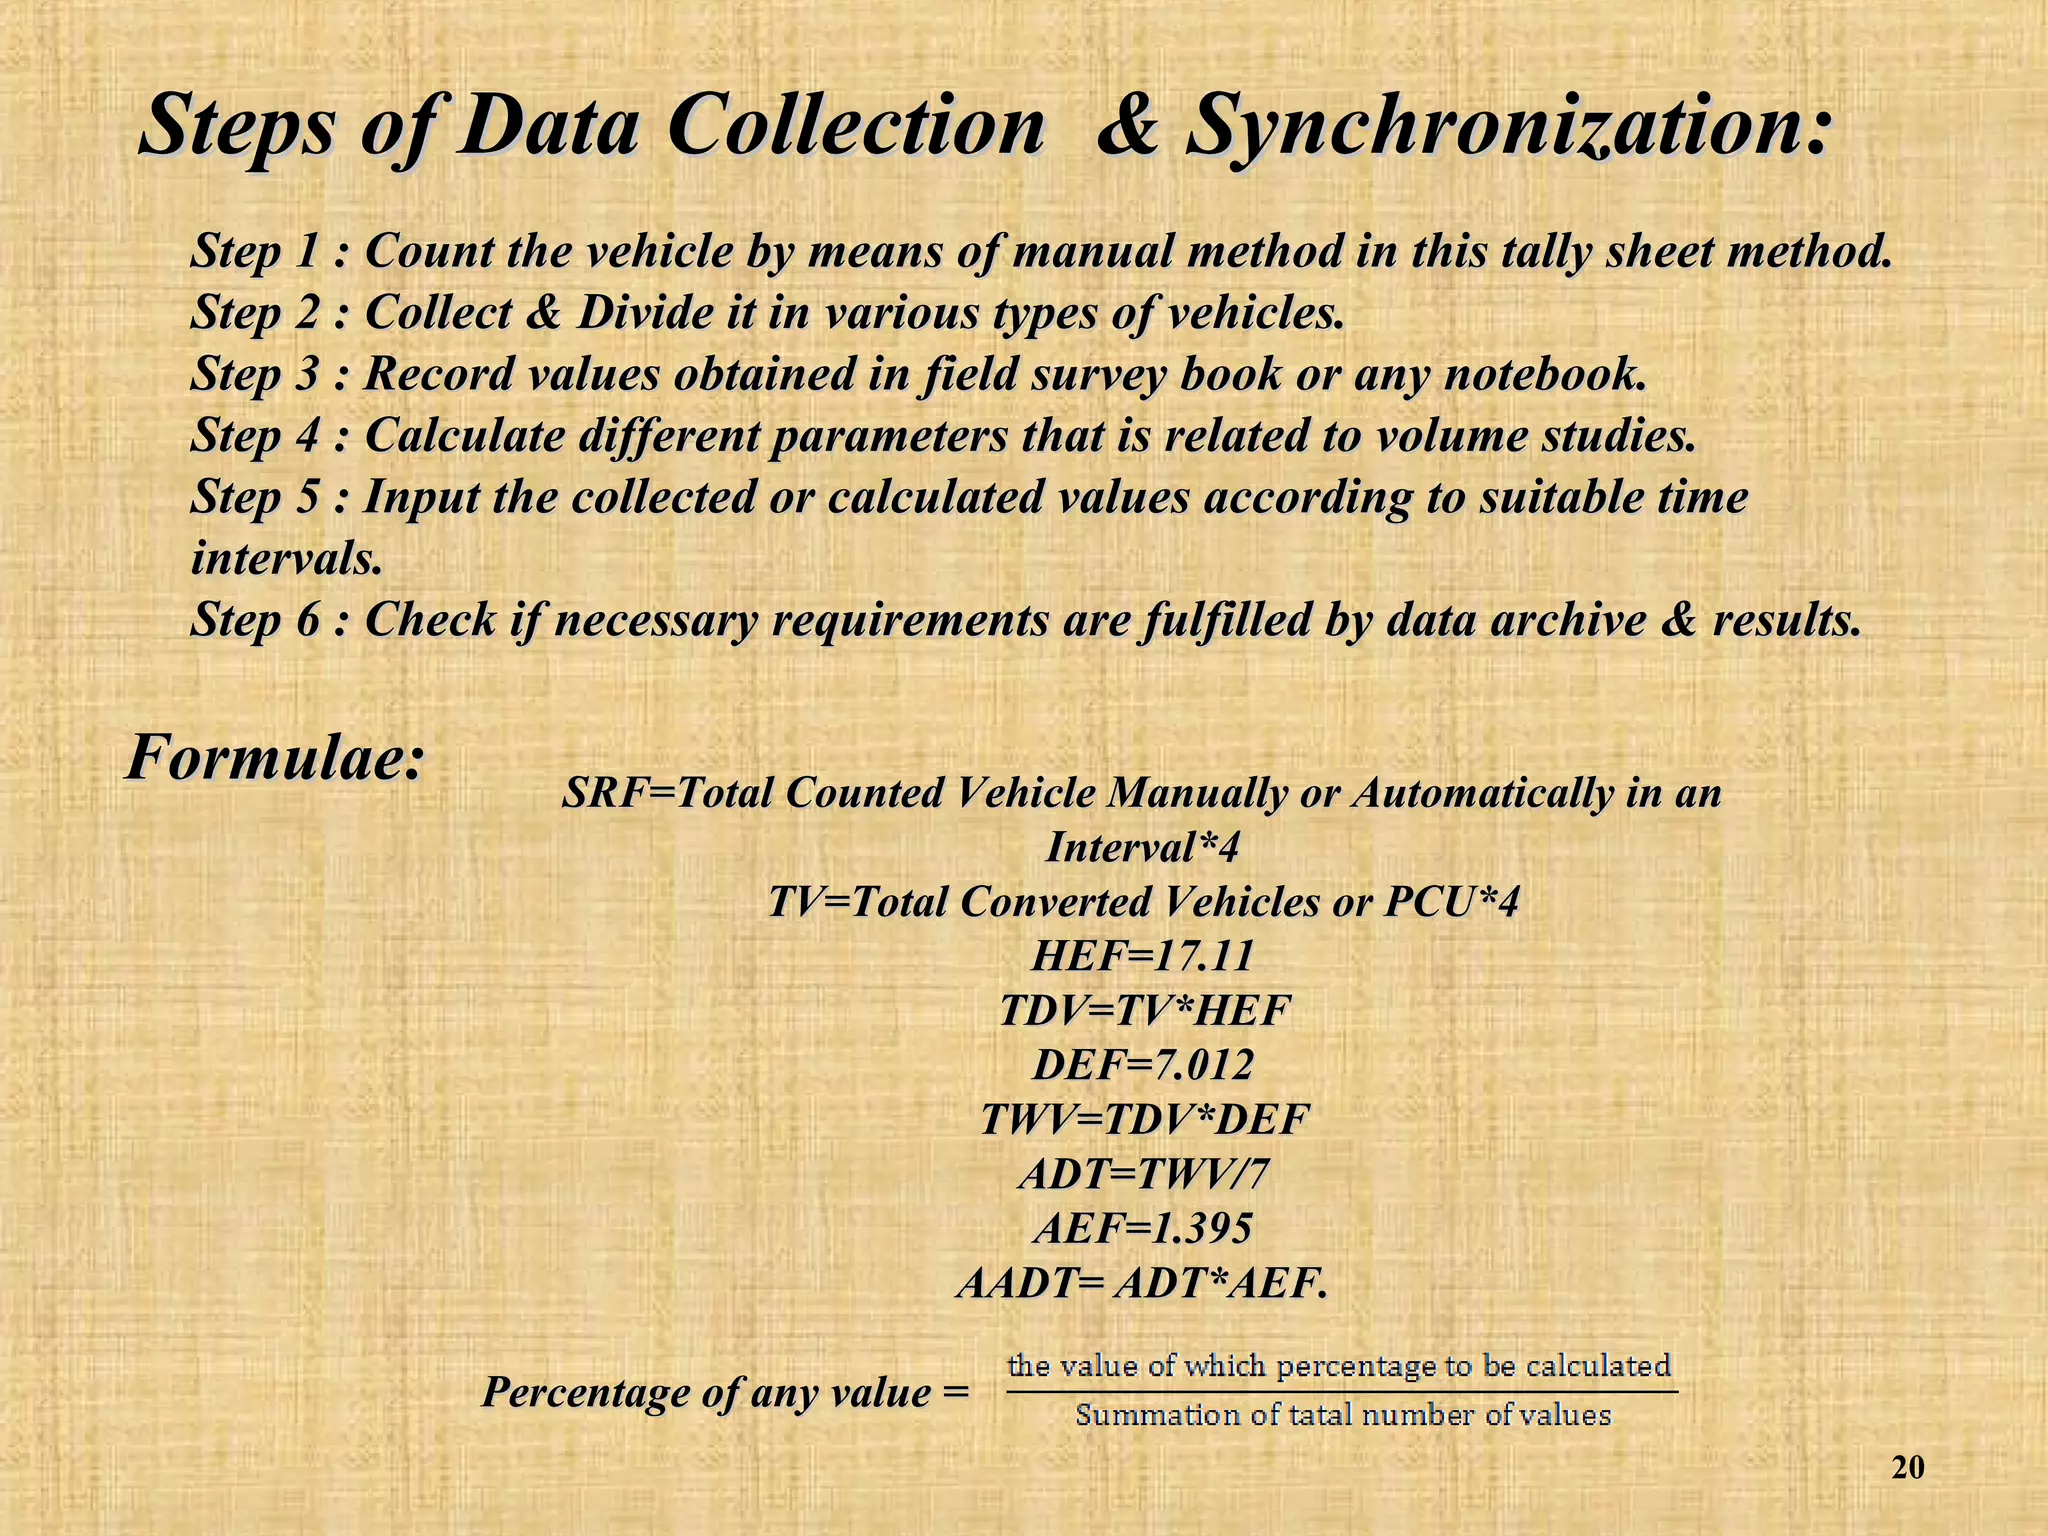
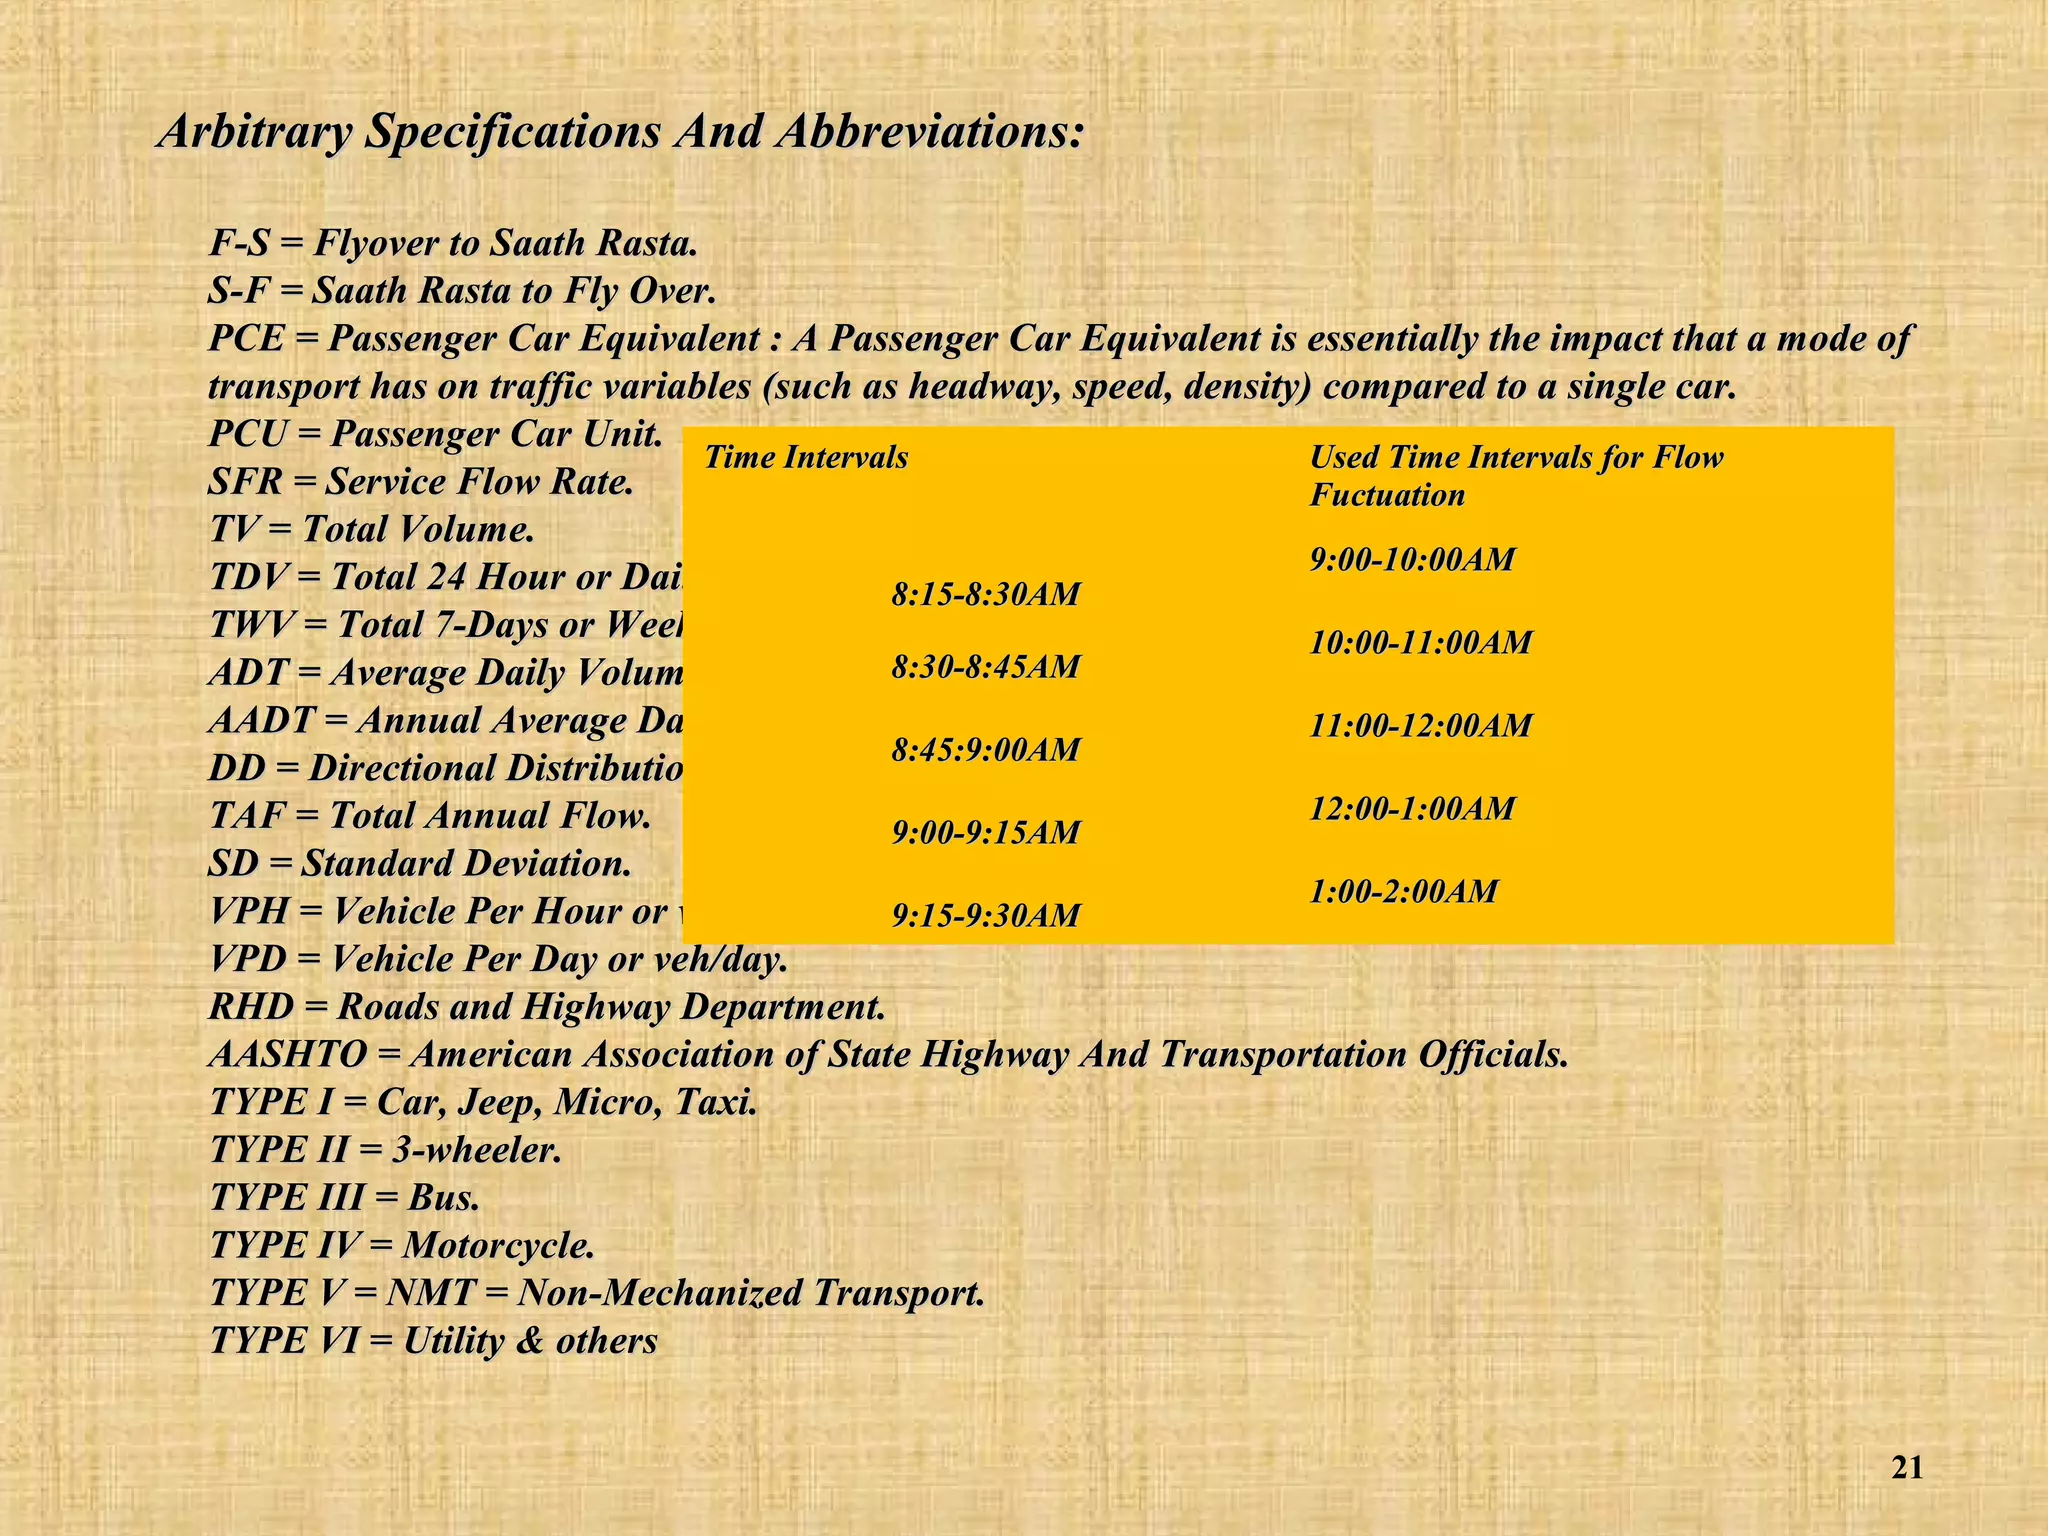
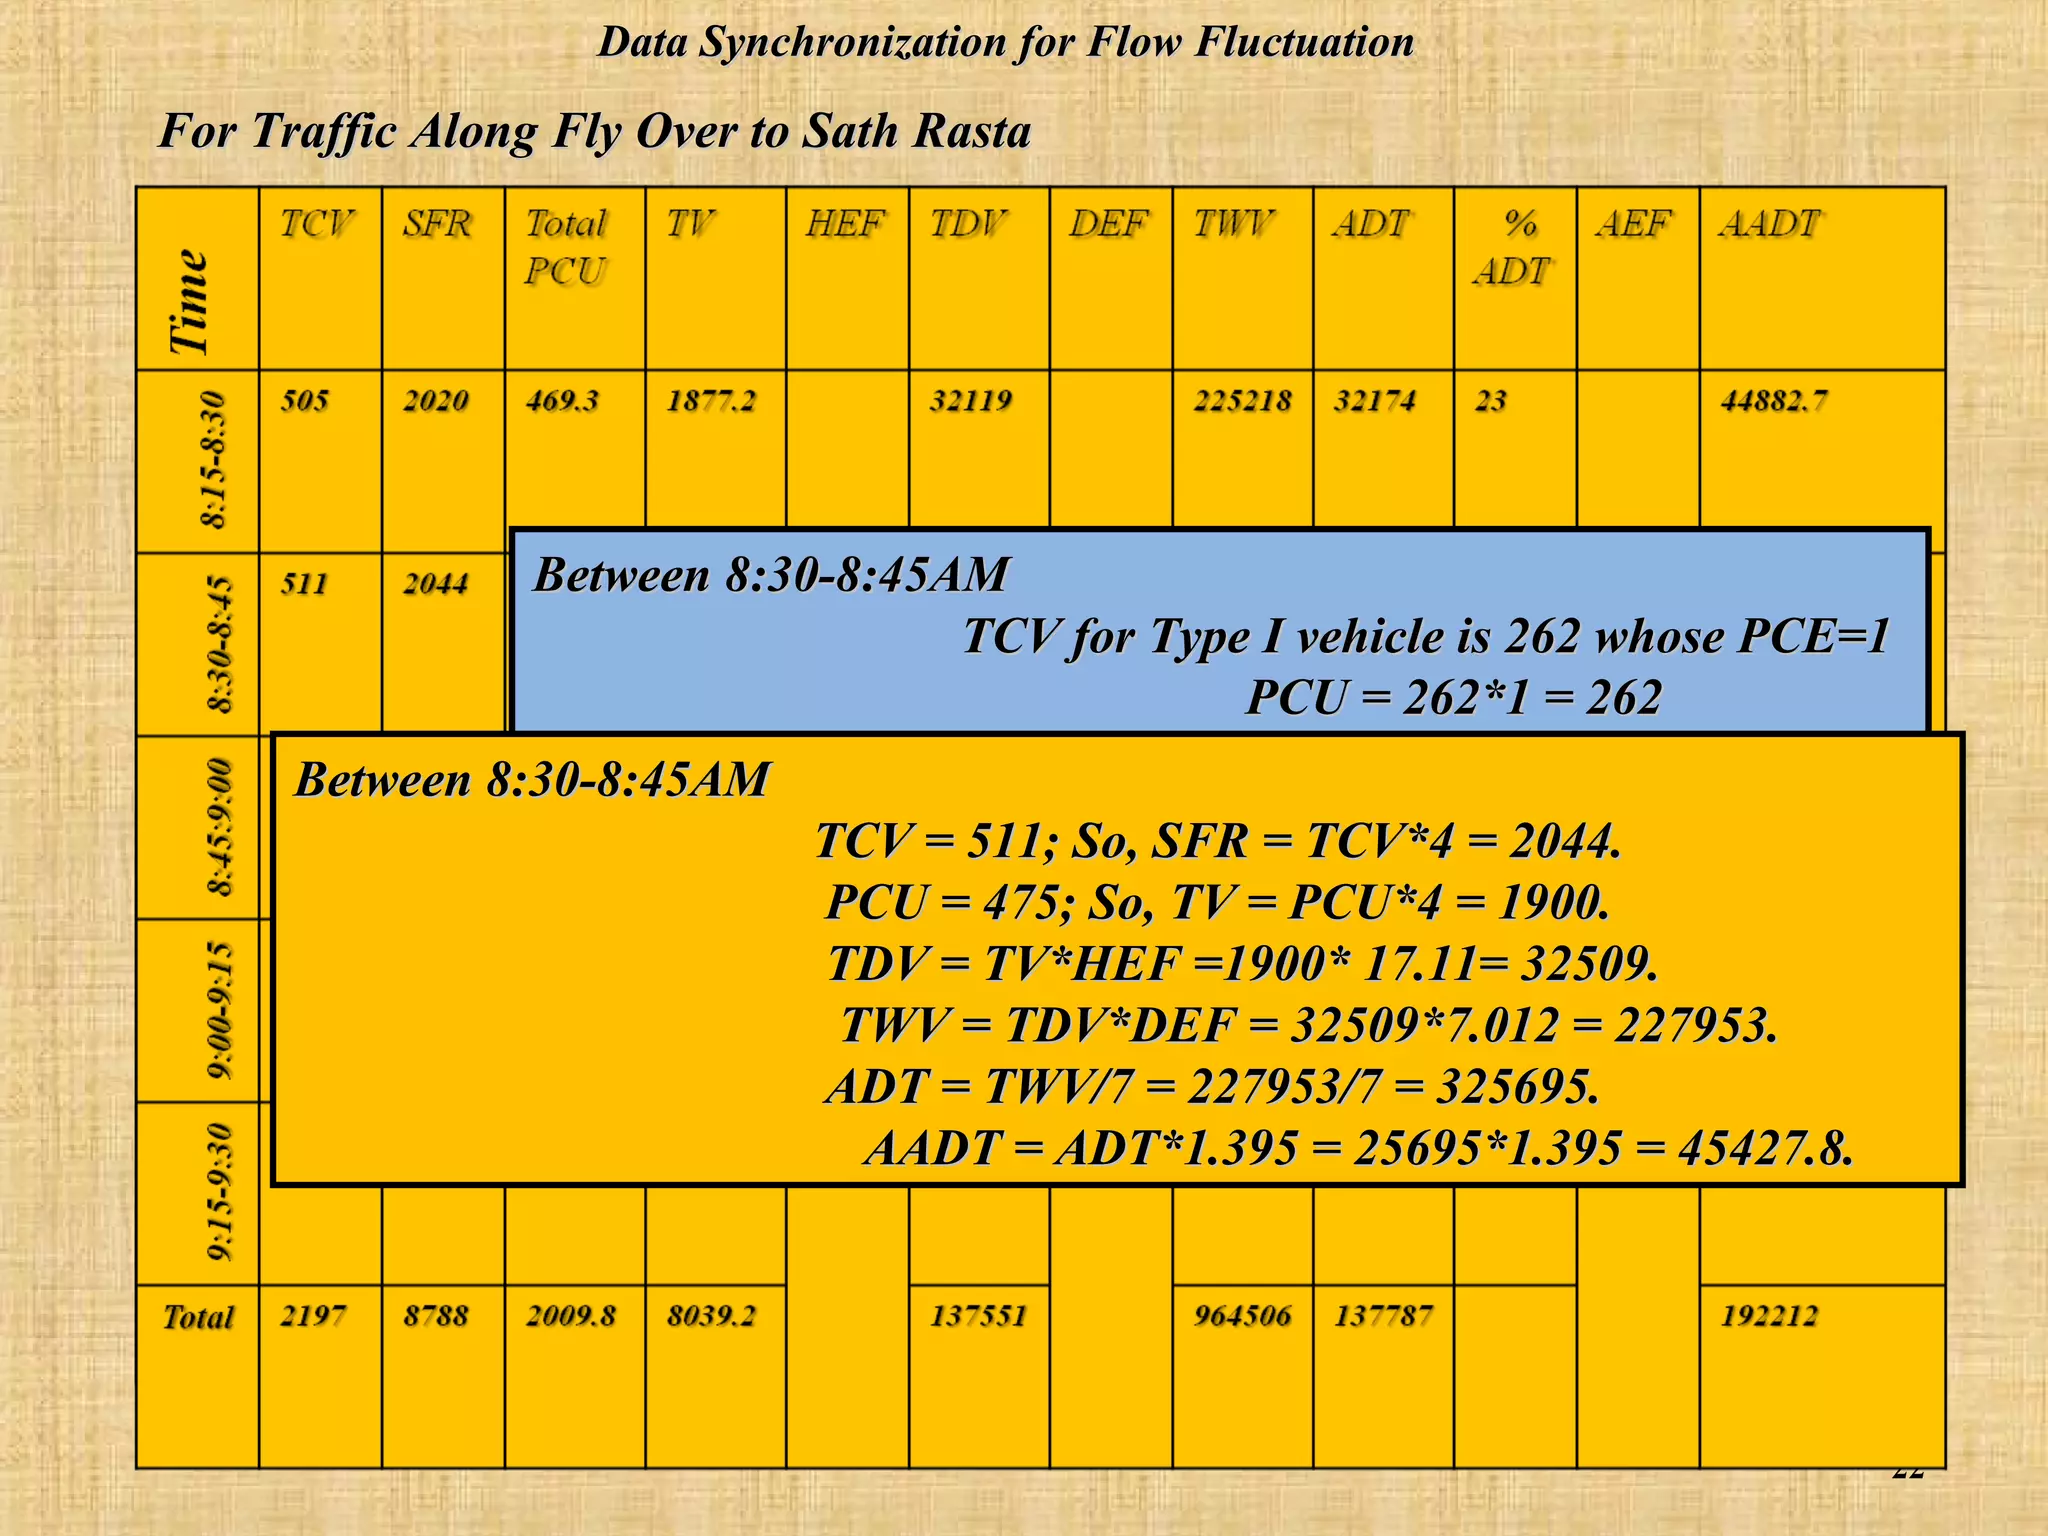
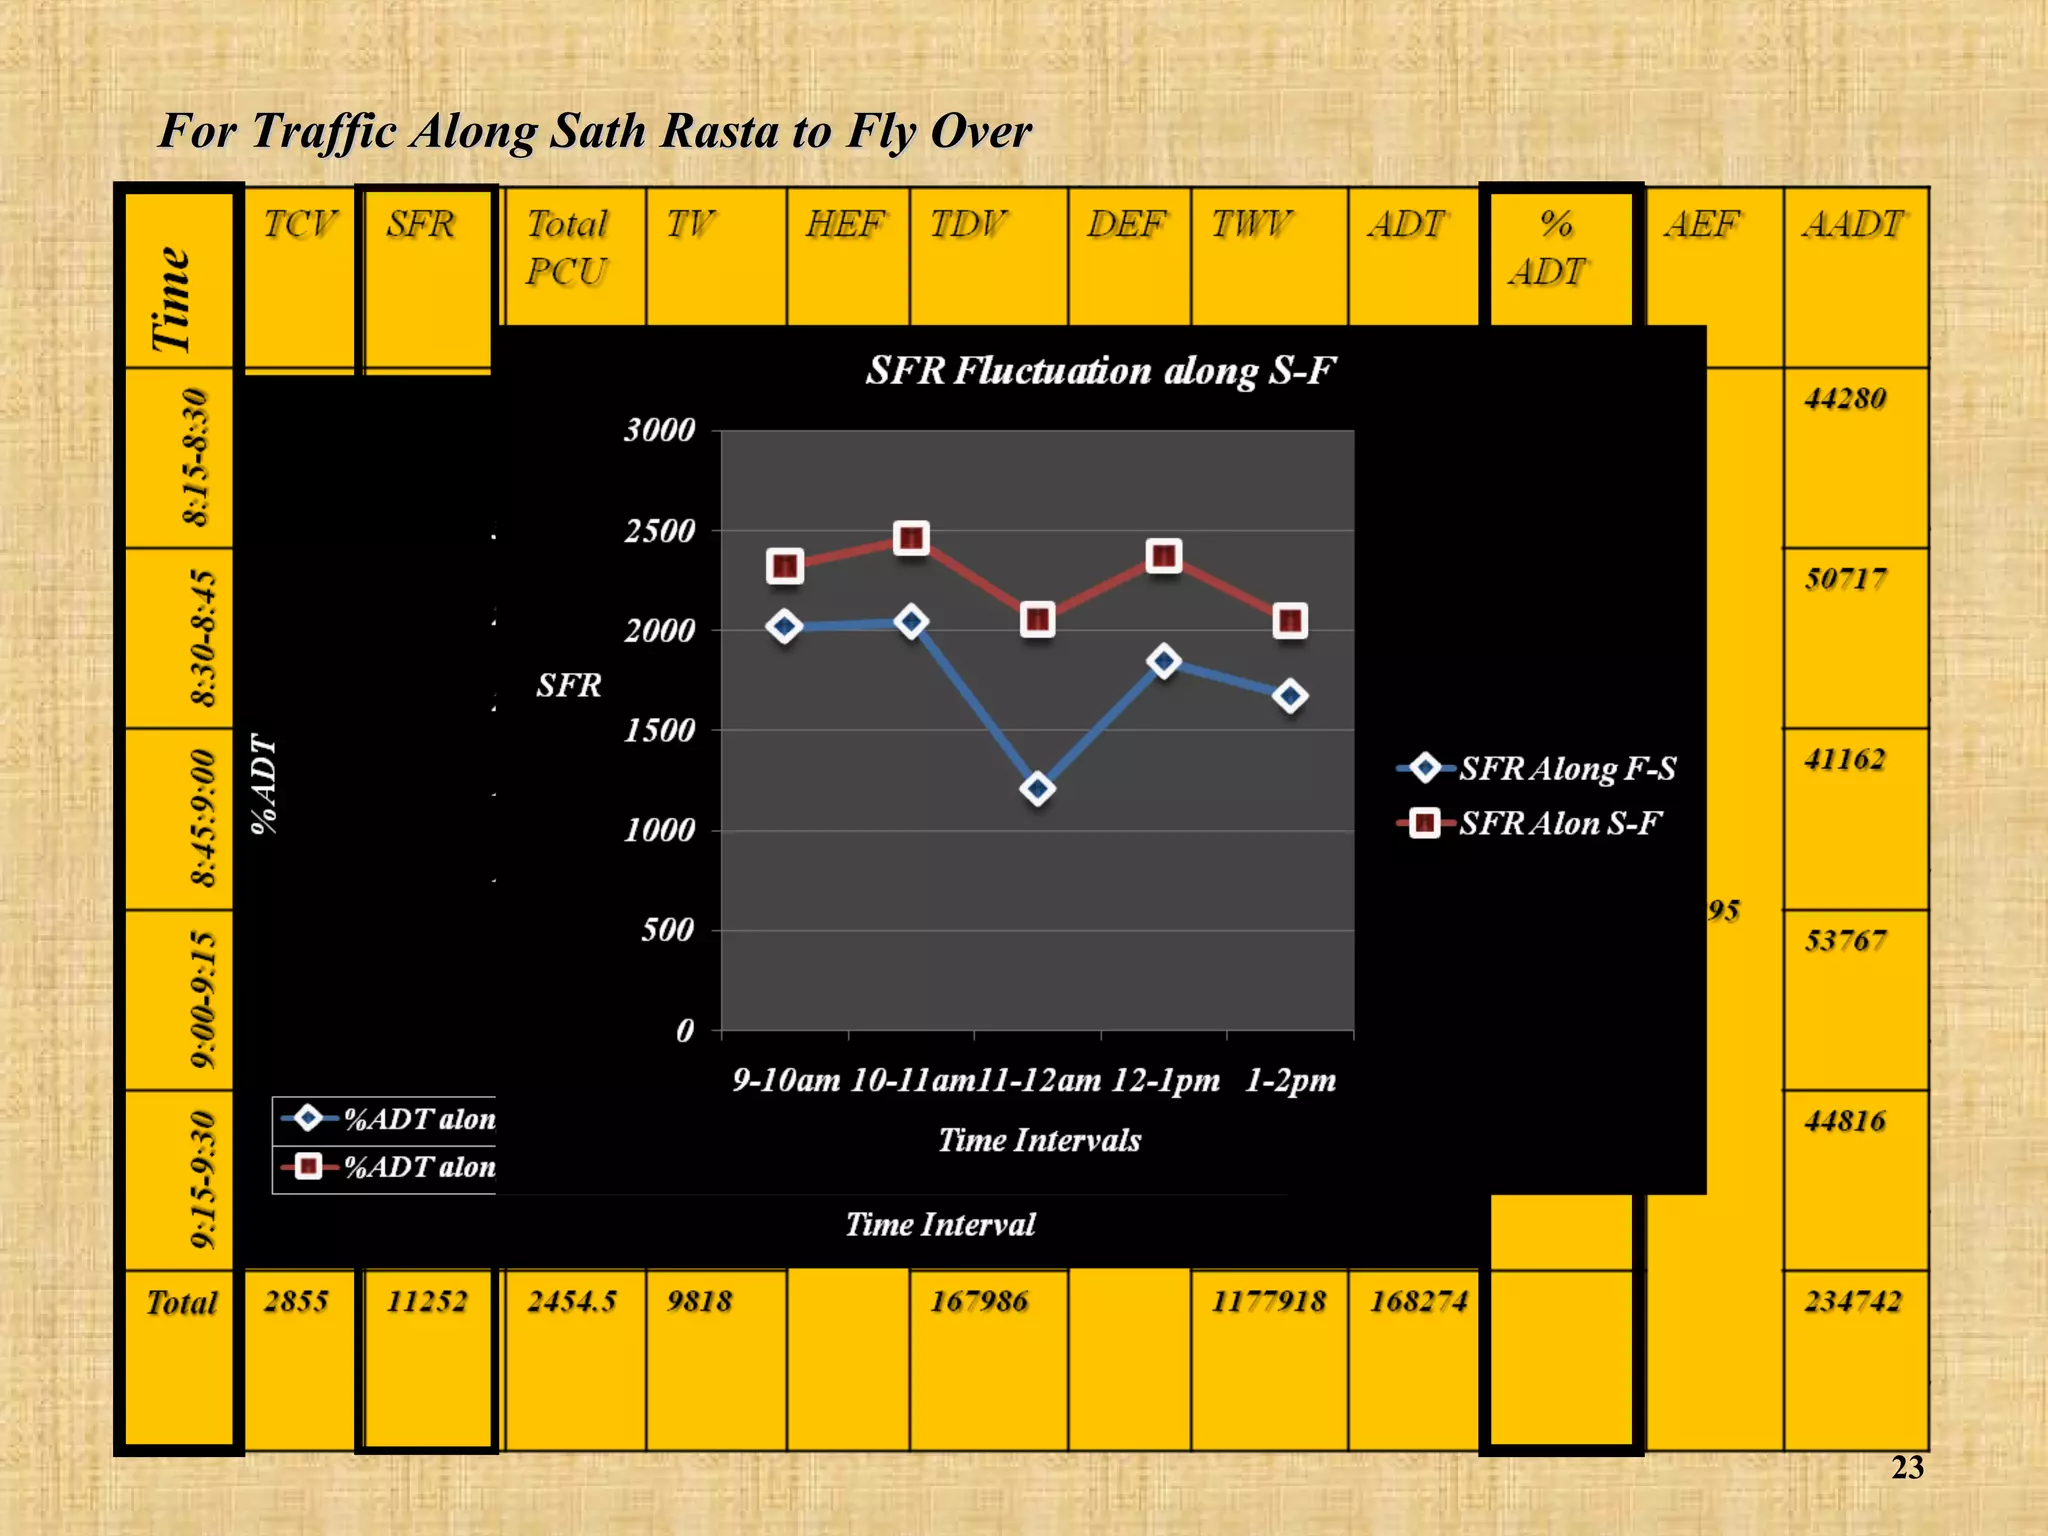
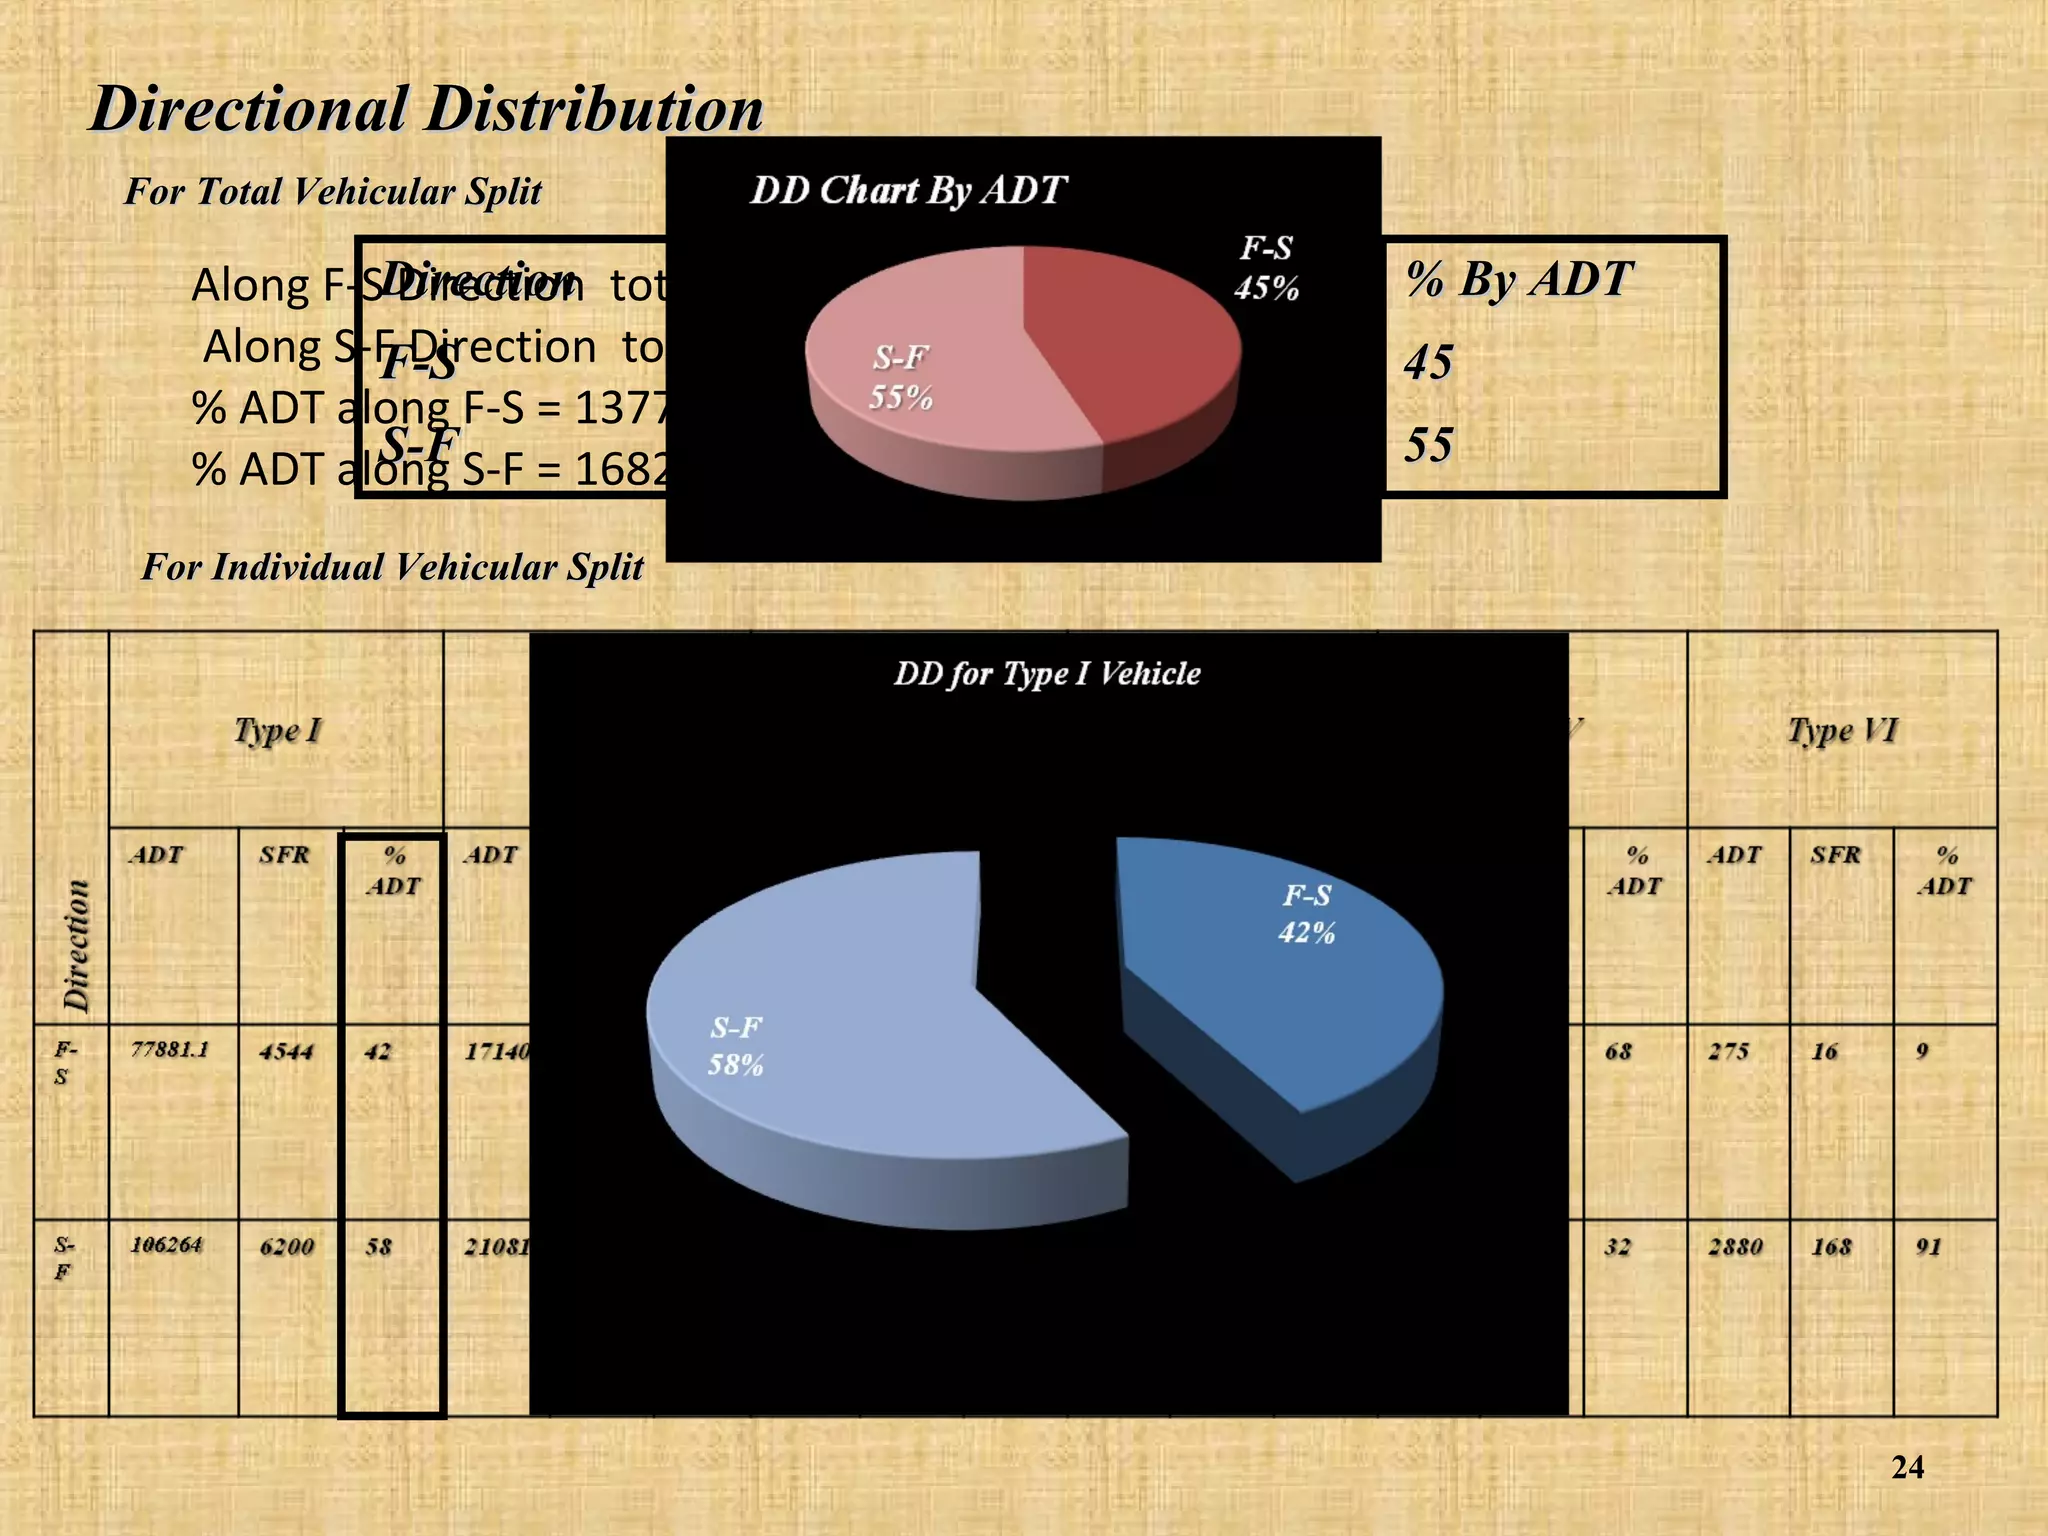
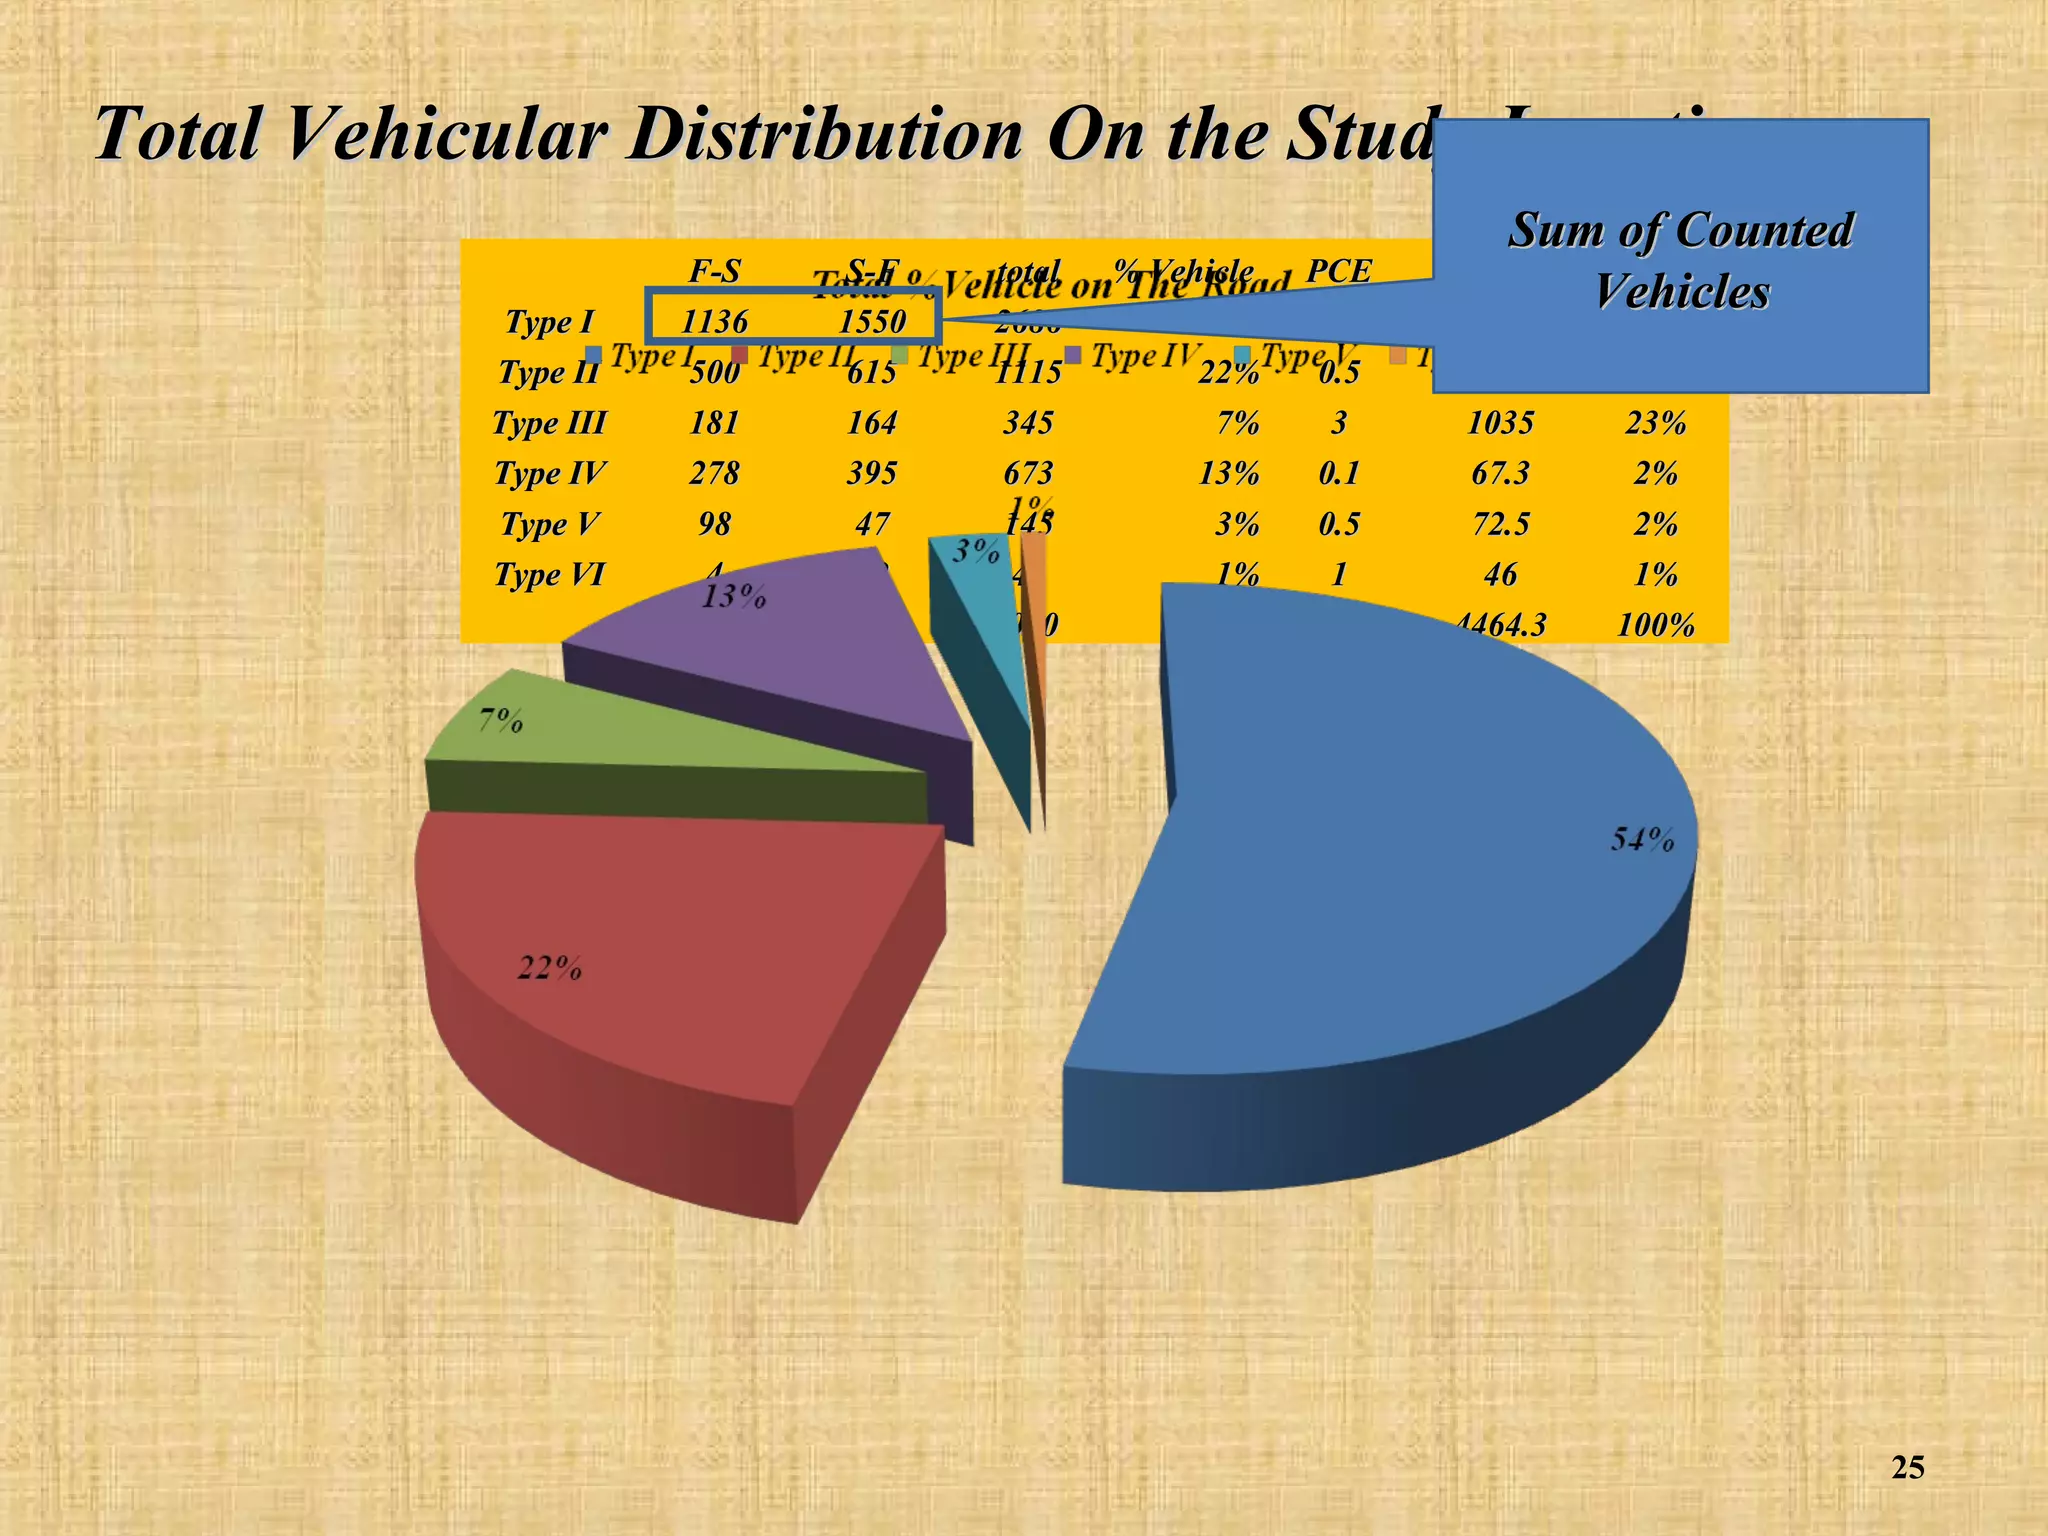
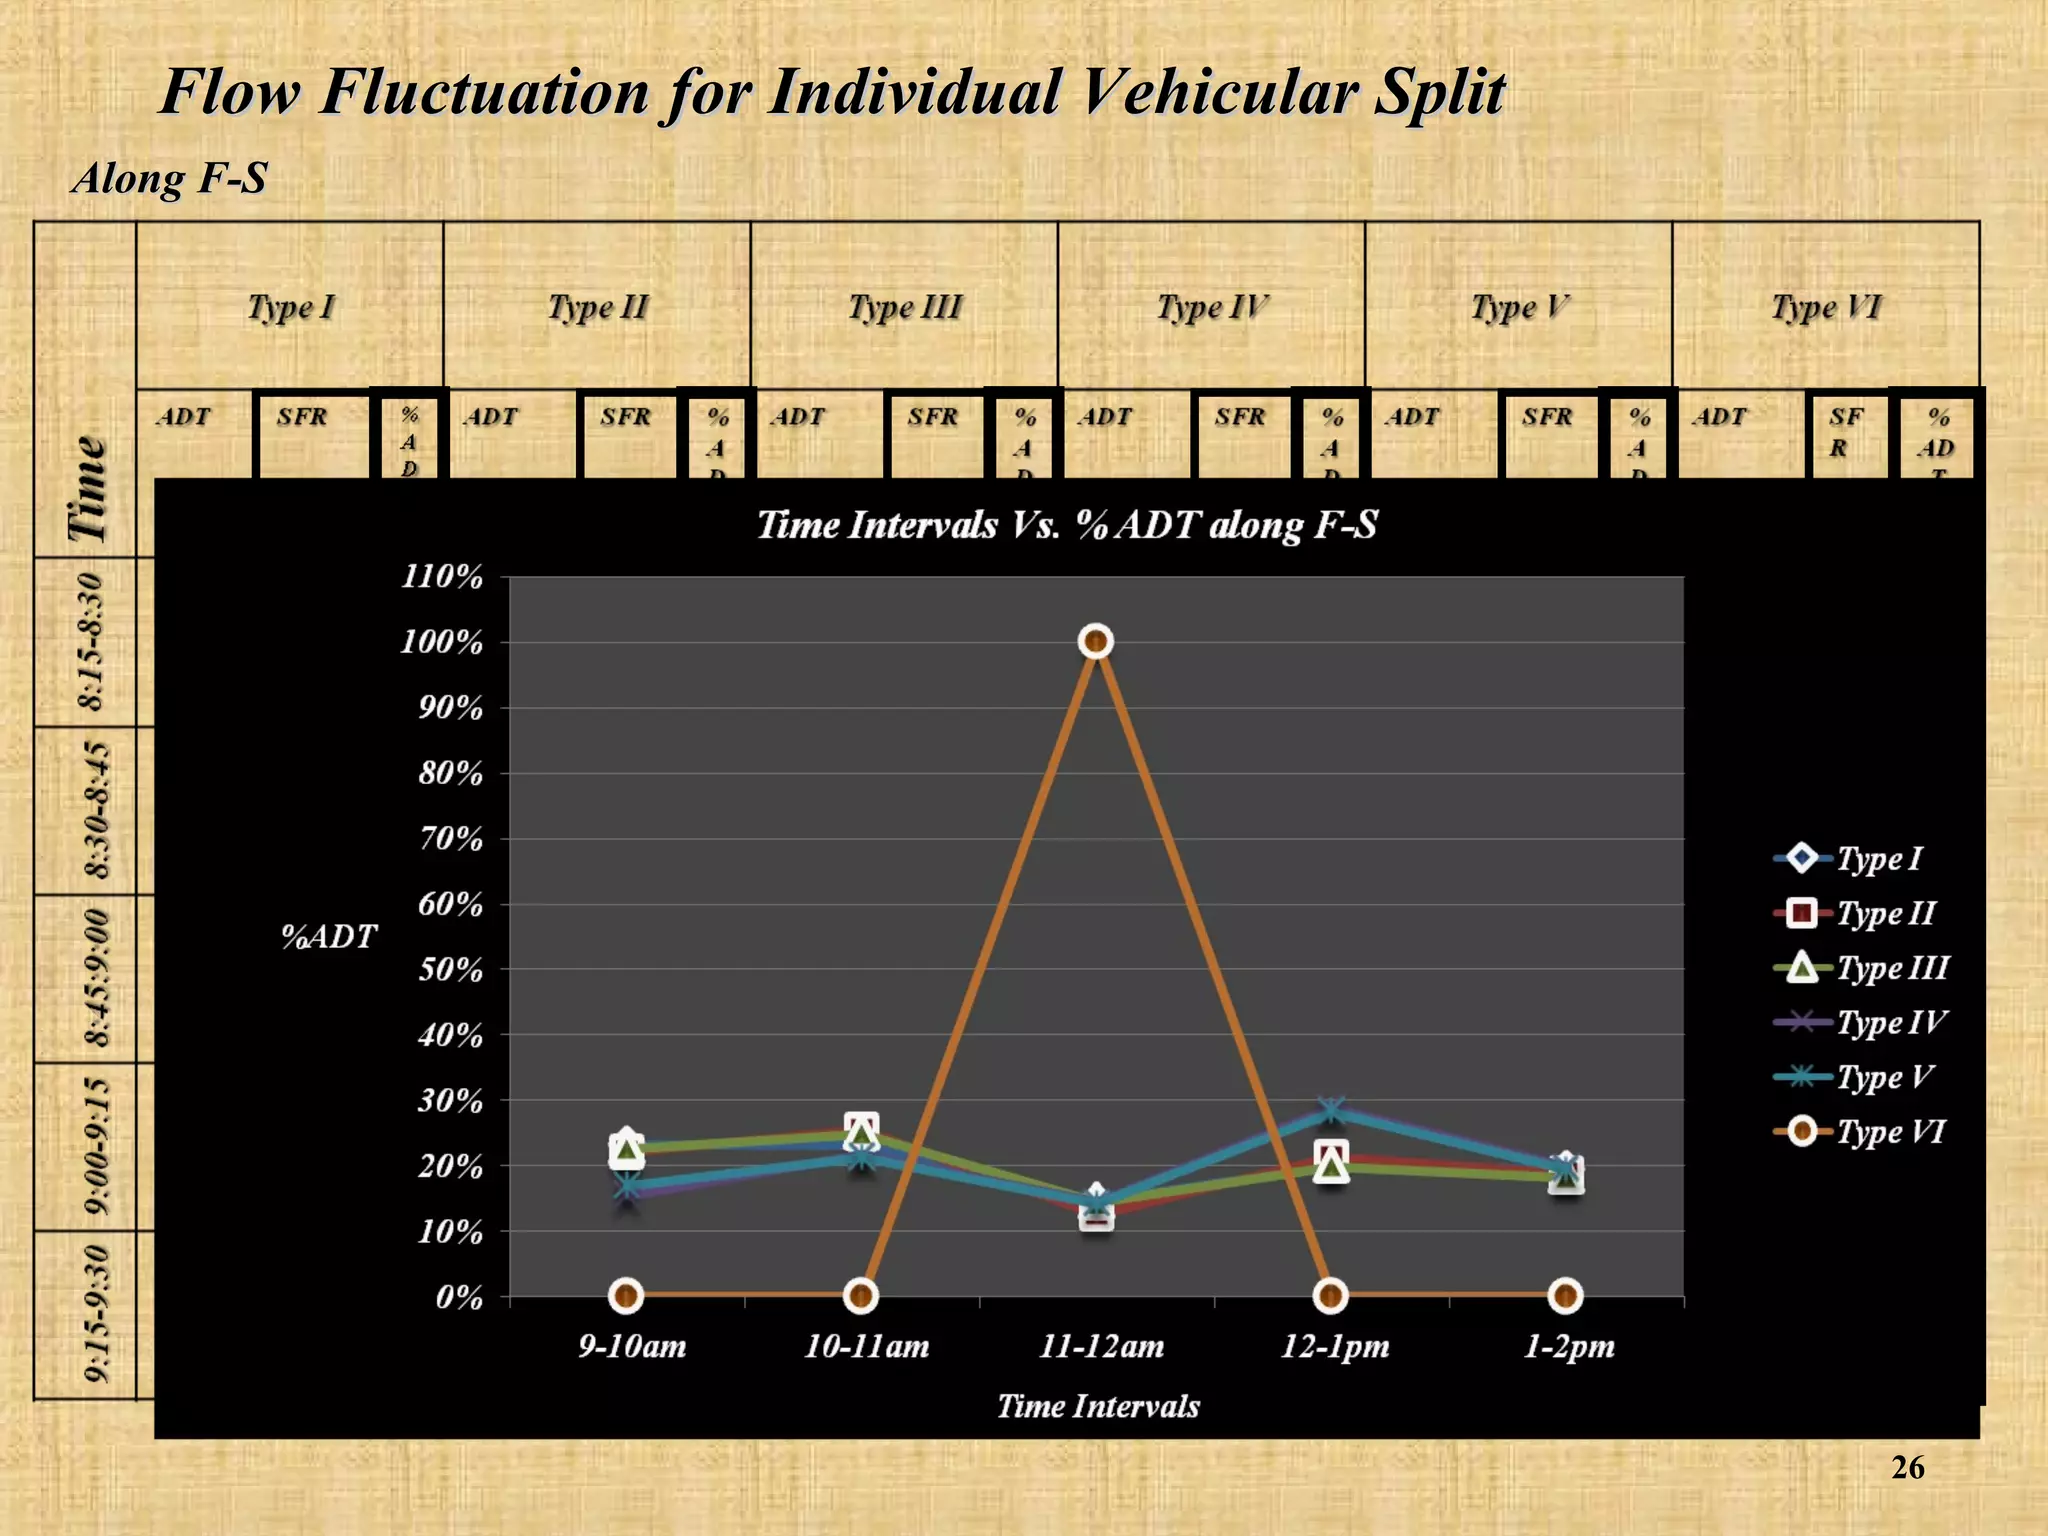
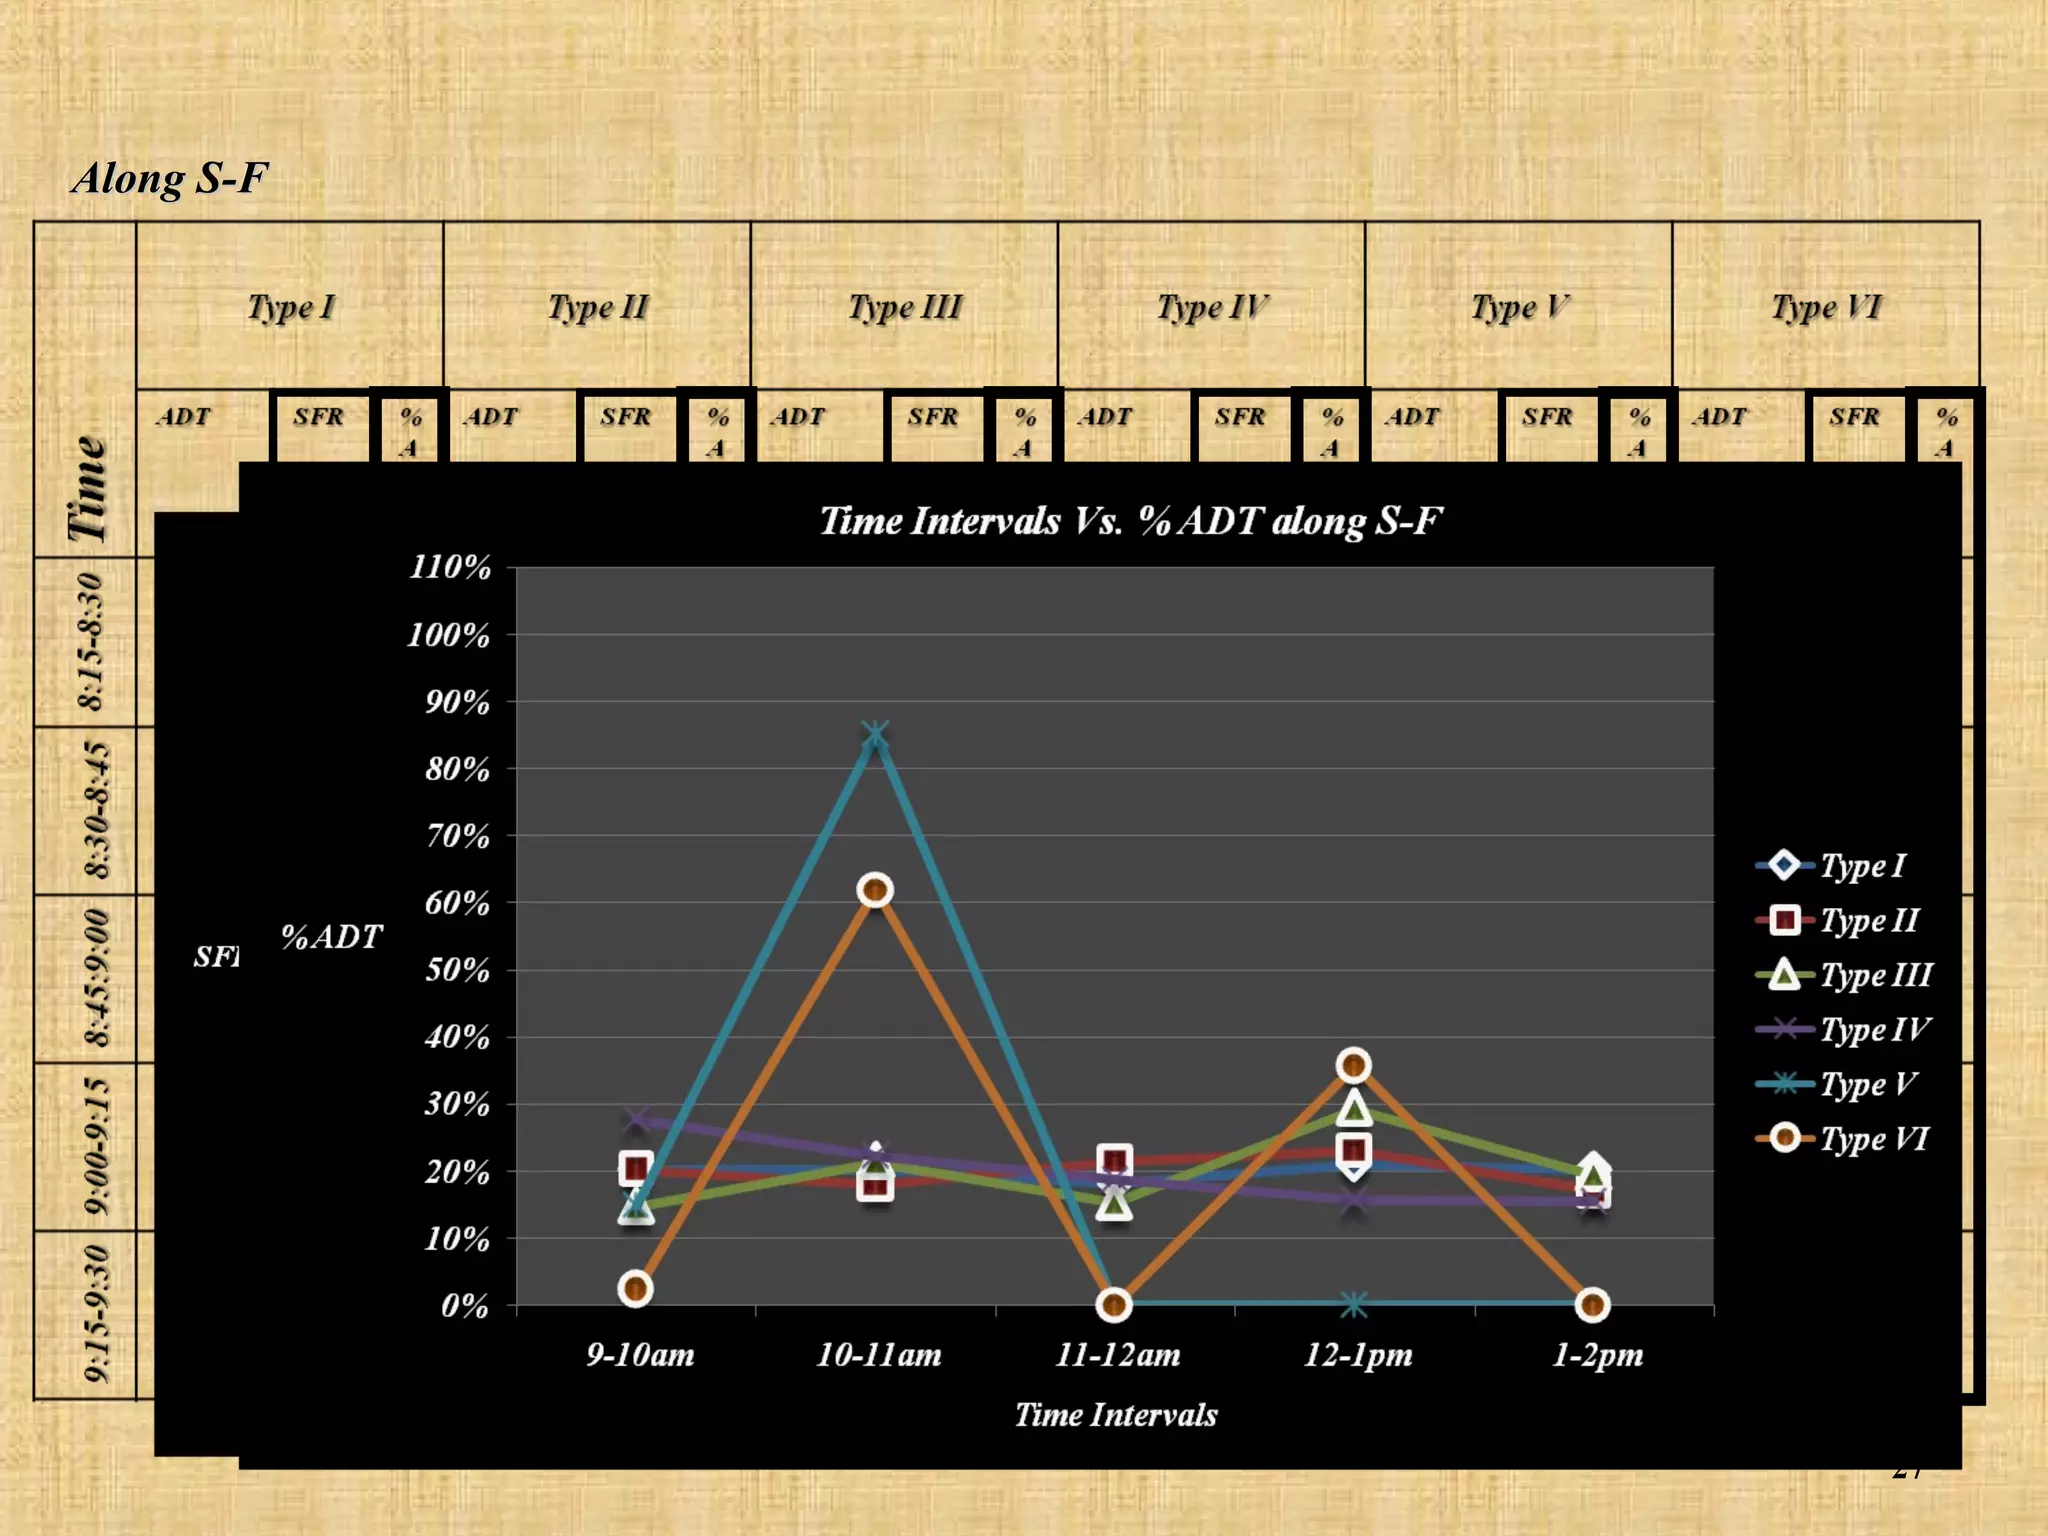
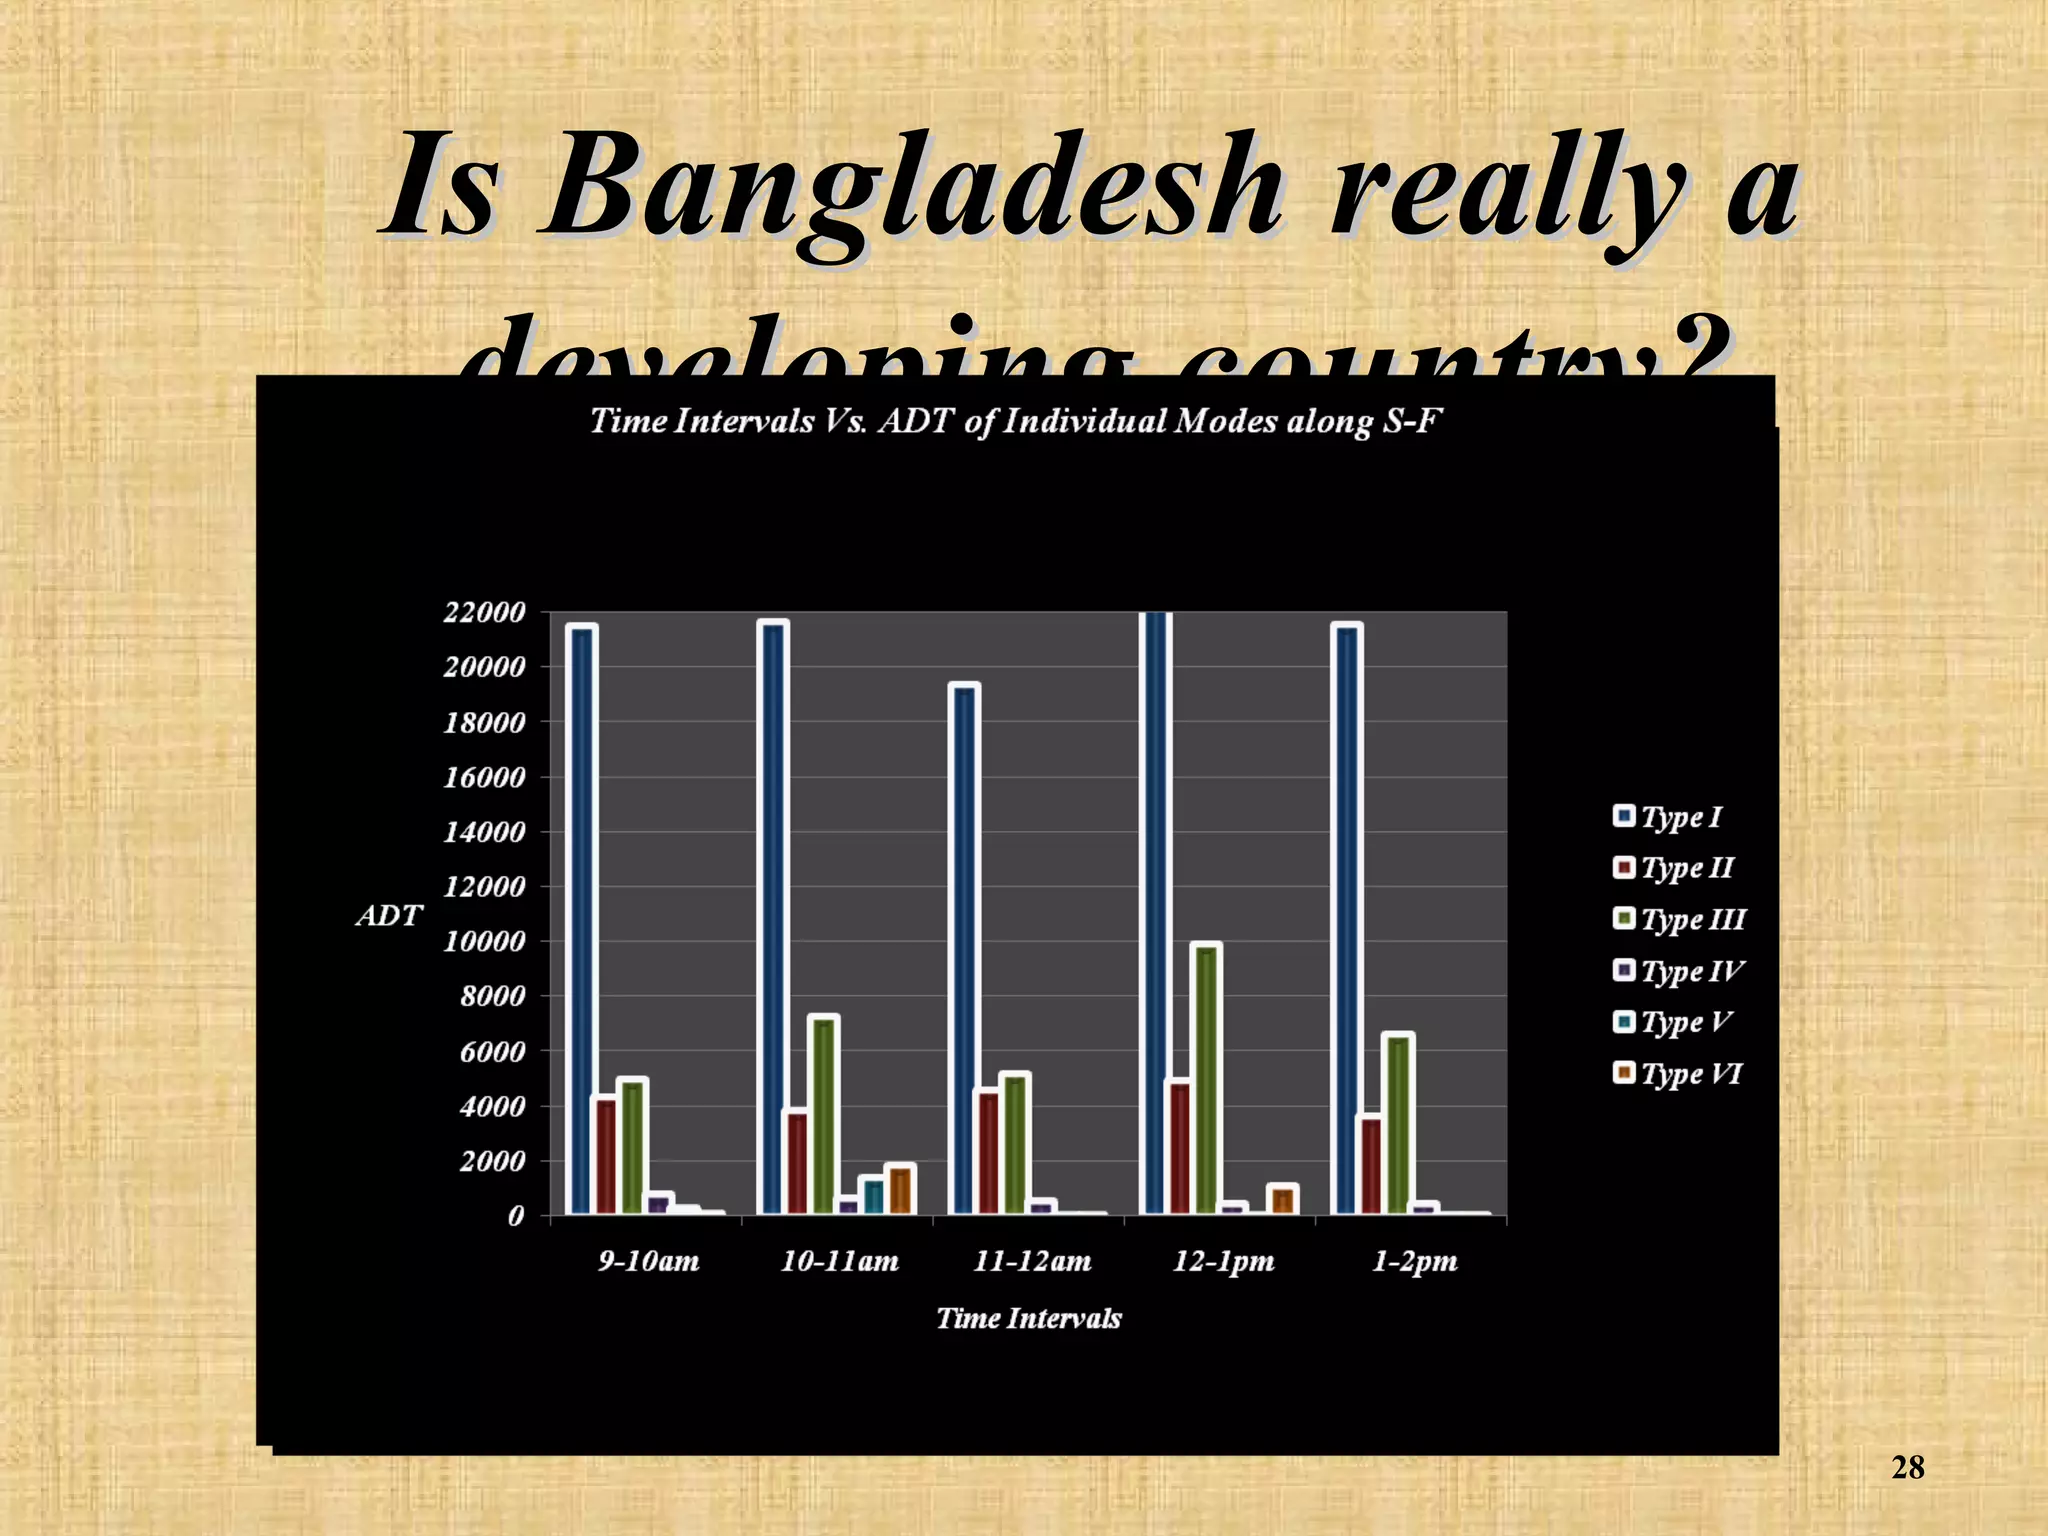

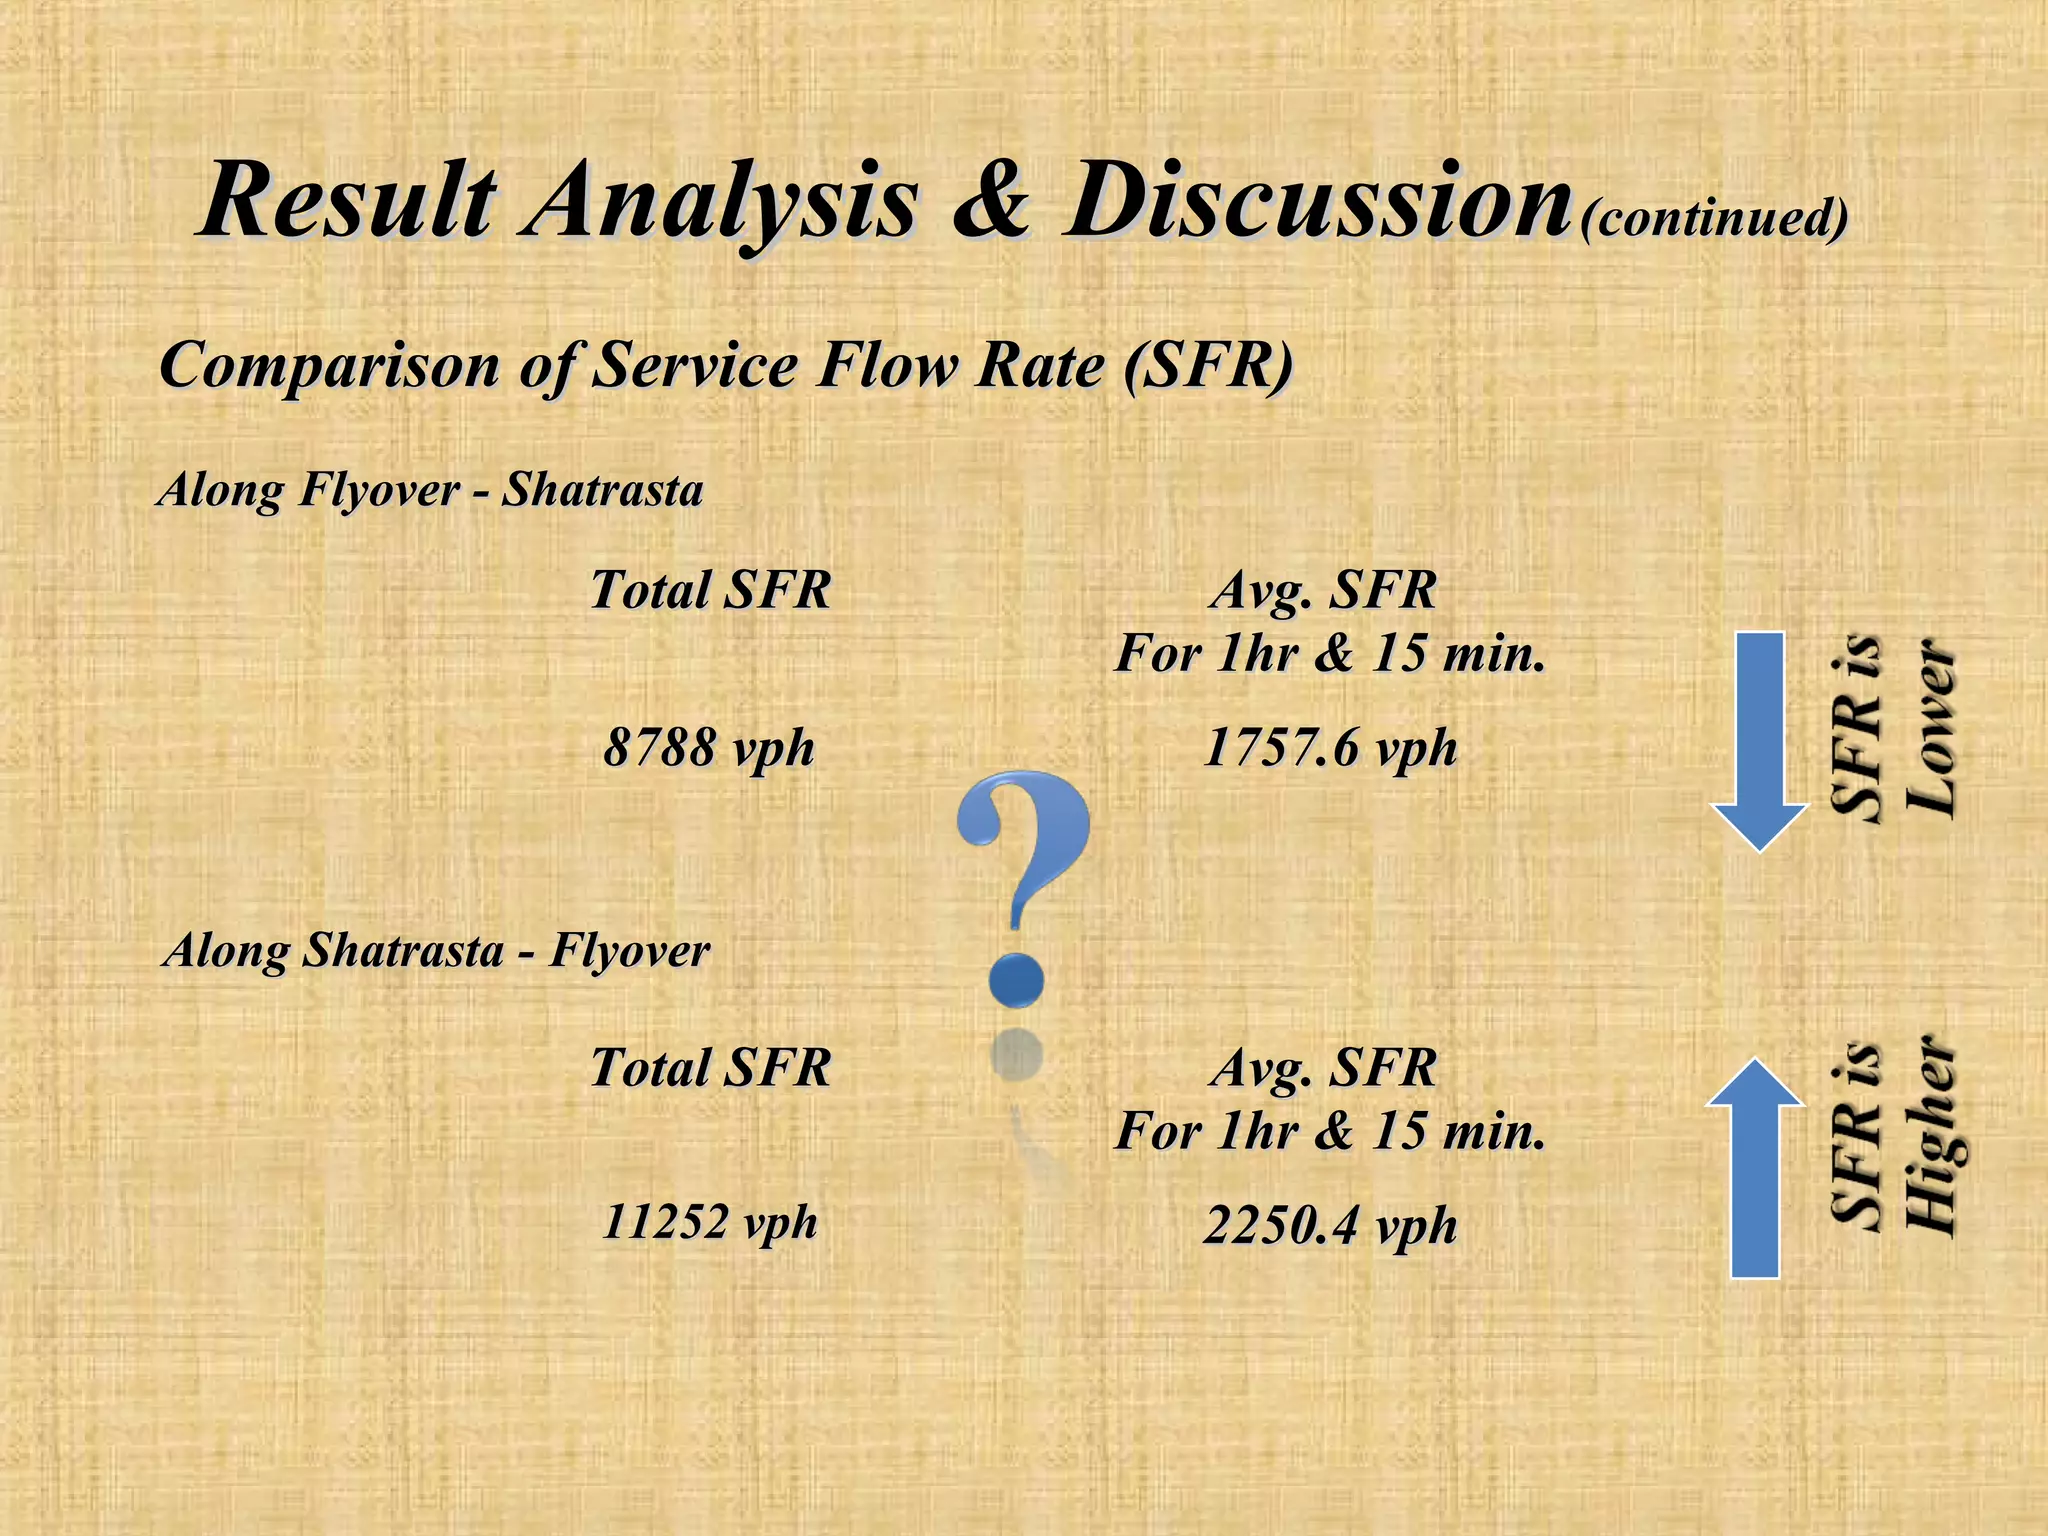
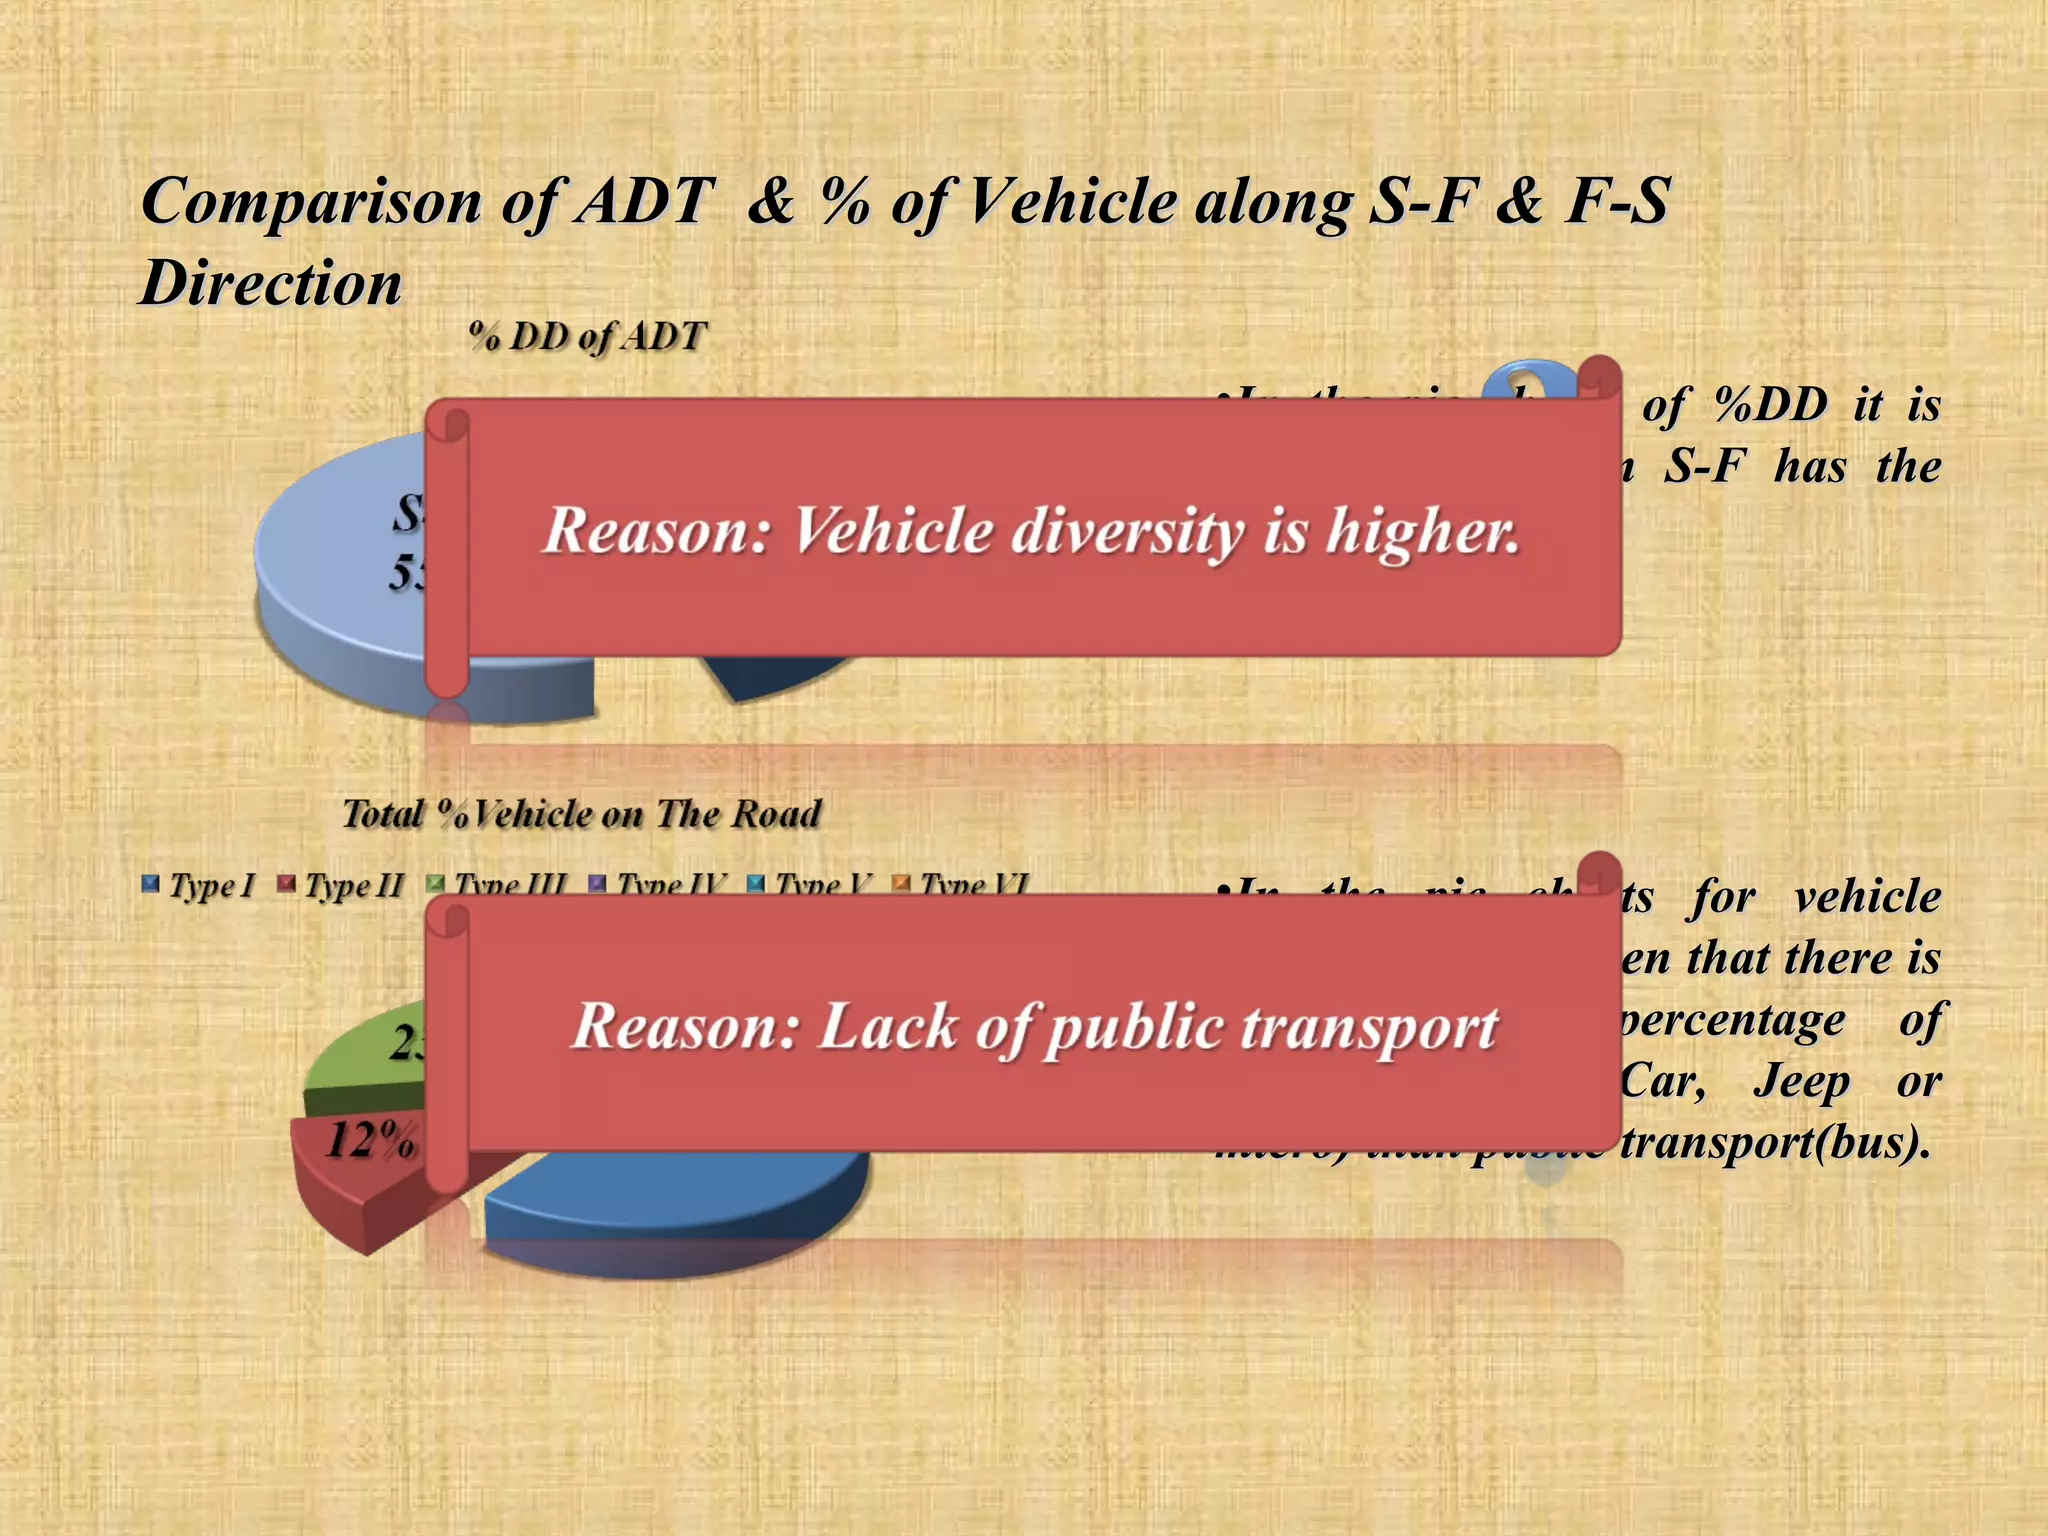
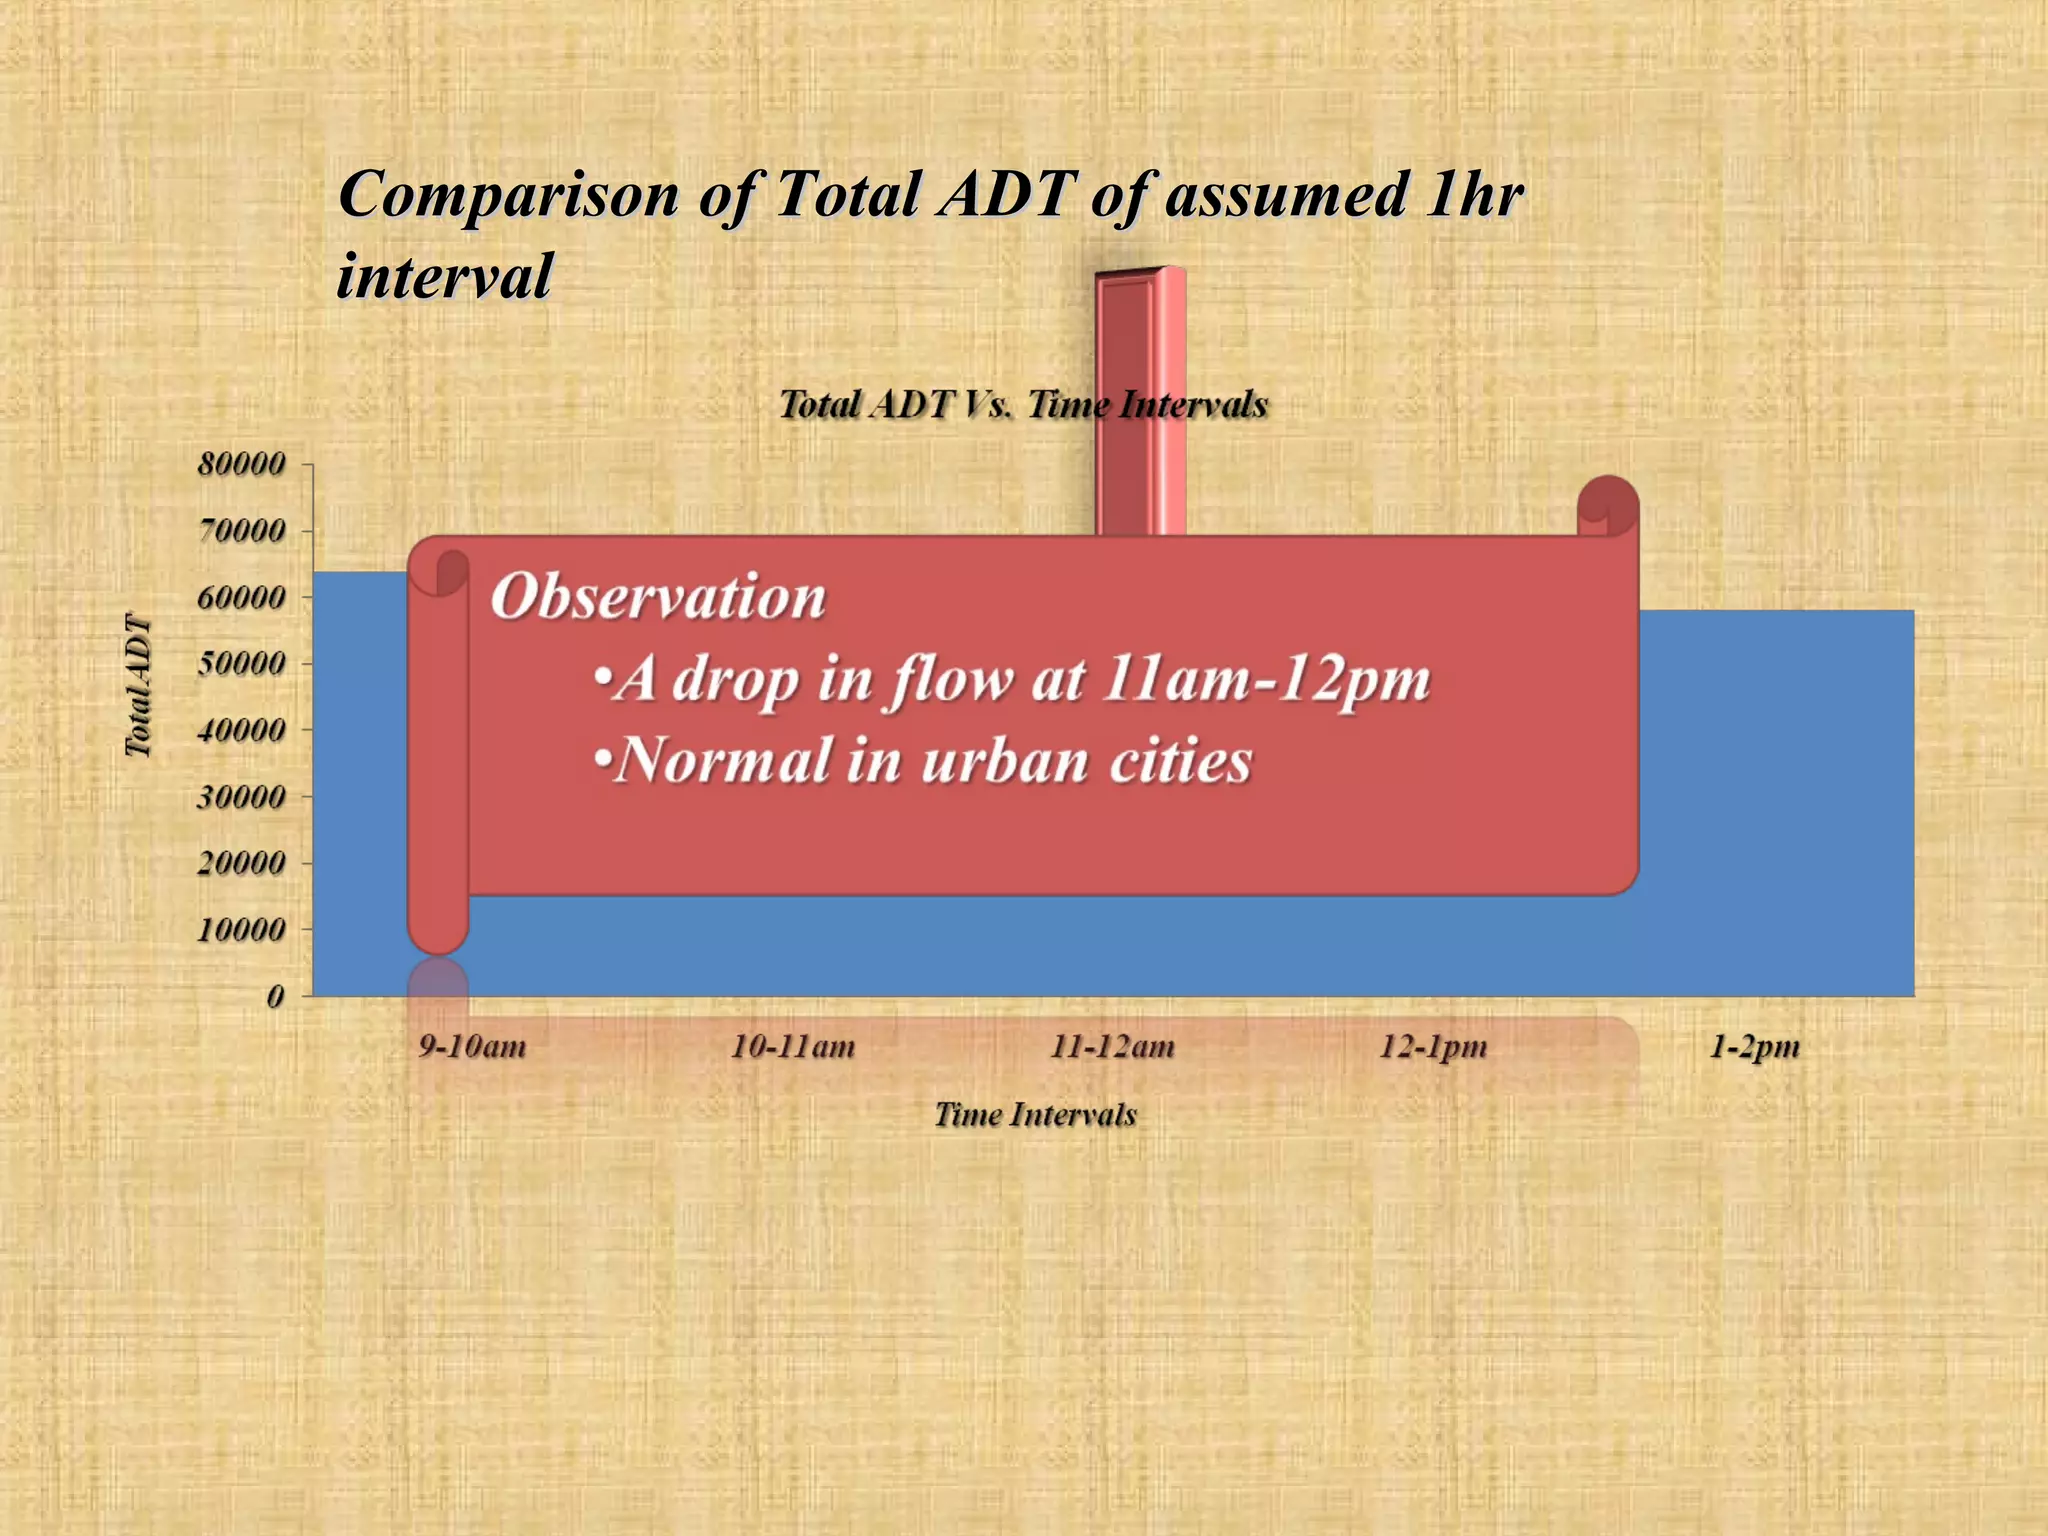


This document summarizes a traffic volume study conducted at Tejgaon Industrial Area in Dhaka, Bangladesh. A team of 5 students conducted classified manual counts of vehicles traveling along Shaheed Tajuddin Ahmed Avenue between Shatrasta and the flyover for 15 minutes intervals. Over 5,000 vehicles were counted, with the highest percentages being cars (54%) and CNG auto-rickshaws (22%). The average service flow rate was higher for traffic traveling from Shatrasta to the flyover compared to the opposite direction, reflecting peak travel patterns. Directional splits showed 55% of total traffic traveled from Shatrasta to the flyover.


![02-B Components of Traffic System [Roadway and Control Device] (Traffic Engin...](https://cdn.slidesharecdn.com/ss_thumbnails/02bcomponentsoftsroadwaycontrol1-200412120102-thumbnail.jpg?width=640&height=640&fit=bounds)


