Downloaded 131 times


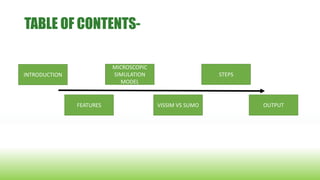
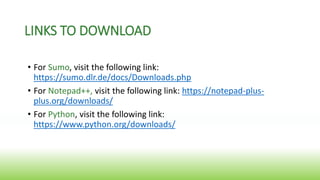
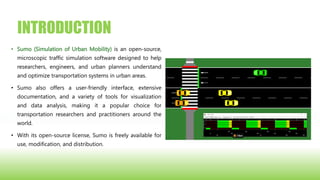
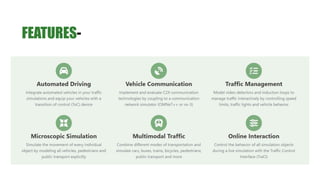
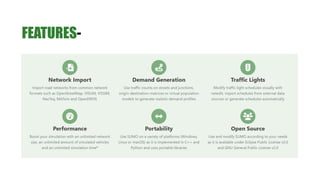
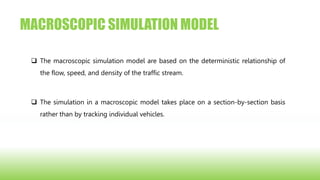
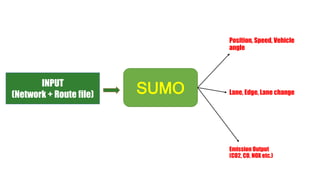

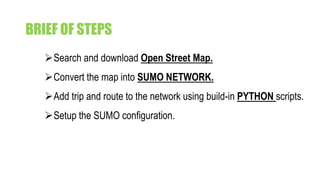


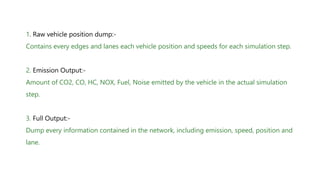


The document discusses the open-source traffic simulation software SUMO, highlighting its features, capabilities, and comparison with the commercial software PTV VISSIM. It outlines different simulation models (macroscopic, mesoscopic, and microscopic) and provides steps for using SUMO, including data output types like floating car data and emissions. The document also mentions links for downloading related tools and resources.