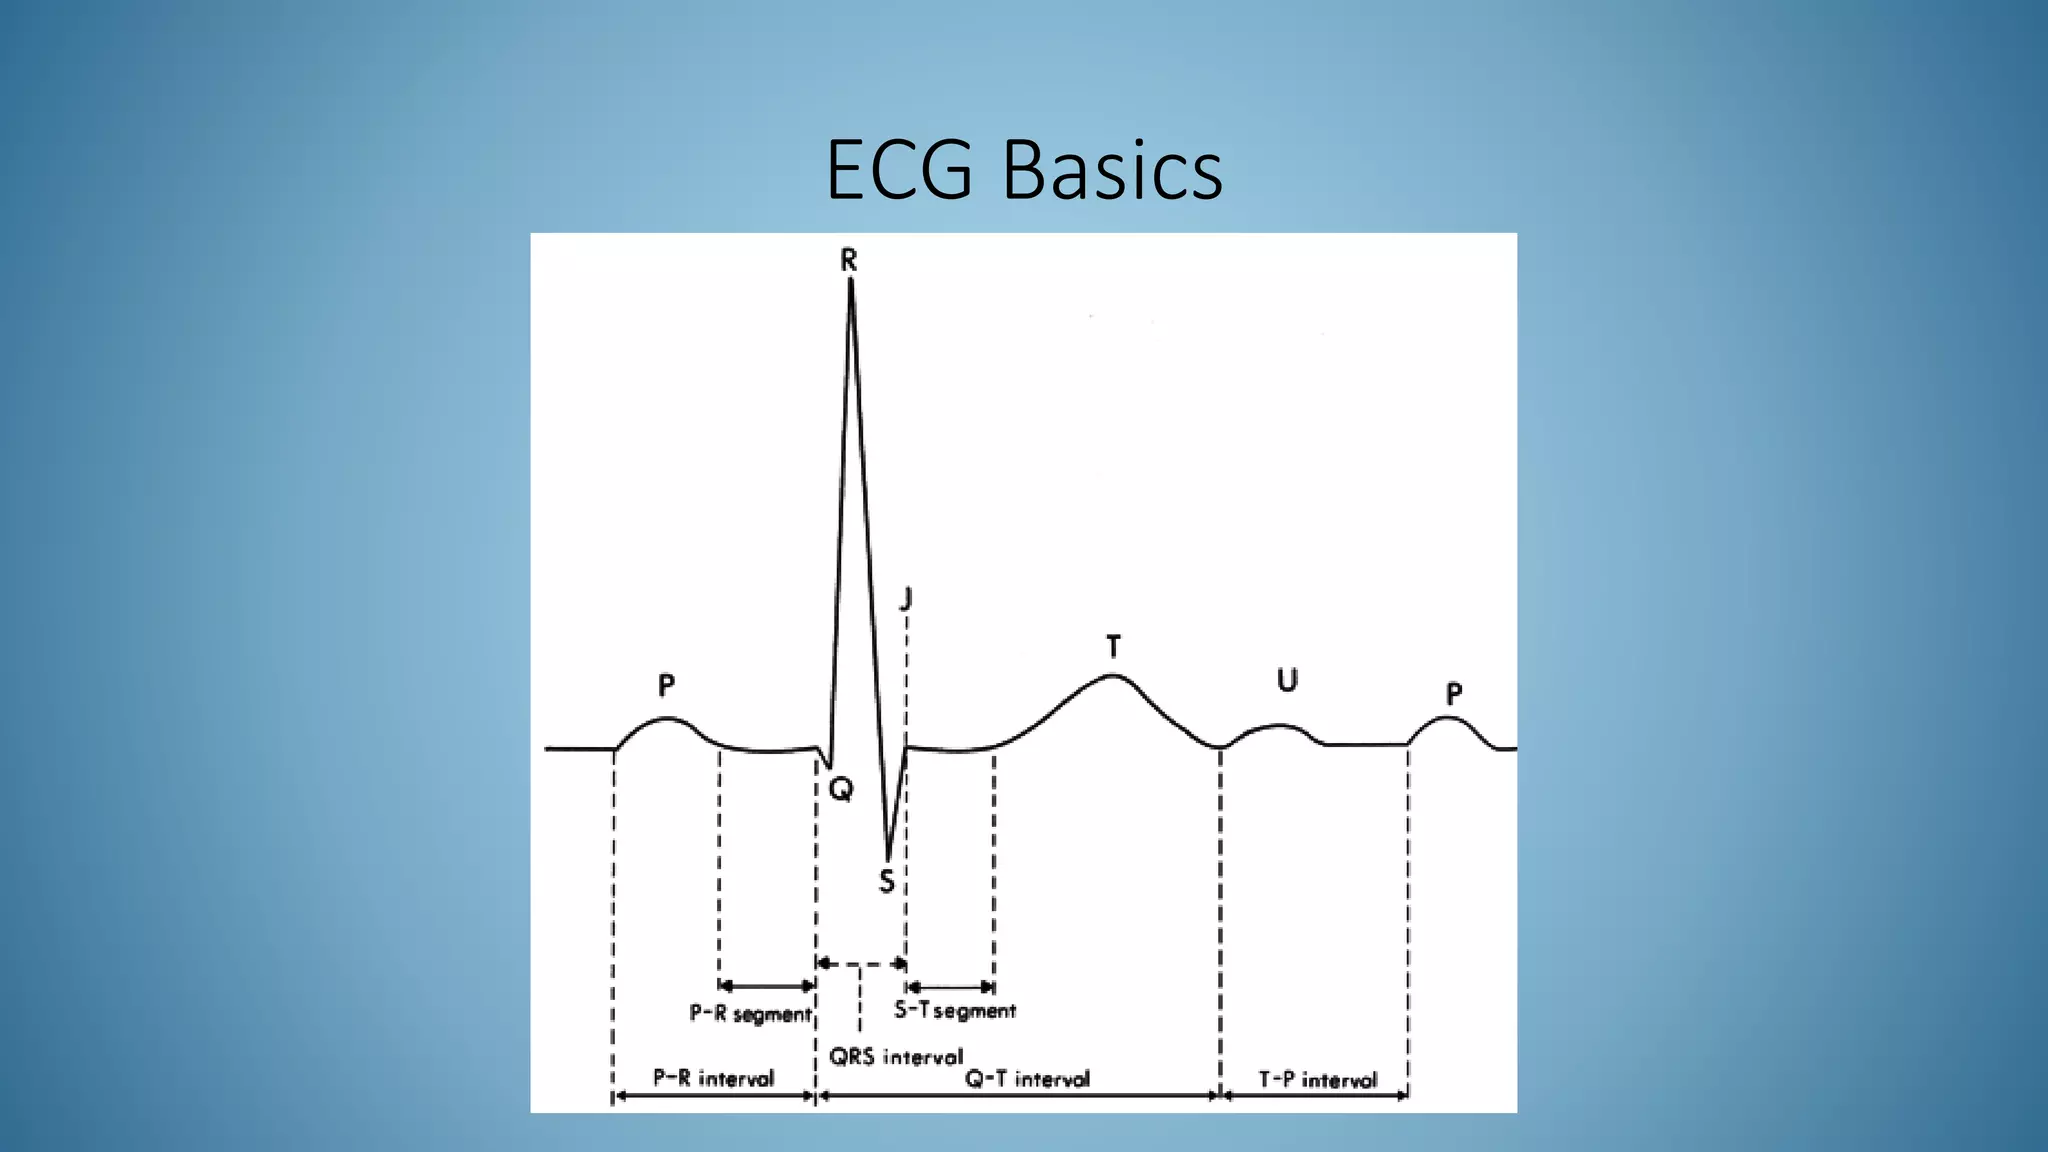
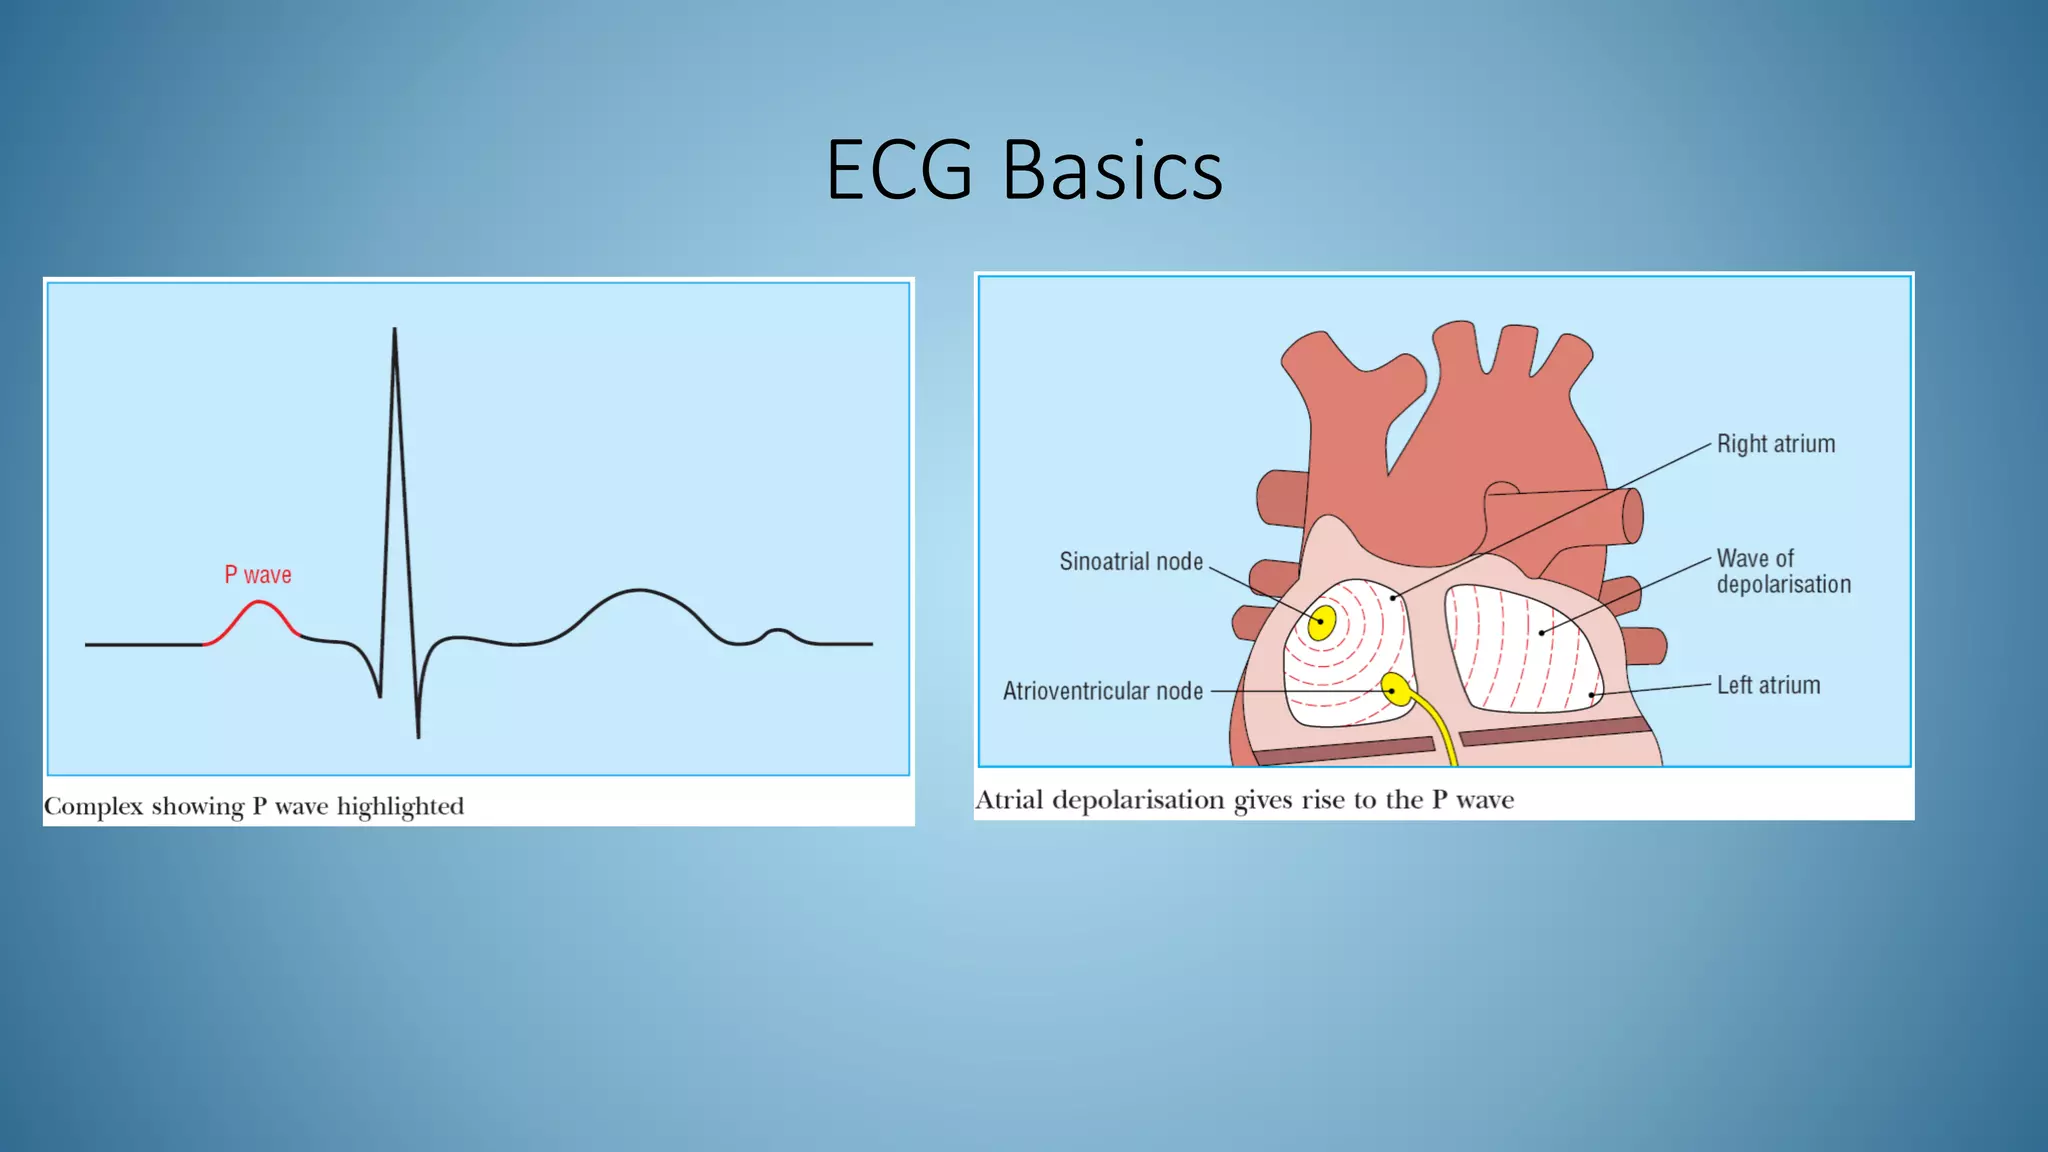
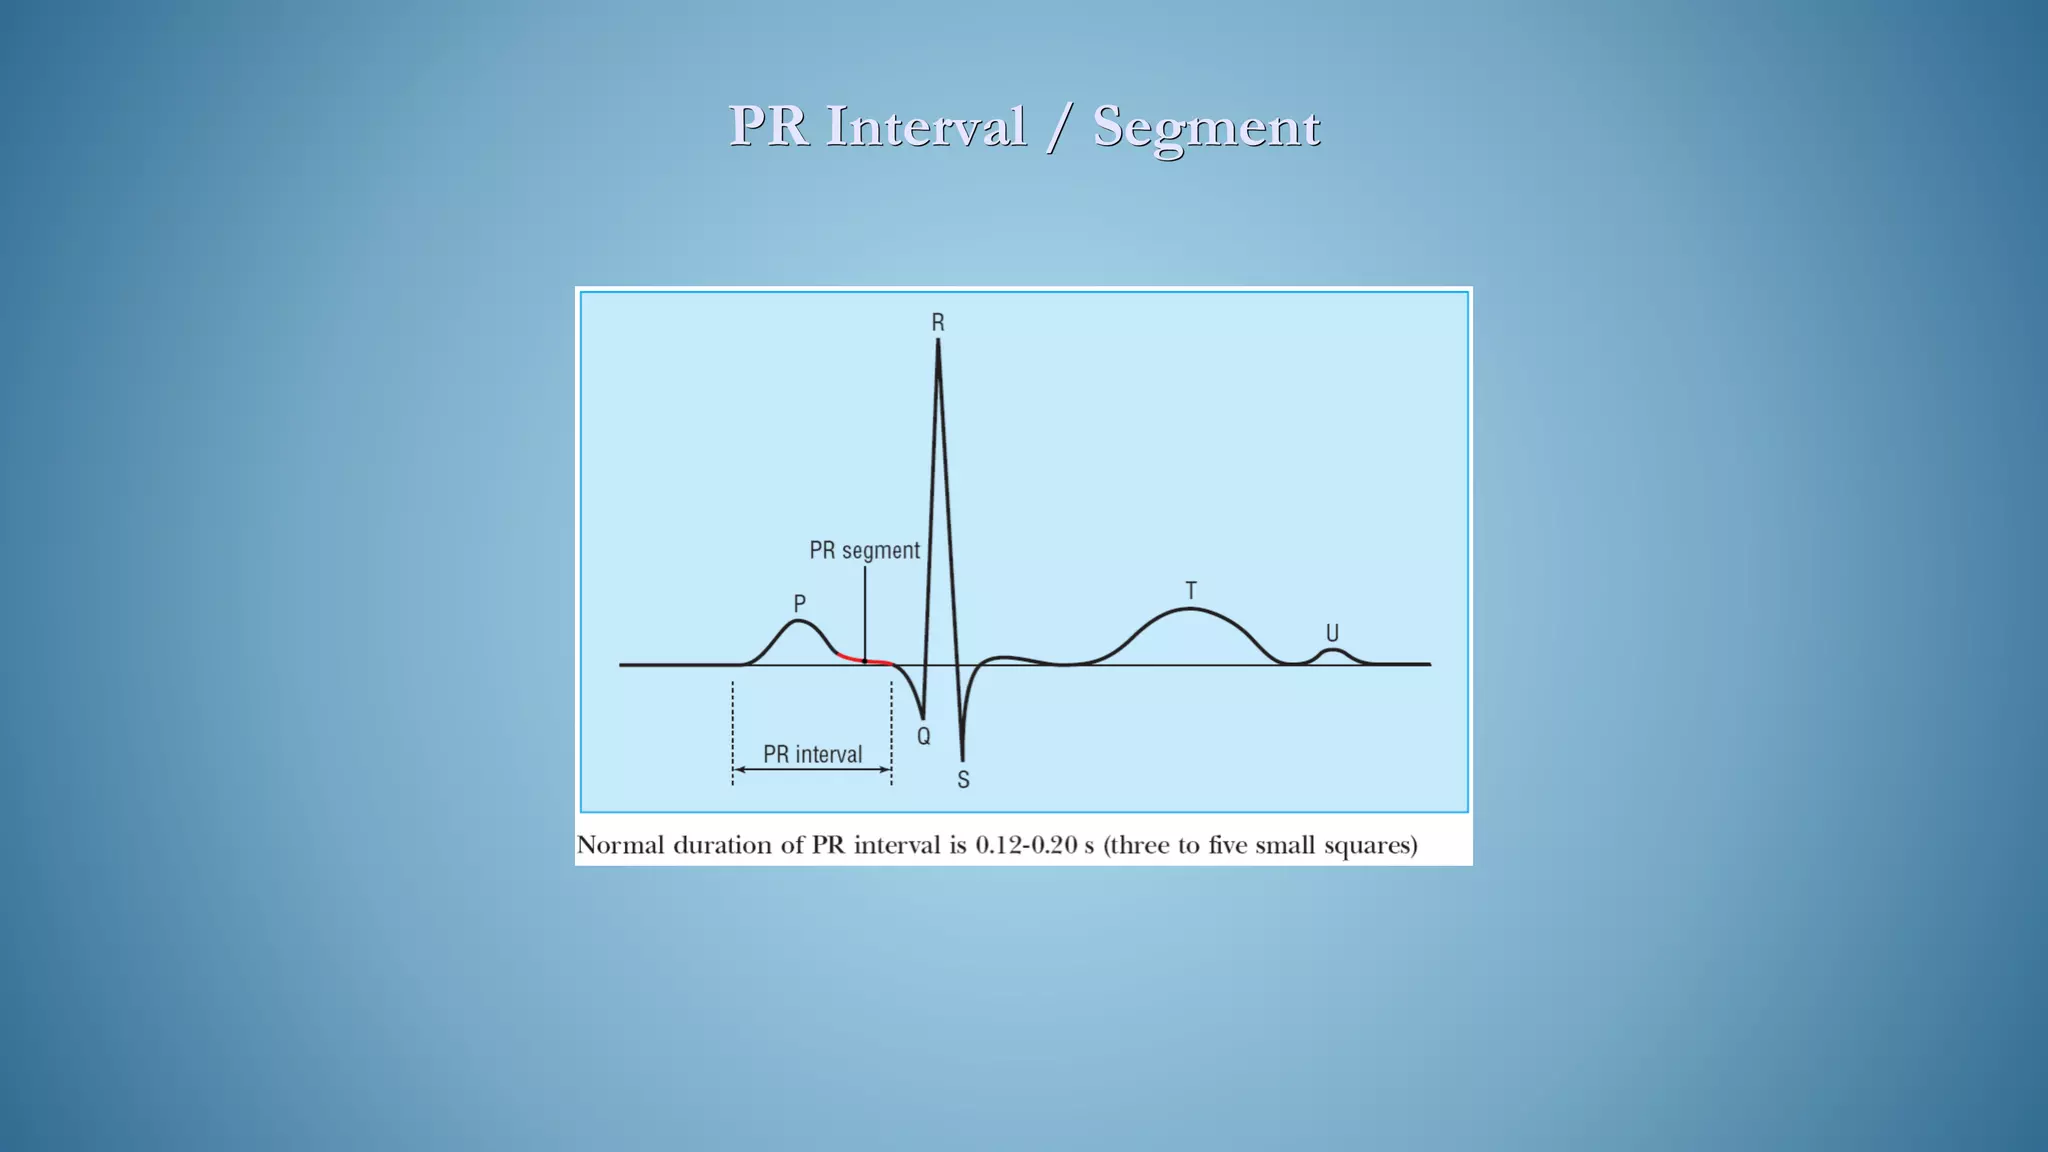
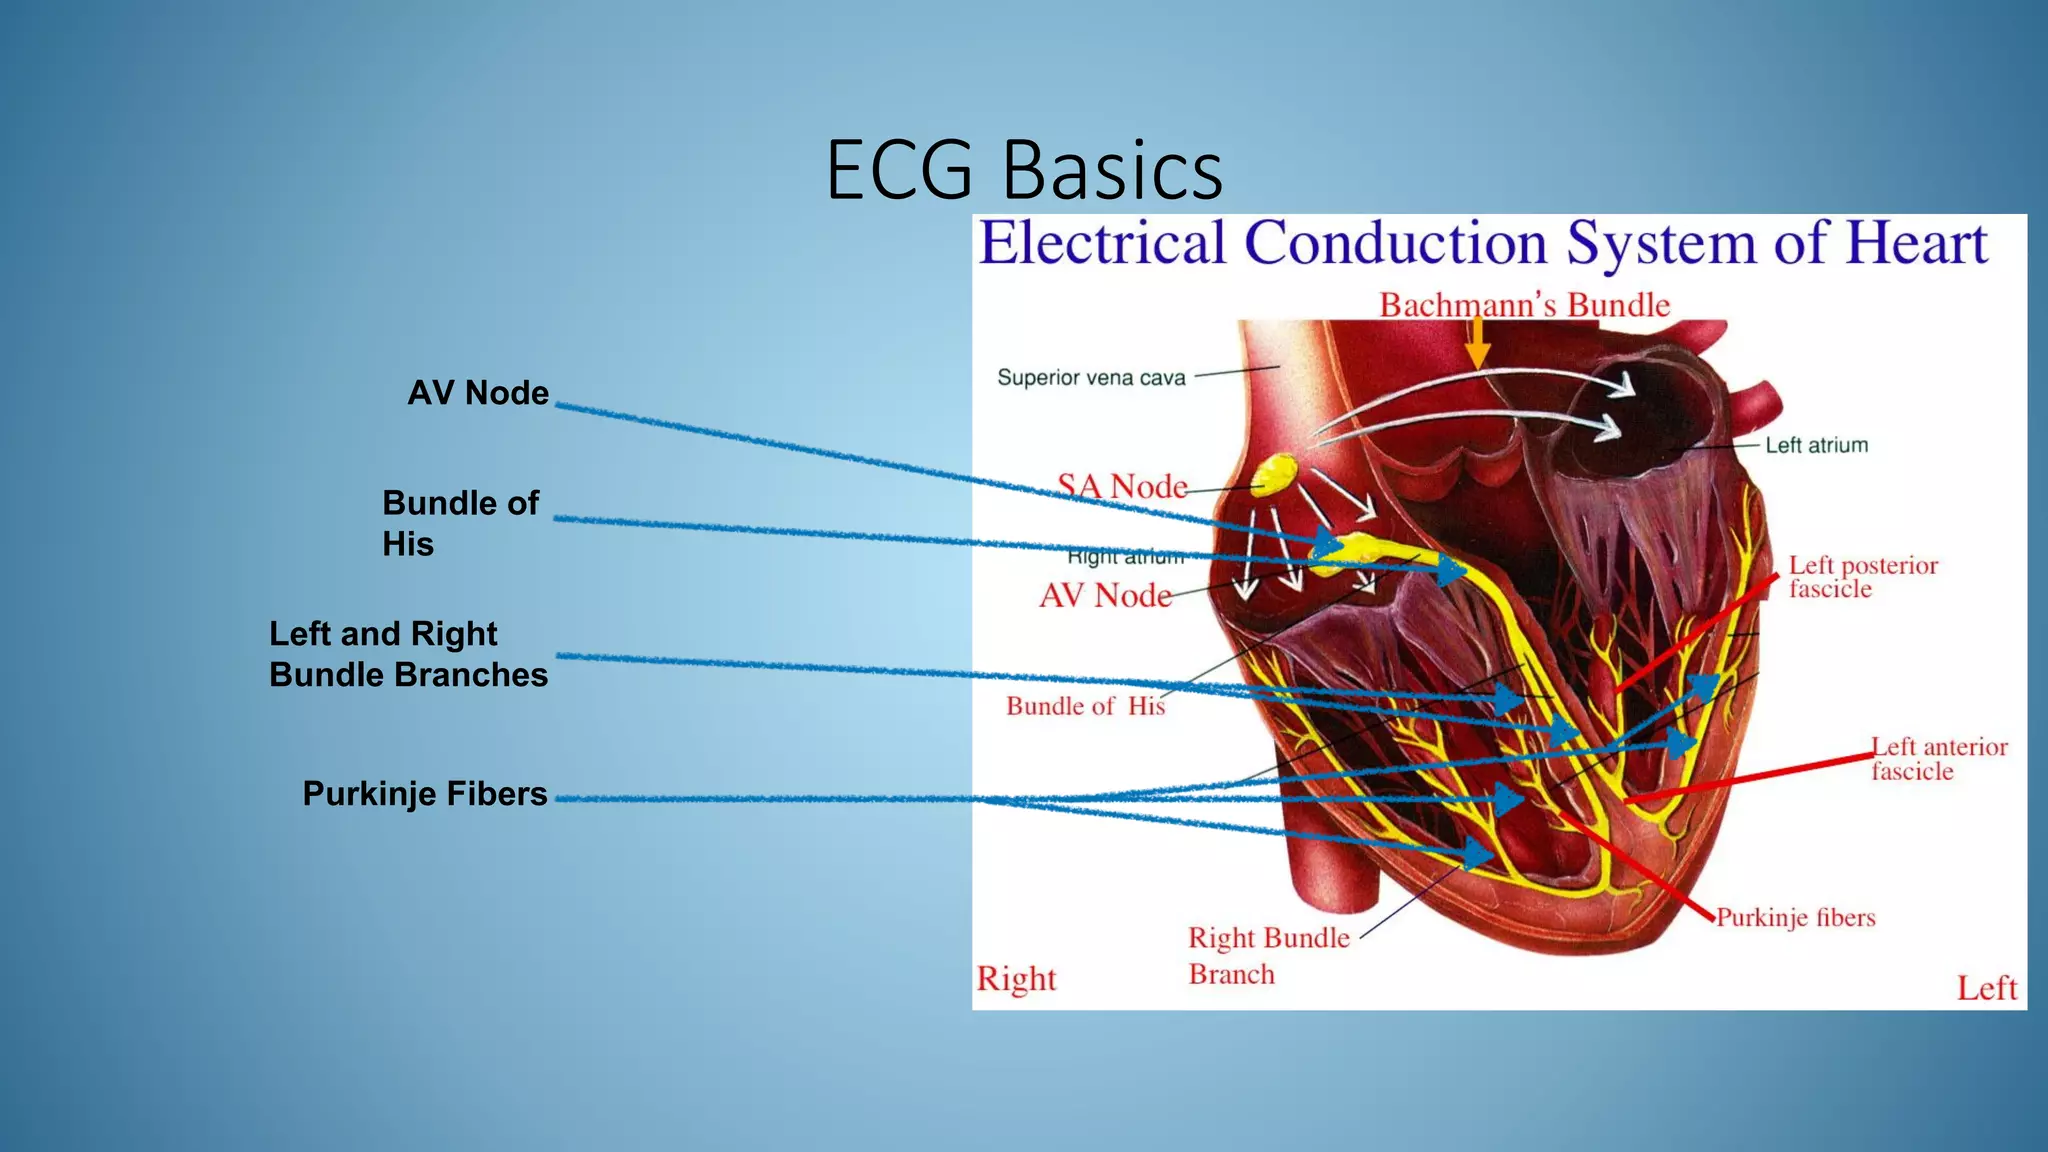
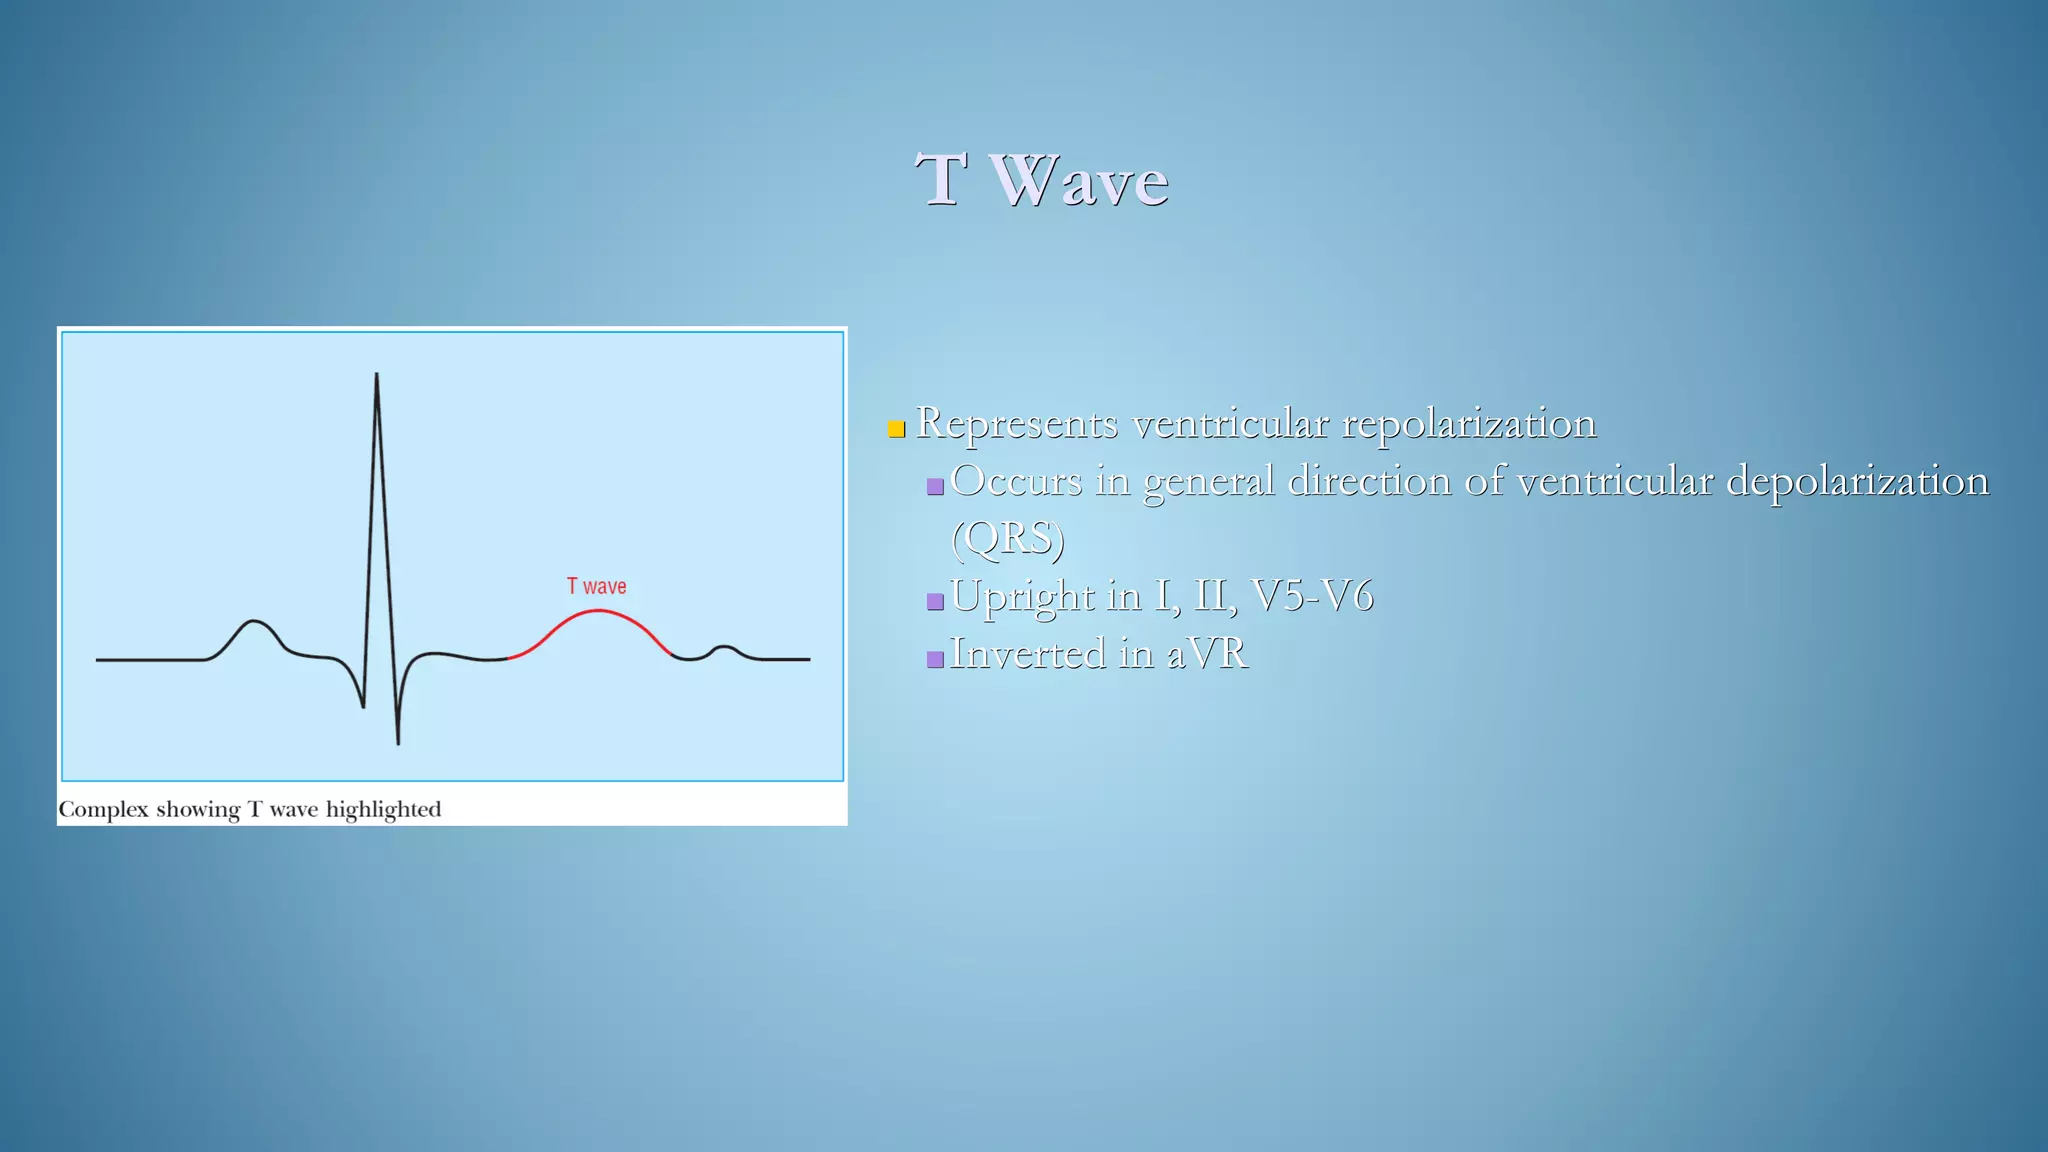
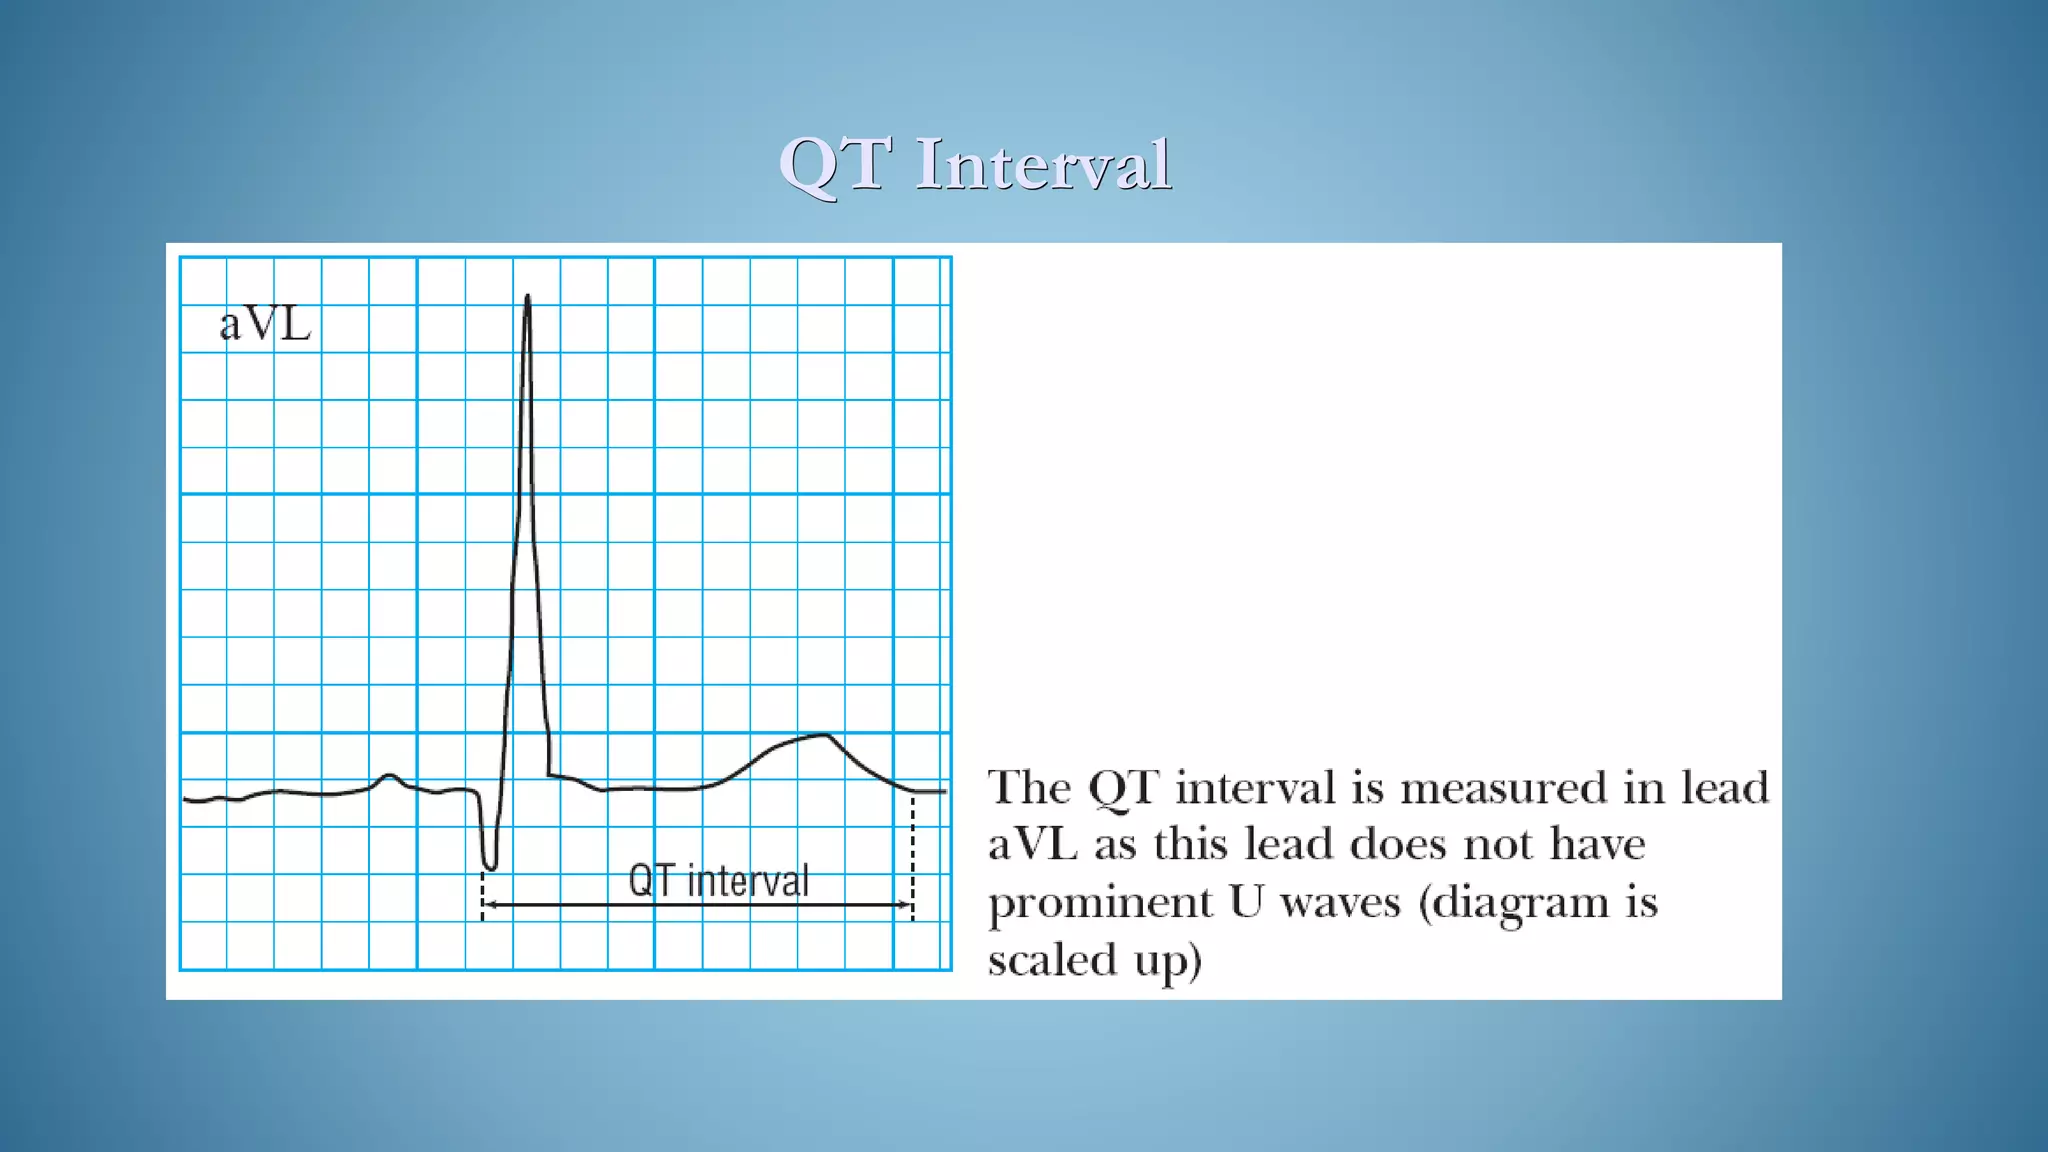
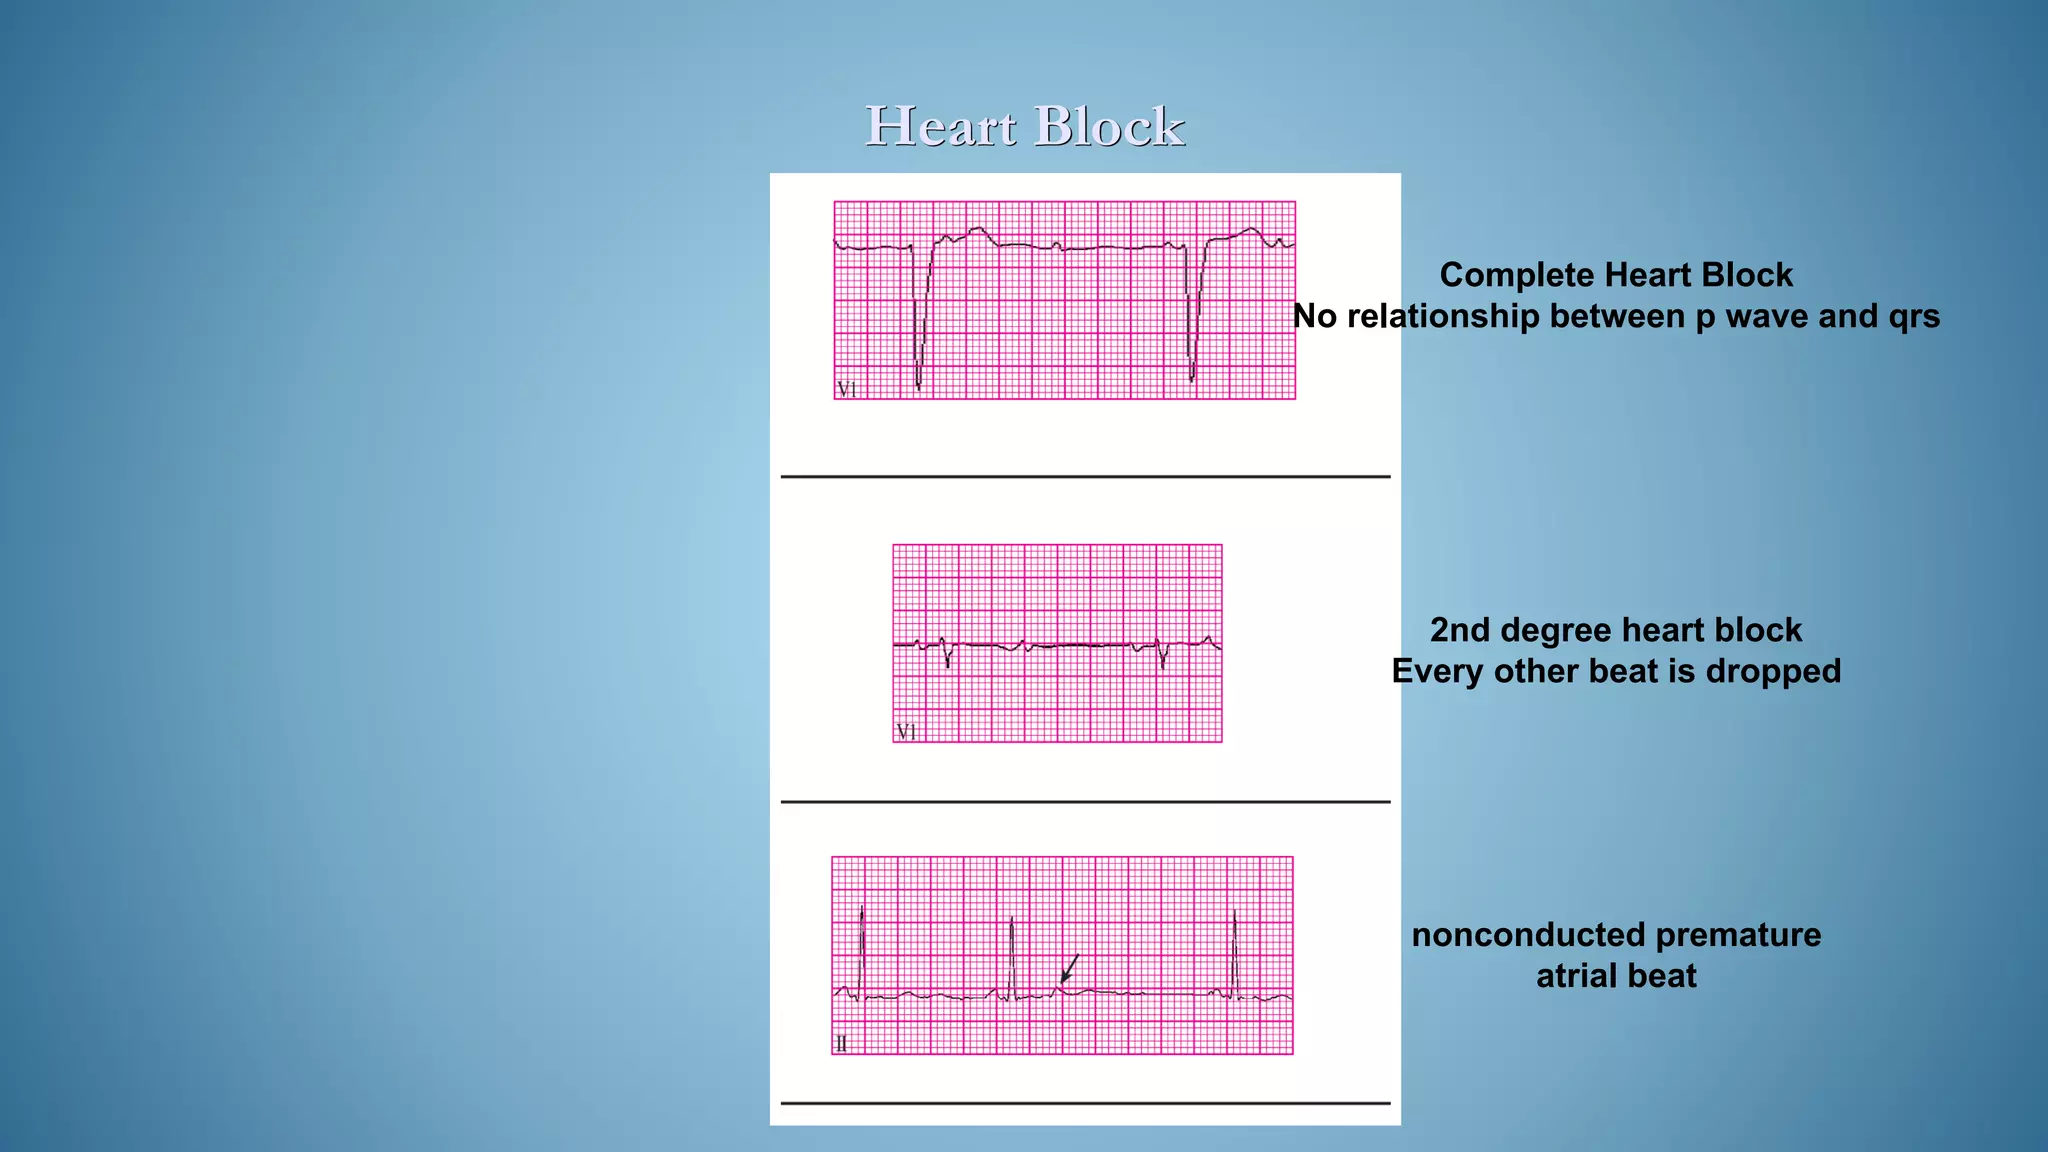
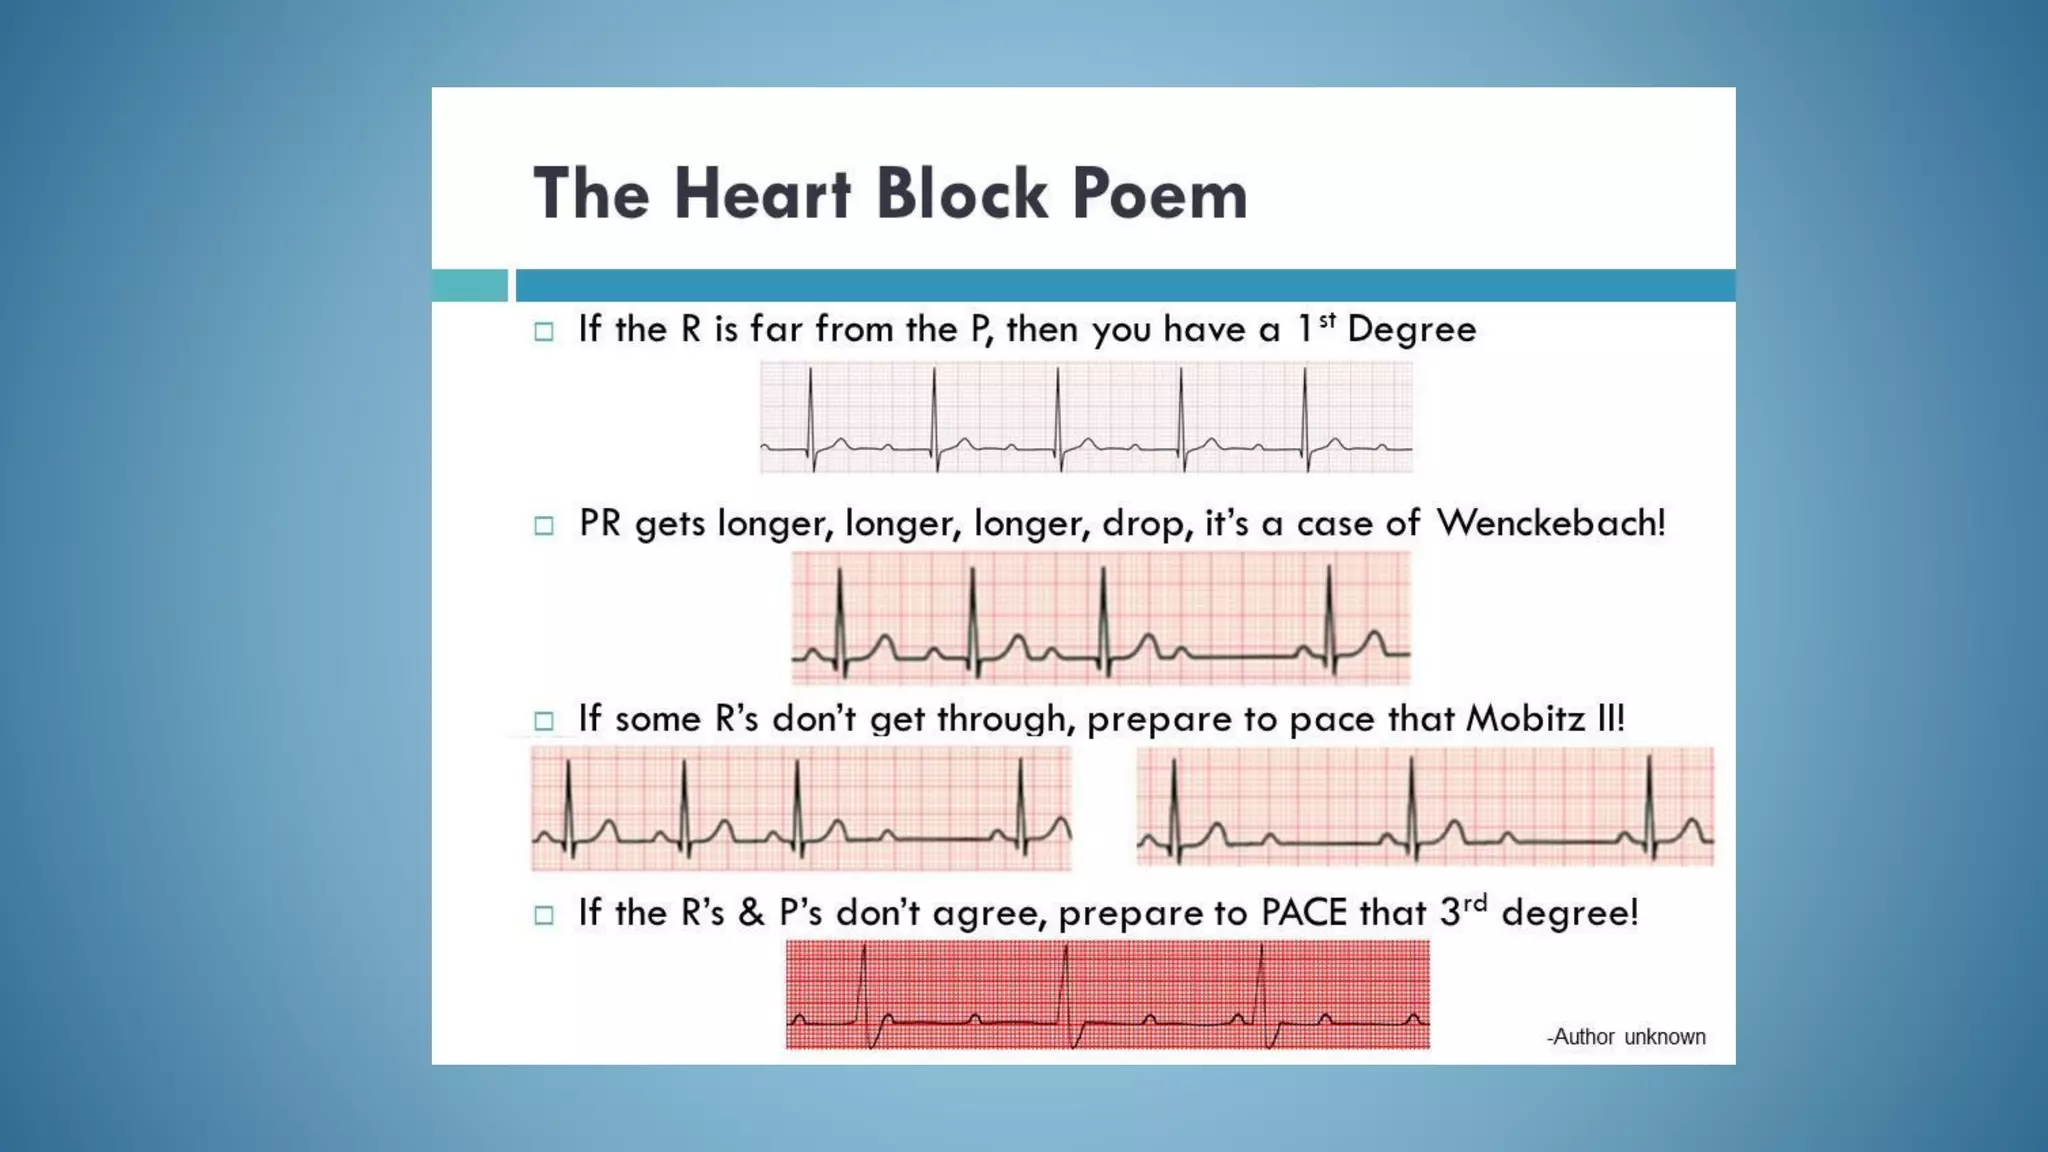
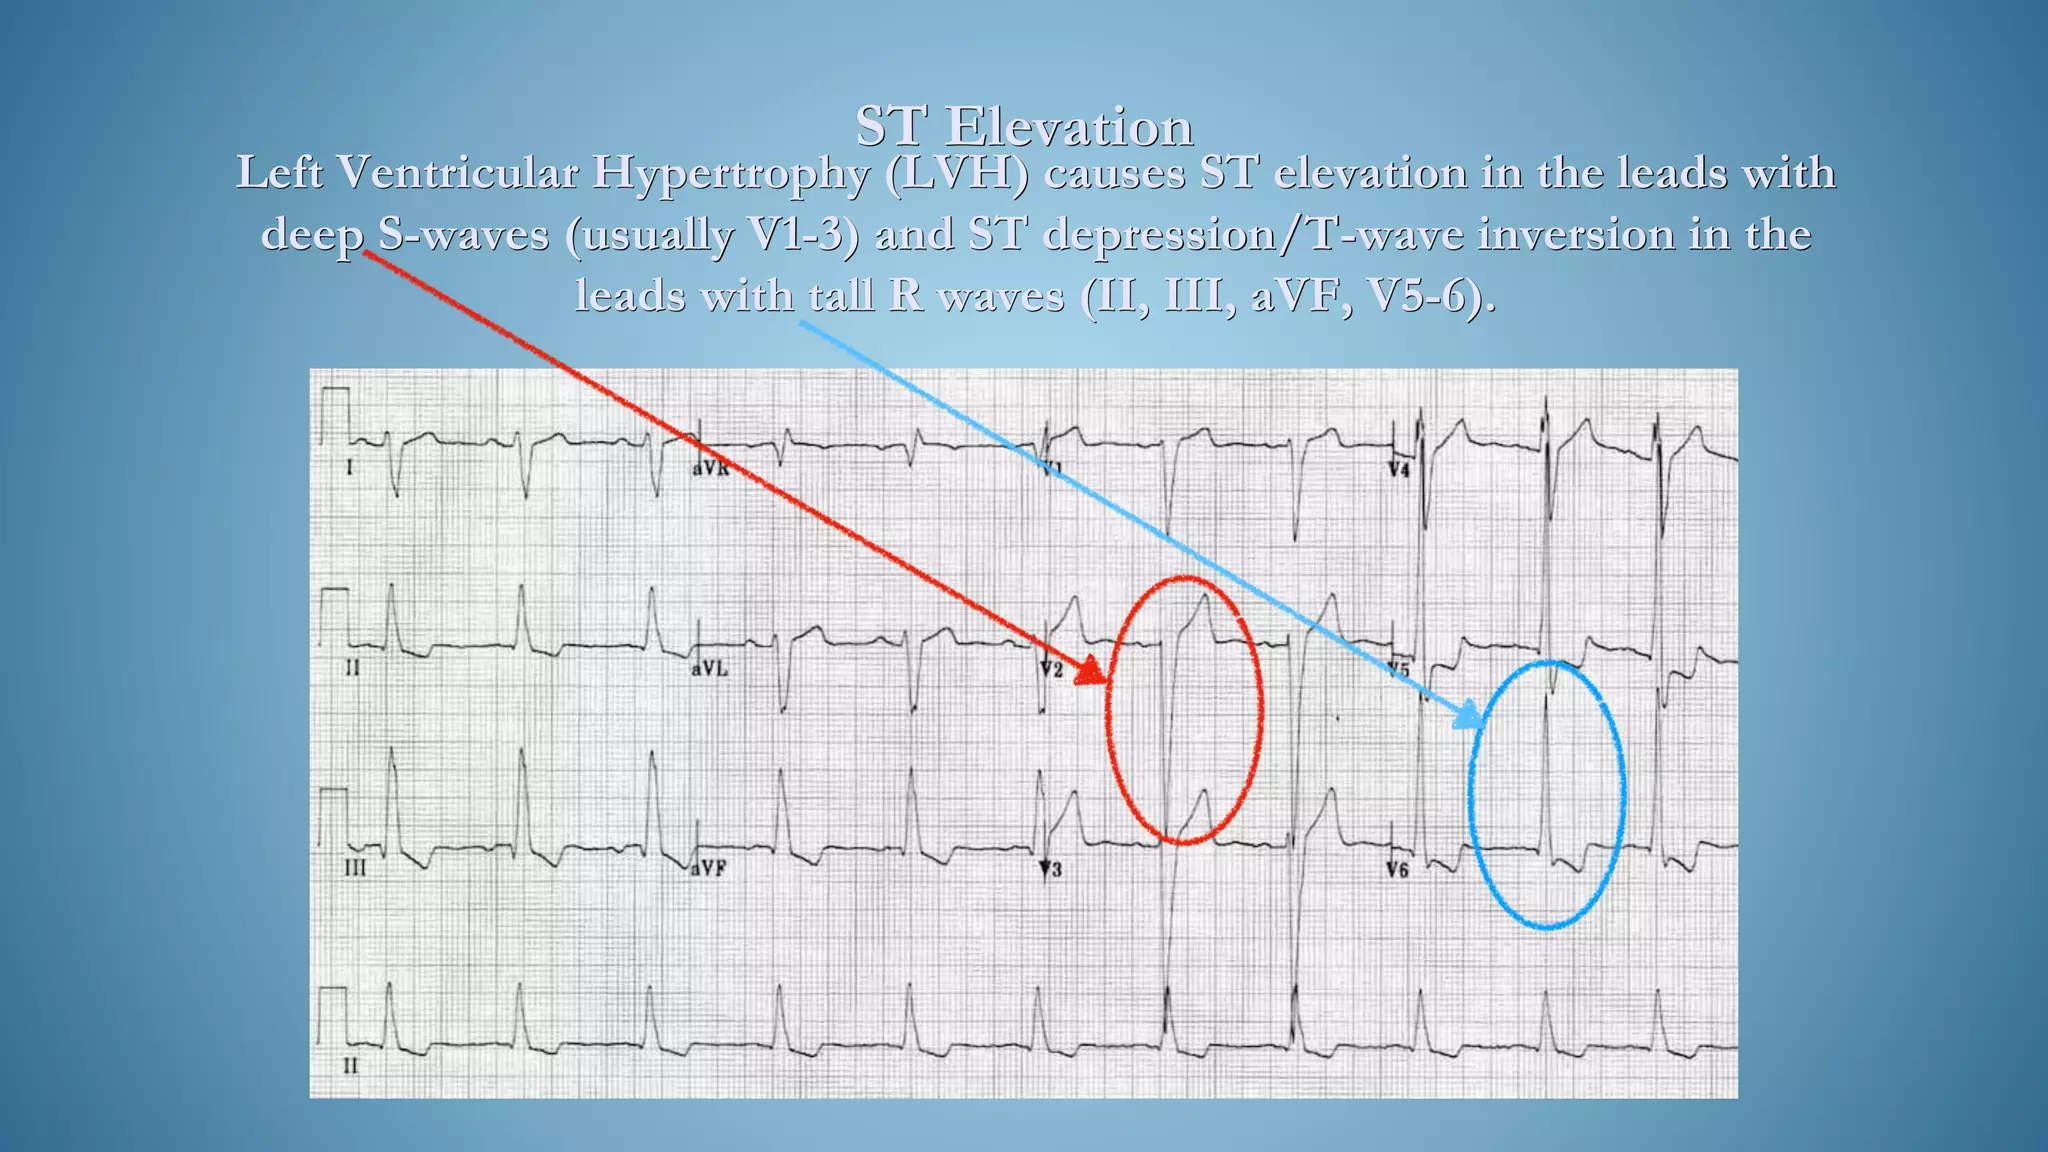
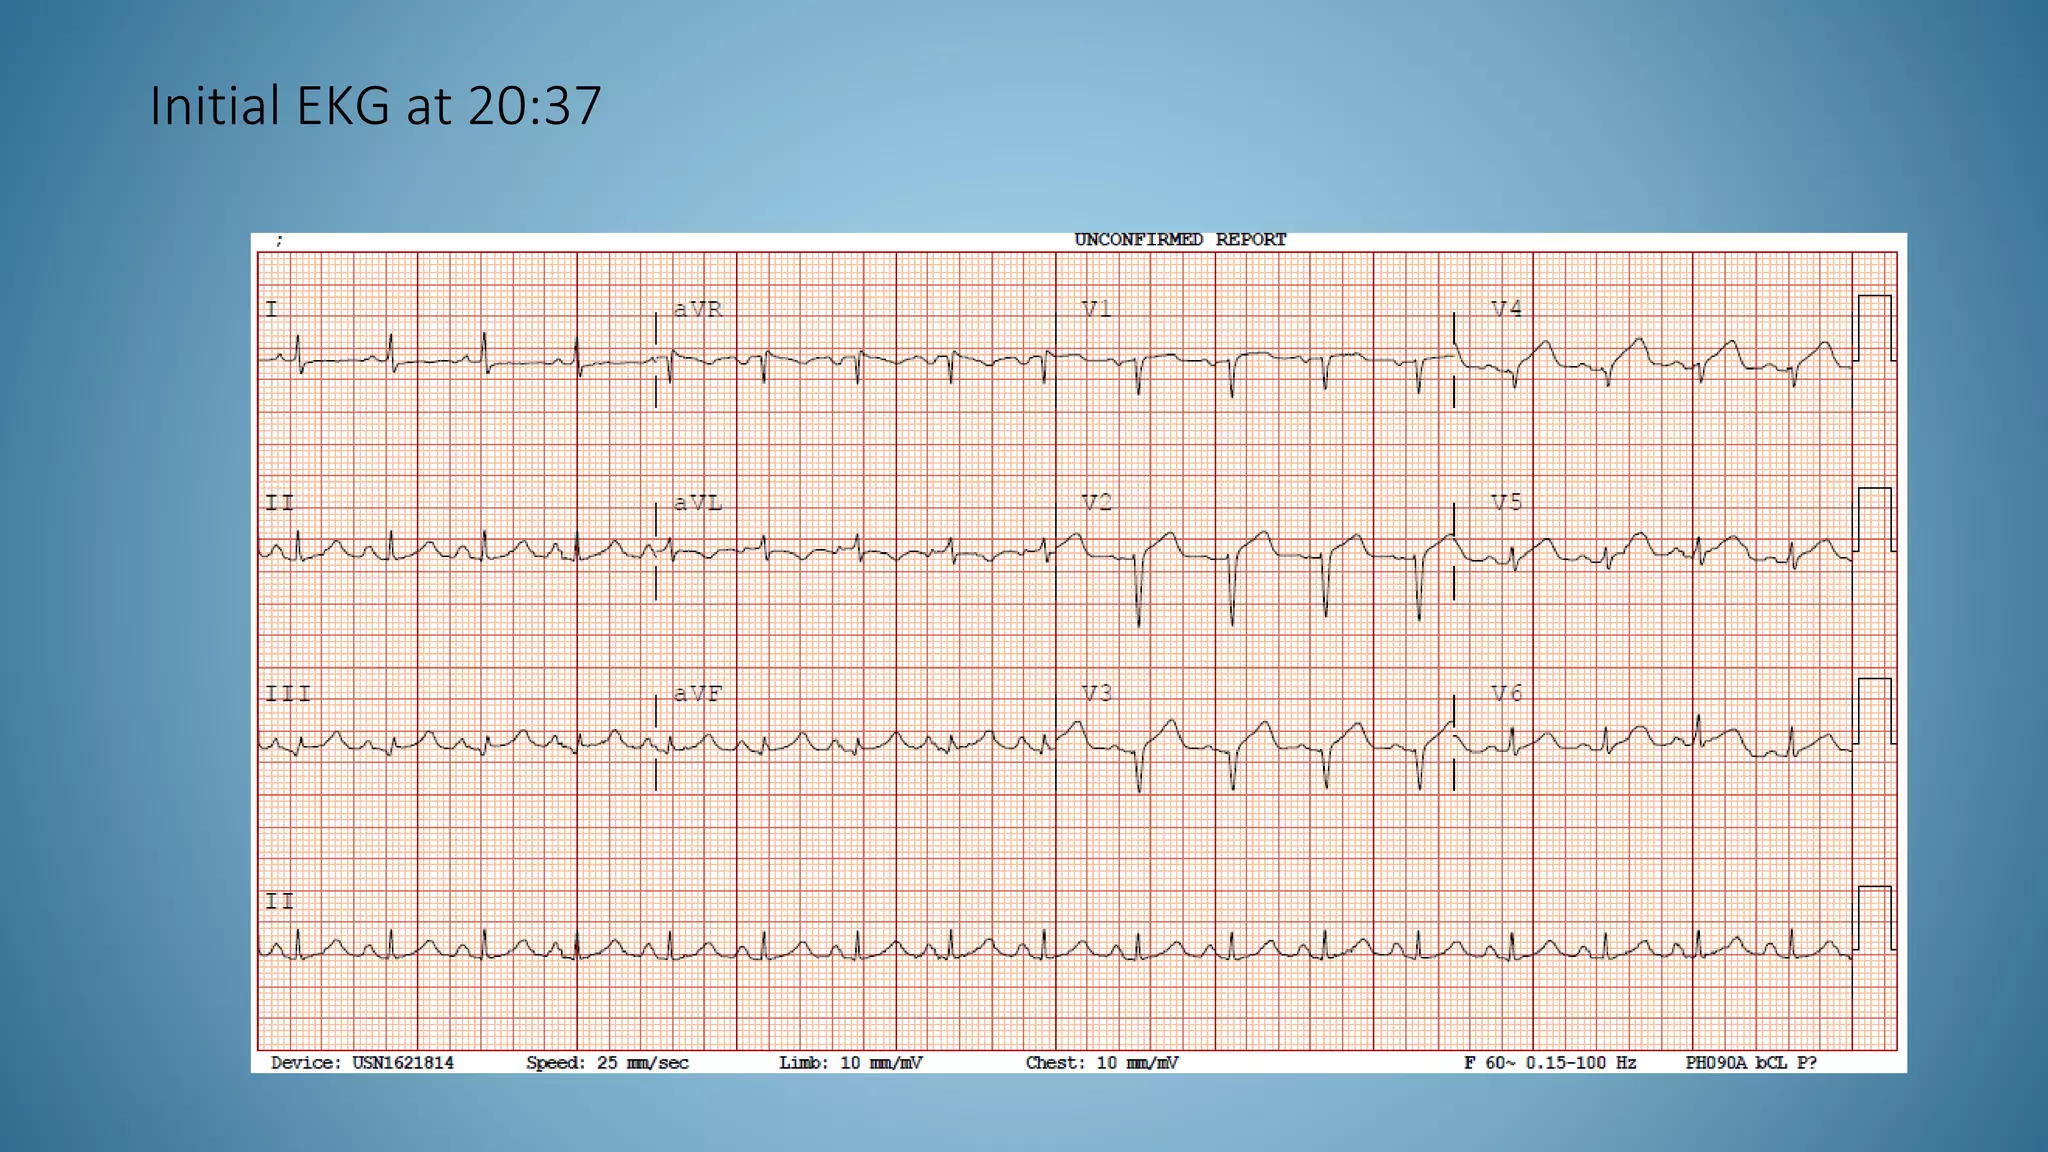
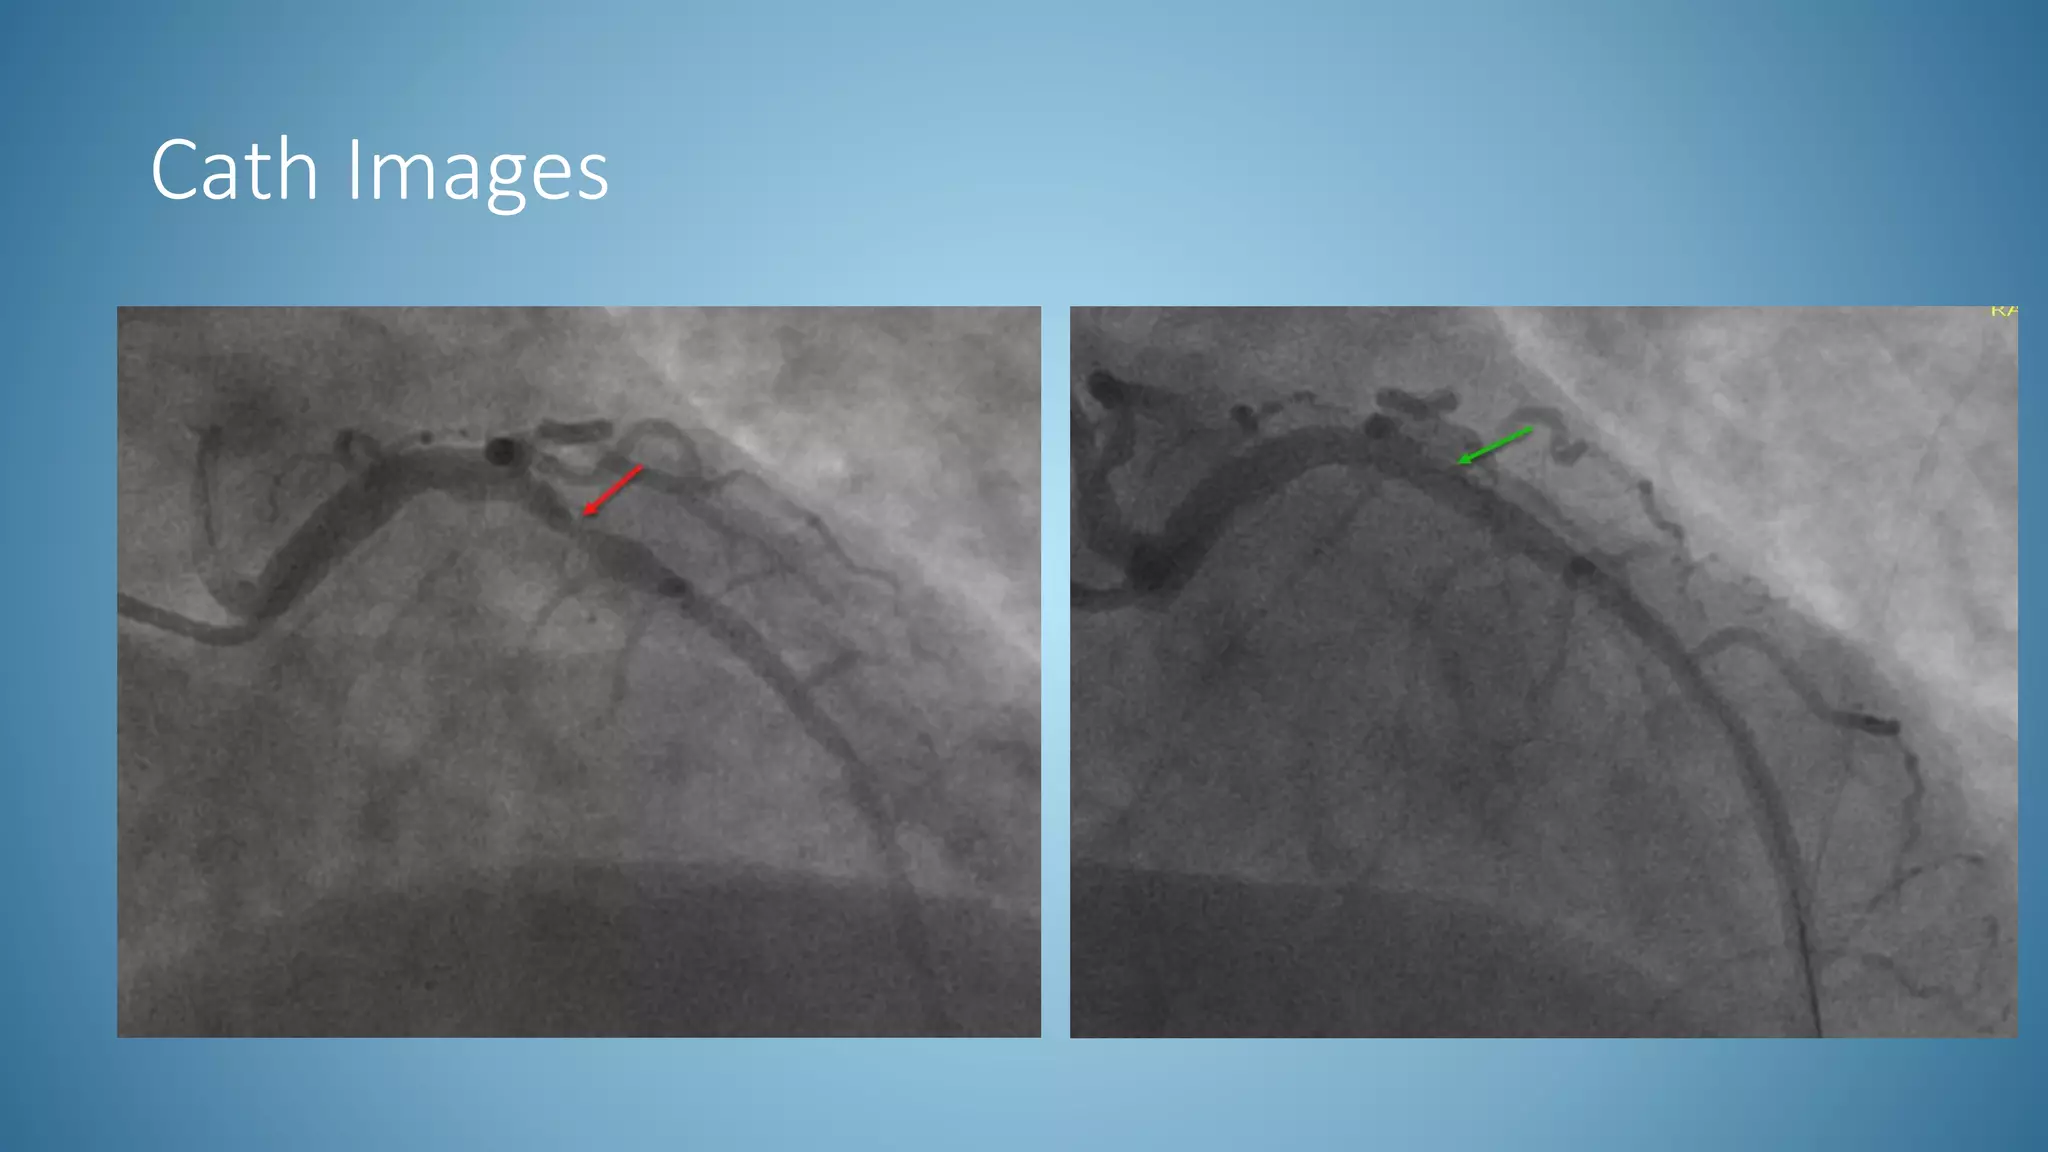
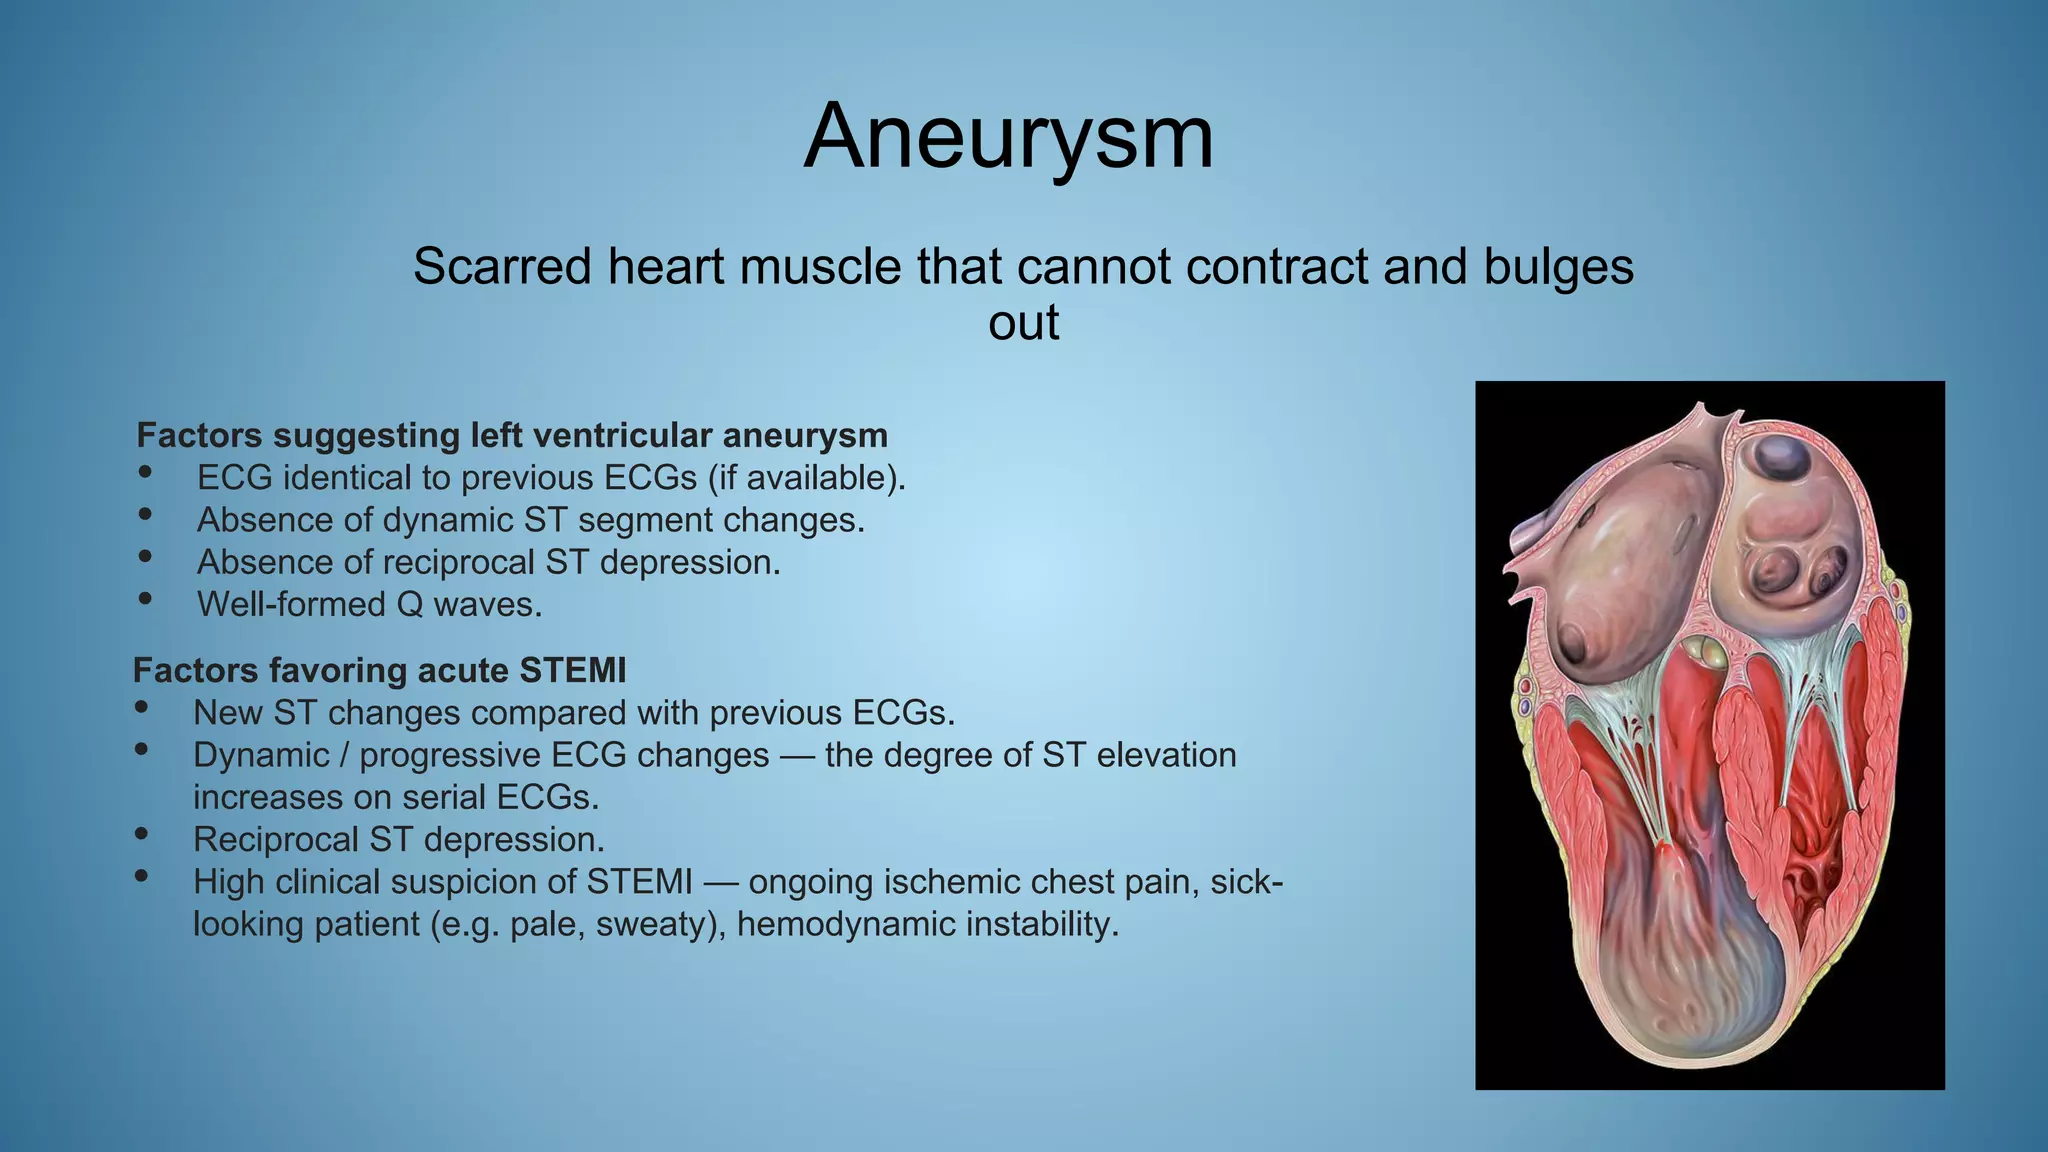
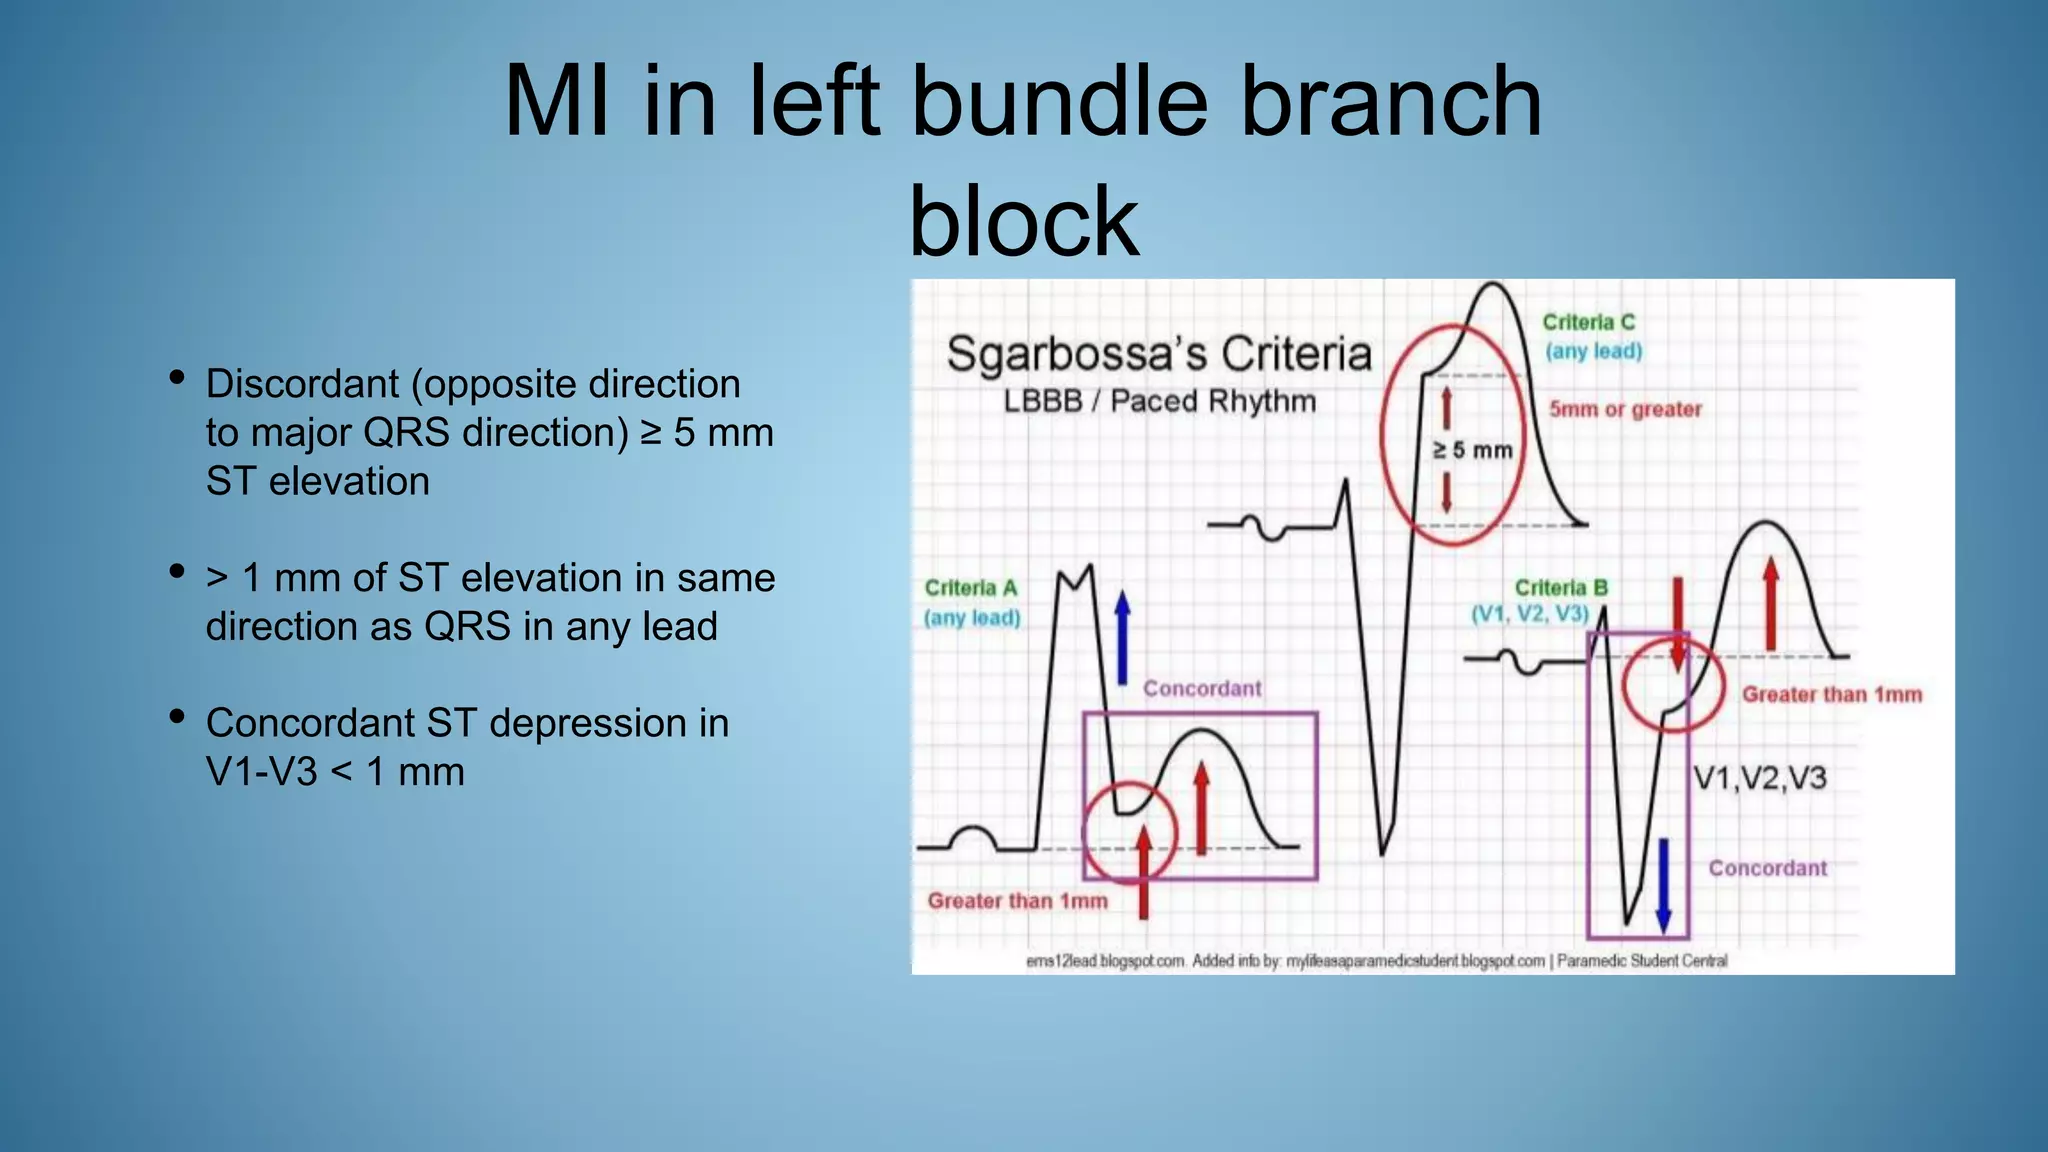
This document summarizes an ECG review presentation given by Dr. Eric Hockstad. It begins with an overview of ECG basics including components like the P wave, PR interval, QRS complex, ST segment, T wave, and QT interval. It then covers various cardiac conditions and how they present on ECG such as heart block, arrhythmias, bundle branch blocks, ST segment changes, and more. Examples are provided of ECGs demonstrating STEMI and cath lab images. Clinical cases are also presented and summarized with ECG findings, treatment outcomes, and teaching points.
ECG interpretation in emergency settingsAimanSaleh5
The document provides an overview of ECG interpretation in emergency settings. It discusses how to identify and diagnose common ECG changes seen in emergencies, including tachyarrhythmias, bradyarrhythmias, acute coronary syndrome, pulmonary embolism, hyperkalemia, and pericardial effusion. Specific ECG patterns are described for conditions like sinus tachycardia, supraventricular tachycardia, atrial fibrillation, ventricular tachycardia, heart block, myocardial infarction, and more. The goal is to help emergency clinicians rapidly identify and manage critical ECG findings.
This ECG shows ventricular tachycardia in a middle-aged patient presenting with palpitations and dizziness. Key findings include a regular broad complex tachycardia with northwest axis and an atypical RBBB pattern in V1 with a taller left "rabbit ear", indicating ventricular tachycardia rather than supraventricular tachycardia with aberrant conduction. Immediate treatment is needed given the life-threatening nature of sustained ventricular tachycardia.
The document contains ECG readings from multiple patients. It discusses cases of supraventricular tachycardia, anterolateral ischemia, atrial fibrillation with complete heart block, right bundle branch block, ventricular extra systoles, anterior myocardial infarction, hypokalemia, acute anterolateral myocardial infarction, and chronic obstructive pulmonary disease. Diagnoses are provided for each case.
The document discusses the ST segment of the ECG and various abnormalities that can occur. It notes that the ST segment represents the interval between ventricular depolarization and repolarization. ST segment elevation or depression can indicate myocardial ischemia or infarction. Various conditions are described that can cause ST segment changes, including myocardial infarction in different coronary artery territories, coronary vasospasm, pericarditis, early repolarization, and others. The morphology and patterns of ST segment abnormalities are discussed for evaluating these conditions.
1. The document describes 4 ECG findings from patients presenting with various symptoms. The first case shows ventricular bigeminy in a patient with chest pain. The second case shows sinus tachycardia with S1Q3T3 pattern in a bedridden patient with breathlessness, indicating pulmonary embolism. The third case shows ventricular tachycardia in a patient recently diagnosed with myocardial infarction. The fourth case provides the Brugada criteria used to diagnose Brugada syndrome.
This document provides an overview of ECG abnormalities, including abnormal rhythms, conduction blocks, hypertrophies, and ischemic changes. Key points include definitions of sinus bradycardia, sinus tachycardia, sinus arrhythmia, various types of atrioventricular and bundle branch blocks, signs of ventricular hypertrophy, ST segment changes indicating ischemia or injury, and abnormal T waves associated with conditions like hyperkalemia. Criteria for interpreting and describing normal ECG findings are also outlined.
The document provides an overview of electrocardiogram (ECG) interpretation. It discusses how ECG is an important diagnostic tool that represents the heart's electrical activity. It then covers the steps for interpreting an ECG, including assessing the rate, rhythm, P waves, PR interval, QRS duration, ST segments, T waves, and changes that can indicate conditions like myocardial infarction. The document emphasizes how analyzing ECG findings can provide clinical insights, such as determining whether a patient may benefit from interventions like thrombolysis.
A 60-year-old male with diabetes and hypertension was found unconscious and intubated. His ECG showed normal sinus rhythm, symmetrical deep T-wave inversions, and ST elevation in aVR. CT brain revealed a large left frontal-parietal intracerebral hemorrhage. The symmetrical T-wave inversions are likely due to reversible cardiomyocyte damage from excessive sympathetic stimulation caused by the increased intracranial pressure from the hemorrhage, known as cerebral T-waves. The differential diagnoses include electrolyte abnormalities, myocardial infarction, and other cardiac and non-cardiac causes, but the findings are consistent with cerebral T-waves in this case.
A 65-year-old man presented to the emergency department with chest pain radiating to his left arm and jaw for 2.5 hours. His EKG showed tall R waves in leads V1-V3 and downsloping ST depression in V1-V4, suggestive of a posterior wall myocardial infarction (MI). Echo revealed akinesia of the posterior left ventricular wall. He received fibrinolytic therapy, which resolved his symptoms. However, he later developed cerebral hemorrhage. The EKG findings, in combination with his risk factors and history, suggested a posterior MI despite the unconventional presentation on EKG.
This document discusses the ST segment of the electrocardiogram (ECG) and abnormalities that can occur. It begins by defining the ST segment and explaining that abnormalities in elevation or depression are often caused by myocardial ischemia or infarction. Several potential causes of ST segment elevation or depression are then listed and described in more detail. Specific ECG patterns that can indicate different types of myocardial infarction or other conditions are also analyzed.
The document provides an overview of electrocardiography (ECG) fundamentals. It defines what an ECG is and discusses the cardiac cycle and interpretation of different ECG components such as waves, intervals, complexes, and segments. Key points covered include the components of the ECG, abnormalities that can be identified from the ECG, cardiac electrical conduction pathways, lead placements, and common causes of ECG abnormalities.
ECG-T wave inversion , Dr. Malala Rajapaksha ,Cardiology unit,General Hospit...malala720
This is a presentation on “What are the deferential Diagnosis a clinician think of when the clinician encounter T inversions in an ECG of a patient”. This will be help full in day today clinical practice and also in academic purposes.
The document provides an overview of ECG basics including:
- Features to assess such as rate, rhythm and axis
- Waves and intervals including P, QRS, ST and T waves
- Calculating heart rate
- Identifying normal sinus rhythm
- Assessing the PR interval, QRS complex, ST segment, T waves and QT interval
- Examples of arrhythmias including atrial fibrillation, atrial flutter, SVT, ventricular tachycardia and fibrillation
- Examples of conduction disease including heart block, bundle branch blocks and fascicular blocks
- Identifying pacing rhythms
Presentation on basic principles of pediatric ecg with important examples: BY Dr. Nivedita Mishra (PGY2 PEDIATRICS, TRIBHUVAN UNIVERSITY TEACHING HOSPITAL,KATHMANDU,NEPAL)
This document discusses the analysis of a 12-lead EKG. It begins by describing the components that should be assessed, including rhythm, rate, axis, and grouped lead analysis. Specific abnormalities are then discussed in detail such as ST segment changes, bundle branch blocks, Q waves, and more. The overall goal is to systematically analyze all aspects of the 12-lead EKG to evaluate for any cardiac abnormalities.
This document provides an overview of electrocardiography (ECG) basics. It defines ECG as a graphical representation of the heart's electrical activity used to assess cardiovascular diseases. It discusses the conduction system of the heart and the 12 standard chest leads used in ECG. It outlines the key steps in ECG interpretation including analyzing rate, rhythm, intervals, chambers, and waveform durations. It describes how to calculate heart rate from the ECG and defines the normal P wave, PR interval, QRS complex, ST segment, QT interval, and ECG axis.
This document summarizes ECG manifestations in hypertrophic cardiomyopathy (HCM). Key findings include ventricular hypertrophy affecting different regions of the heart, intraventricular conduction defects, and left and/or right atrial abnormalities. Specific ECG patterns indicate septal, left ventricular, and right ventricular hypertrophy. ECG changes in HCM commonly include left ventricular hypertrophy, left atrial abnormality, pathological Q waves, and prolonged QT interval. The ECG is useful for screening populations for HCM when echocardiography is not available.
A rapid guide for short-term learning of electrocardiography history and the applications of electrocardiogram in cardiac monitoring and the diagnosis of heart pathologic conditions. Would be useful for the students who want to begin to learn this topic and the healthcare practitioners who need a review.
This document contains 17 questions about ECG interpretations with corresponding answers. Each question provides an ECG reading and clinical scenario, and the answers analyze the ECG findings and provide a diagnosis. Some of the conditions addressed include atrial fibrillation, atrial flutter, ventricular tachycardia, STEMI, non-STEMI, Brugada syndrome, WPW syndrome, hyperkalemia, pulmonary embolism, pericarditis, hypothermia, and more. The document serves as a teaching aid with examples of ECG interpretations for various cardiac conditions and presentations.
This document provides an overview of cardiac physiology concepts including preload, afterload, contractility and the phases of the cardiac cycle. It then links these concepts to ECG patterns and discusses how electrolyte imbalances can affect the ECG. Specific conditions like atrial fibrillation, myocardial infarction and ventricular tachycardia are examined. A case study example is presented of a patient experiencing a potential inferior wall MI. Key aspects of the ECG like the ST segment and T wave are discussed in relation to evaluating for cell injury during a heart attack. Finally, a short quiz is provided to test recognition of ECG components.
This document provides an overview of how to read an electrocardiogram (ECG). It describes the basic anatomy and electrical conduction system of the heart and how the ECG machine records and displays the heart's electrical activity. It then outlines a systematic approach for interpreting an ECG, including evaluating the rhythm, rate, axes, voltages, waves, segments, intervals, and any signs of ischemia, injury, or arrhythmia. Localization of abnormalities is also addressed. Examples are provided throughout to illustrate various normal and pathological ECG patterns.
This document provides a guide to ECGs. It begins by outlining the objectives which are to cover electrical conduction in the heart, lead placement, ECG settings, components, waves, complexes, and abnormalities. It then discusses the cardiac conduction system, ECG waves and components, 12-lead ECG placement, components of the ECG including rate, rhythm, axis, P wave, PR interval, QRS complex, QT interval, ST segment, T wave, and other waves. It provides examples of normal ECG characteristics and discusses how to systematically analyze an ECG by examining rate, rhythm, axis, P wave, PR interval, QRS complex, QT interval and QTc, ST segment, and T wave
This document discusses various non-coronary causes of ST-elevation on electrocardiograms (ECGs) including ventricular aneurysms, pericarditis, early repolarization patterns, left ventricular hypertrophy, left bundle branch block, hypothermia, cardioversion, intraventricular hemorrhage, hyperkalemia, Brugada pattern, type 1C antiarrhythmic drugs, hypercalcemia, pulmonary embolism, hypothermia, myocarditis, and tumor invasion of the left ventricle. It then discusses left ventricular aneurysms, early repolarization, acute pericarditis, hyperkalemia, hypothermia, increased intracranial pressure, Brugada syndrome, Tak
Arrhythmias refer to abnormalities in the cardiac rhythm. There are two main types: bradycardia where the heart rate is slow, and tachycardia where the heart rate is fast. Specific arrhythmias include sinus bradycardia, various types of heart block, atrial fibrillation, atrial flutter, AV nodal re-entry tachycardia, ventricular tachycardia, and ventricular fibrillation. Diagnosis involves electrocardiography and other tests. Treatment depends on the type of arrhythmia but may include medications, catheter ablation, pacemaker implantation, or cardioversion. Lifestyle modifications and avoiding arrhythmia triggers can also help management.
Mimicks Masks of Myocardial Infarction.pptxRajeshPonnada3
This document discusses various ECG patterns that can mimic myocardial infarction (MI) or mask an underlying MI. It describes patterns seen in conditions like non-infarction ischemia, acute pericarditis, LVH, LBBB, pulmonary embolism, Brugada syndrome, hypothermia, hyperkalemia, and WPW syndrome. It provides the characteristic ECG findings and mechanisms for each of these conditions and discusses how they can simulate or obscure the signs of an acute MI on ECG.
This presentation was provided by Steph Pollock of The American Psychological Association’s Journals Program, and Damita Snow, of The American Society of Civil Engineers (ASCE), for the initial session of NISO's 2024 Training Series "DEIA in the Scholarly Landscape." Session One: 'Setting Expectations: a DEIA Primer,' was held June 6, 2024.
Leveraging Generative AI to Drive Nonprofit InnovationTechSoup
In this webinar, participants learned how to utilize Generative AI to streamline operations and elevate member engagement. Amazon Web Service experts provided a customer specific use cases and dived into low/no-code tools that are quick and easy to deploy through Amazon Web Service (AWS.)
LAND USE LAND COVER AND NDVI OF MIRZAPUR DISTRICT, UPRAHUL
This Dissertation explores the particular circumstances of Mirzapur, a region located in the
core of India. Mirzapur, with its varied terrains and abundant biodiversity, offers an optimal
environment for investigating the changes in vegetation cover dynamics. Our study utilizes
advanced technologies such as GIS (Geographic Information Systems) and Remote sensing to
analyze the transformations that have taken place over the course of a decade.
The complex relationship between human activities and the environment has been the focus
of extensive research and worry. As the global community grapples with swift urbanization,
population expansion, and economic progress, the effects on natural ecosystems are becoming
more evident. A crucial element of this impact is the alteration of vegetation cover, which plays a
significant role in maintaining the ecological equilibrium of our planet.Land serves as the foundation for all human activities and provides the necessary materials for
these activities. As the most crucial natural resource, its utilization by humans results in different
'Land uses,' which are determined by both human activities and the physical characteristics of the
land.
The utilization of land is impacted by human needs and environmental factors. In countries
like India, rapid population growth and the emphasis on extensive resource exploitation can lead
to significant land degradation, adversely affecting the region's land cover.
Therefore, human intervention has significantly influenced land use patterns over many
centuries, evolving its structure over time and space. In the present era, these changes have
accelerated due to factors such as agriculture and urbanization. Information regarding land use and
cover is essential for various planning and management tasks related to the Earth's surface,
providing crucial environmental data for scientific, resource management, policy purposes, and
diverse human activities.
Accurate understanding of land use and cover is imperative for the development planning
of any area. Consequently, a wide range of professionals, including earth system scientists, land
and water managers, and urban planners, are interested in obtaining data on land use and cover
changes, conversion trends, and other related patterns. The spatial dimensions of land use and
cover support policymakers and scientists in making well-informed decisions, as alterations in
these patterns indicate shifts in economic and social conditions. Monitoring such changes with the
help of Advanced technologies like Remote Sensing and Geographic Information Systems is
crucial for coordinated efforts across different administrative levels. Advanced technologies like
Remote Sensing and Geographic Information Systems
9
Changes in vegetation cover refer to variations in the distribution, composition, and overall
structure of plant communities across different temporal and spatial scales. These changes can
occur natural.
This document provides an overview of wound healing, its functions, stages, mechanisms, factors affecting it, and complications.
A wound is a break in the integrity of the skin or tissues, which may be associated with disruption of the structure and function.
Healing is the body’s response to injury in an attempt to restore normal structure and functions.
Healing can occur in two ways: Regeneration and Repair
There are 4 phases of wound healing: hemostasis, inflammation, proliferation, and remodeling. This document also describes the mechanism of wound healing. Factors that affect healing include infection, uncontrolled diabetes, poor nutrition, age, anemia, the presence of foreign bodies, etc.
Complications of wound healing like infection, hyperpigmentation of scar, contractures, and keloid formation.
Reimagining Your Library Space: How to Increase the Vibes in Your Library No ...Diana Rendina
Librarians are leading the way in creating future-ready citizens – now we need to update our spaces to match. In this session, attendees will get inspiration for transforming their library spaces. You’ll learn how to survey students and patrons, create a focus group, and use design thinking to brainstorm ideas for your space. We’ll discuss budget friendly ways to change your space as well as how to find funding. No matter where you’re at, you’ll find ideas for reimagining your space in this session.
Main Java[All of the Base Concepts}.docxadhitya5119
This is part 1 of my Java Learning Journey. This Contains Custom methods, classes, constructors, packages, multithreading , try- catch block, finally block and more.
How to Fix the Import Error in the Odoo 17Celine George
An import error occurs when a program fails to import a module or library, disrupting its execution. In languages like Python, this issue arises when the specified module cannot be found or accessed, hindering the program's functionality. Resolving import errors is crucial for maintaining smooth software operation and uninterrupted development processes.
Exploiting Artificial Intelligence for Empowering Researchers and Faculty, In...Dr. Vinod Kumar Kanvaria
Exploiting Artificial Intelligence for Empowering Researchers and Faculty,
International FDP on Fundamentals of Research in Social Sciences
at Integral University, Lucknow, 06.06.2024
By Dr. Vinod Kumar Kanvaria
हिंदी वर्णमाला पीपीटी, hindi alphabet PPT presentation, hindi varnamala PPT, Hindi Varnamala pdf, हिंदी स्वर, हिंदी व्यंजन, sikhiye hindi varnmala, dr. mulla adam ali, hindi language and literature, hindi alphabet with drawing, hindi alphabet pdf, hindi varnamala for childrens, hindi language, hindi varnamala practice for kids, https://www.drmullaadamali.com
1. ECG Review 2020
Eric Hockstad, MD
Medical Director of Cardiac Cath Labs
University of Kansas Medical System
2020 American Heart Association
Virtual Cardiac Symposium
8. ST Segment
■Segment between end of QRS complex (J point) and beginning of T wave
■Represents state of unchanged polarization between end of depolarization
and beginning of repolarization
■Should be on the same plane as the TP segment (between T wave and next P)
9. T Wave
■ Represents ventricular repolarization
■Occurs in general direction of ventricular depolarization
(QRS)
■Upright in I, II, V5-V6
■Inverted in aVR
11. ■ Normal = 350 – 450 ms for HR=60
■For every 10-beat increase or decrease of the rate, 20 ms is deducted or added to
the QT
■ Bazett's correction
■QTc = measured QT (secs) divided by square root of RR interval (secs)
■ Obvious abnormality if QT > ½ RR interval (extending more than 1/2 way to
next QRS)
■ Prolonged QT can lead to Torsades de pointes (the QRS complexes “twist”
around the isoelectric line
QT Interval
14. Heart Block
Complete Heart Block
No relationship between p wave and qrs
2nd degree heart block
Every other beat is dropped
nonconducted premature
atrial beat
18. In RBBB, activation of the right ventricle is delayed as depolarisation has to
spread across the septum from the left ventricle.
• The left ventricle is activated normally, meaning that the early part of
the QRS complex is unchanged.
• The delayed right ventricular activation produces a secondary R wave
(R’) in the right precordial leads (V1-3) and a wide, slurred S wave in
the lateral leads.
• Delayed activation of the right ventricle also gives rise to secondary
repolarization abnormalities, with ST depression and T wave inversion
in the right precordial leads.
Right Bundle Branch Block
20. Left bundle branch block
• The overall direction of depolarization (from right to left) produces tall R
waves in the lateral leads (I, V5-6) and deep S waves in the right
precordial leads (V1-3), and usually leads to left axis deviation.
• As the ventricles are activated sequentially (right, then left) rather than
simultaneously, this produces a broad or notched (‘M’-shaped) R wave
in the lateral leads.
23. Early repolarization causes mild ST elevation with tall T-waves mainly in the precordial
leads. There is often notching of the J-point — the “fish-hook” pattern.
ST elevation
24. ST Elevation
Acute Pericarditis causes widespread concave (“saddleback”) ST segment
elevation with PR segment depression in multiple leads, typically involving I,
II, III, aVF, aVL, and V2-6.
Spodick’s sign Downsloping TP segment in patients with acute pericarditis
25. ST Elevation
Left Ventricular Hypertrophy (LVH) causes ST elevation in the leads with
deep S-waves (usually V1-3) and ST depression/T-wave inversion in the
leads with tall R waves (II, III, aVF, V5-6).
26. Definition of ST elevation MI
ST elevation of ? mm in contiguous leads except V2 and V3 • 1 mm
ST elevation of ? mm in men in leads V2 and V3
ST elevation of ? mm in women in leads V2 and V3
• 2 mm
• 1.5 mm
27. Clinical History
• 59 yo female presents to the Emergency Room complaining of
shortness of breath for weeks, “has an appointment with PCP
tomorrow but can’t wait”
• PMH: Diabetes, asthma, hypertension, hyperlipidemia, lymphedema
30. Outcome Results
• STEMI activated off of second EKG
• Trop elevated at 2.78
• Emergently taken to cath lab: pt in acute cardiogenic pulmonary
edema in the setting of recent, though more than 48 hours, acute
anterior MI; successful treatment of a proximal hazy 80% thrombotic
LAD lesion w/ stent
• Repeat echo was done 2 days after STEMI and showed an improved EF
of 35-40%
• 4 day admission stay, discharged home
32. Clinical History
• 26 yo male presented to the Emergency Room
• Complaints of constant, severe, sharp chest pain 8/10, sudden onset during
exercise class 1.5 hours prior
• Pain was initially across chest and now on left side
• Complaints of diaphoresis, nausea, dizziness, tingling in arms, shortness of
breath
• Family Hx: CAD, grandpa died at age 48, multiple uncles with CAD, father
coronary artery bypass at age 55
• No other PMH
33.
34. Would you send this patient emergently to the cath
lab?
A. Yes
B. No
C. Of course not; he’s 26 years old
36. Outcome Results
• STEMI activated by Emergency Room (30 min after arrival)
• Initial Trop 0.23
• Elevated LDL at 249, there is a high chance for familial hypercholesteremia
• Echo performed resulting with a mild ischemic cardiomyopathy significant for
an EF of 40% with LAD wall motion abnormalities
• 3 day admission stay
• EDUCATION POINTS
• Less likely in younger age group, but bigger opportunity to make a difference
37. Clinical History
• 77 yo male presents to the Emergency Room c/o chest pain for 36-48
hours
• States pain is constant, pressure-like, radiating to the back, up to the
jaw, intermittently to his left arm; pain improves with exertion
• PMH: HTN, HLD, DM, history of stroke
38.
39.
40.
41. Outcome Results
• Pt was not STEMI activated; clinical impression was NSTEMI
• After review during admission, the ECG was felt to reflect STEMI
43. Outcome Results
• Left heart cath showed occluded LAD s/p stent placed
• Echo showed EF 60-65% with hypokinesis in septal wall
• Initial trop 1.44
• 2 day admission stay, discharged to home
44. Clinical History
• 47 yo female arrived to Emergency Room c/o chest pain up into her
throat while cleaning approximately 30 mins prior to arrival, SOA and
dizziness as well
• No significant PMH
50. Outcome Results
• Subtotal occlusion, 99% of the mid to distal LAD, s/p balloon
angioplasty and 2 stents
• Initial Trop result 0.58
• Subsequent echo showed reduced ejection fraction of 40% and a
thrombus in the LV
• 7 day admission stay, discharged to home
51.
52.
53. ST depression never takes precedence over ST elevation. If you see depression
check contralateral leads
54. Clinical History
• 60 yo male arrived to Emergency Room from nursing care facility with
complaints of GI bleed, SOB; states having vomiting and abdominal
pain.
• While en route, EMS obtained EKG and when questioning pt again
about pain and specifically chest, pt states having "some" chest pain in
mid chest rating it 8-9/10.
• Pt also hypotensive en route.
• PMH: Hepatitis C, HTN, hemorrhagic stroke. Has had decreased
appetite the past few days
55.
56. Outcome Results
• STEMI activated by EMS
• Pt emergently to cath lab: cardiogenic shock in the setting of
takotsubo cardiomyopathy; IABP placed. Pt admitted to CICU.
• Dx: acute systolic and diastolic HFrEF, EF: 15%, Hypovolemic shock, on
pressor support with Vasopressin; GI consulted for GI bleed/melena
58. Wellen’s Syndrome
• Deep symmetric T waves or biphasic T waves anteriorly
• 89% specific for proximal Left Anterior Descending Stenosis
59. Hypothermia
• Classic ECG finding called Osborne Waves (J waves)
• J point is the spot marking the end of the QRS, and the
start of the ST segment
• J waves occur just proximal to the J point, as a notch in the
end of the QRS
• J waves are very rare, and originally described in
hypothermia
• The height of the J wave correlates with the severity of the
hypothermia (<90°)
60.
61. Aneurysm
Scarred heart muscle that cannot contract and bulges
out
Factors suggesting left ventricular aneurysm
• ECG identical to previous ECGs (if available).
• Absence of dynamic ST segment changes.
• Absence of reciprocal ST depression.
• Well-formed Q waves.
Factors favoring acute STEMI
• New ST changes compared with previous ECGs.
• Dynamic / progressive ECG changes — the degree of ST elevation
increases on serial ECGs.
• Reciprocal ST depression.
• High clinical suspicion of STEMI — ongoing ischemic chest pain, sick-
looking patient (e.g. pale, sweaty), hemodynamic instability.
63. De Winter ECG pattern
• Anterior STEMI equivalent that presents without obvious ST segment elevation
• Upsloping ST depression/J point depression (> 1mm at J-point) in the precordial leads
V2-6, plus leads I & II.
• Peaked anterior T waves, with the ascending limb of the T wave starting below the
isoelectric baseline.
• ST elevation in aVR > 0.5mm
• The de Winter pattern is seen in ~2% of acute LAD occlusions andis under-recognised
by clinicians.
64. MI in left bundle branch
block
• Discordant (opposite direction
to major QRS direction) ≥ 5 mm
ST elevation
• > 1 mm of ST elevation in same
direction as QRS in any lead
• Concordant ST depression in
V1-V3 < 1 mm