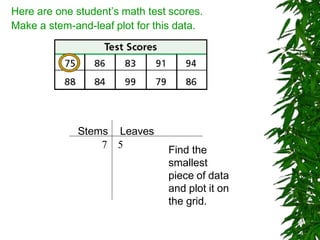
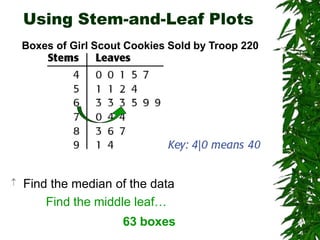
Stem-and-Leaf
Plots
Presented by:
Alcantara, Michelle
R.
Stem-and-Leaf Plot
* Uses place value to organize data.
*Shows data in an organized way so it can be
analyzed easily.
* Organizes data so it is easier to find the
median, mode, and range.
Here are the scores for a
freshman basketball team
 Here is the same data organized into a
stem-and-leaf plot.
Can you tell how the
stem-and-leaf plot was made?
The first number
in the data is 27.
Here is the 2 in
the tens place. Here is the 7 in
the ones place.
The key shows us
which place value
the digits represent.
The stems all
represent tens
place in this
stem-and-leaf
plot. The leaves all
represent ones.
Let’s
try one
together…
Here are one student’s math test scores.
Make a stem-and-leaf plot for this data.
First, draw
the dividing
lines.
Here are one student’s math test scores.
Make a stem-and-leaf plot for this data.
Next, label
the stem side
and the leaf
side.
Stems Leaves
Here are one student’s math test scores.
Make a stem-and-leaf plot for this data.
Find the
smallest
piece of data
and plot it on
the grid.
Stems Leaves
7 5
Here are one student’s math test scores.
Make a stem-and-leaf plot for this data.
Find the next
smallest
piece of data
and plot it on
the grid.
Stems Leaves
7 5 9
The 7 for the tens
place is already
there. We just
add the 9.
Continue with this process until
you have entered all the data.
Stems Leaves
7 5 9
8 3 4 6 6 8
9 1 4 9
Remember to add a title.
Test Scores
Stems Leaves
7 5 9
8 3 4 6 6 8
9 1 4 9
Don’t forget the key!
Test Scores
Stems Leaves
7 5 9
8 3 4 6 6 8
9 1 4 9
Key: 7 5 means 75
You just
completed a
stem-and-leaf plot!
Now, try it
on your own…
This table shows the times in seconds and
hundredths of seconds for the women’s
500-meter speed-skating competition in
the 2002 Winter Olympics.
Use this data to make a stem-and-leaf plot.
2002 Winter Olympics 500-Meter
Speed-Skating Times in Seconds
Check your work…
2002 Winter Olympics 500-Meter
Speed-Skating Times in Seconds
Using Stem-and-Leaf Plots
Boxes of Girl Scout Cookies Sold by Troop 220
 What was the least number of cookies sold?
40 boxes
Using Stem-and-Leaf Plots
 What was the largest number of cookies
sold?
Boxes of Girl Scout Cookies Sold by Troop 220
94 boxes
Using Stem-and-Leaf Plots
 Find the median of the data
Find the middle leaf…
63 boxes
Boxes of Girl Scout Cookies Sold by Troop 220
Using Stem-and-Leaf Plots
 Find the mode of the data
Look for the number that occurs
most often in a row of leaves
63 boxes
Boxes of Girl Scout Cookies Sold by Troop 220
THANK YOU
FOR LISTENING
!!!

Stem and Leaf Plots.pptx

  • 1.
  • 2.
    Stem-and-Leaf Plot * Usesplace value to organize data. *Shows data in an organized way so it can be analyzed easily. * Organizes data so it is easier to find the median, mode, and range.
  • 3.
    Here are thescores for a freshman basketball team  Here is the same data organized into a stem-and-leaf plot.
  • 4.
    Can you tellhow the stem-and-leaf plot was made? The first number in the data is 27. Here is the 2 in the tens place. Here is the 7 in the ones place.
  • 5.
    The key showsus which place value the digits represent.
  • 6.
    The stems all representtens place in this stem-and-leaf plot. The leaves all represent ones.
  • 7.
  • 8.
    Here are onestudent’s math test scores. Make a stem-and-leaf plot for this data. First, draw the dividing lines.
  • 9.
    Here are onestudent’s math test scores. Make a stem-and-leaf plot for this data. Next, label the stem side and the leaf side. Stems Leaves
  • 10.
    Here are onestudent’s math test scores. Make a stem-and-leaf plot for this data. Find the smallest piece of data and plot it on the grid. Stems Leaves 7 5
  • 11.
    Here are onestudent’s math test scores. Make a stem-and-leaf plot for this data. Find the next smallest piece of data and plot it on the grid. Stems Leaves 7 5 9 The 7 for the tens place is already there. We just add the 9.
  • 12.
    Continue with thisprocess until you have entered all the data. Stems Leaves 7 5 9 8 3 4 6 6 8 9 1 4 9
  • 13.
    Remember to adda title. Test Scores Stems Leaves 7 5 9 8 3 4 6 6 8 9 1 4 9
  • 14.
    Don’t forget thekey! Test Scores Stems Leaves 7 5 9 8 3 4 6 6 8 9 1 4 9 Key: 7 5 means 75
  • 15.
  • 16.
    Now, try it onyour own…
  • 17.
    This table showsthe times in seconds and hundredths of seconds for the women’s 500-meter speed-skating competition in the 2002 Winter Olympics.
  • 18.
    Use this datato make a stem-and-leaf plot. 2002 Winter Olympics 500-Meter Speed-Skating Times in Seconds
  • 19.
    Check your work… 2002Winter Olympics 500-Meter Speed-Skating Times in Seconds
  • 20.
    Using Stem-and-Leaf Plots Boxesof Girl Scout Cookies Sold by Troop 220  What was the least number of cookies sold? 40 boxes
  • 21.
    Using Stem-and-Leaf Plots What was the largest number of cookies sold? Boxes of Girl Scout Cookies Sold by Troop 220 94 boxes
  • 22.
    Using Stem-and-Leaf Plots Find the median of the data Find the middle leaf… 63 boxes Boxes of Girl Scout Cookies Sold by Troop 220
  • 23.
    Using Stem-and-Leaf Plots Find the mode of the data Look for the number that occurs most often in a row of leaves 63 boxes Boxes of Girl Scout Cookies Sold by Troop 220
  • 24.