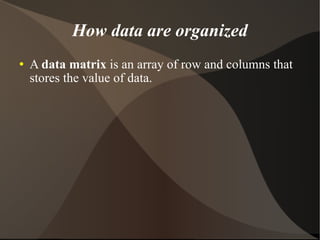
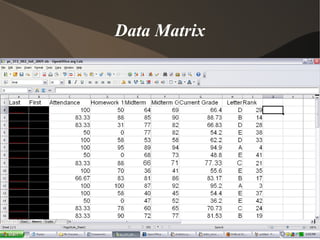
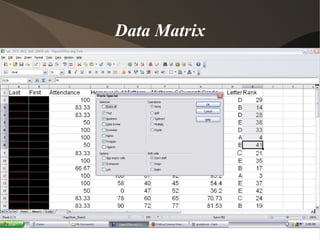
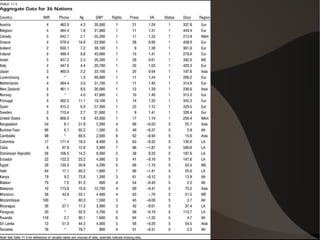
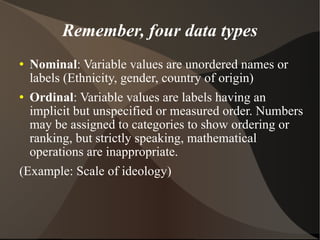
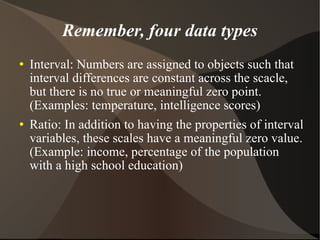
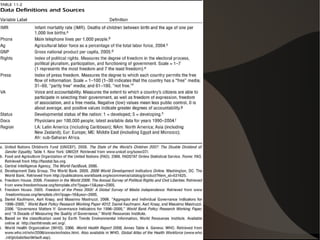
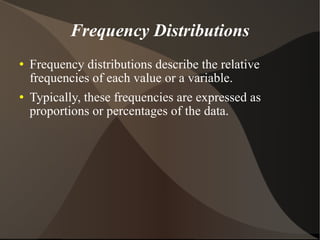
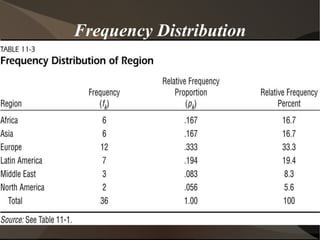
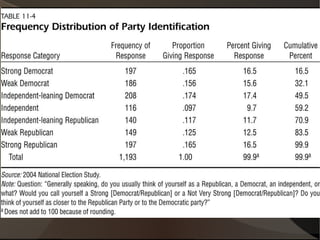
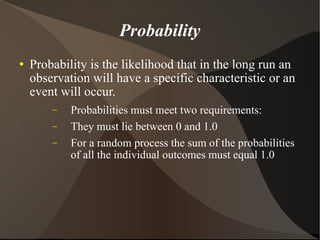
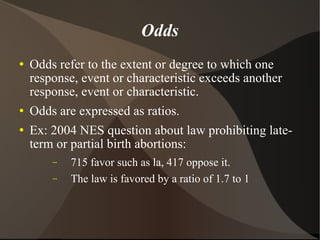
Statistics: An Introduction Andrew Martin PS 372  Fall 2009
We will examine …  Methods for describing and exploring data . We will be looking at tables, summary statistics and graphs in order to learn how to extract information from the statistical indicators. Statistical inference , or the process of drawing defensible conclusions about populations from samples.
How data are organized A  data matrix  is an array of row and columns that stores the value of data.
Data Matrix
Data Matrix
Data Matrix
Remember, four data types Nominal : Variable values are unordered names or labels (Ethnicity, gender, country of origin)‏ Ordinal : Variable values are labels having an implicit but unspecified or measured order. Numbers may be assigned to categories to show ordering or ranking, but strictly speaking, mathematical operations are inappropriate.  (Example: Scale of ideology)‏
Remember, four data types Interval: Numbers are assigned to objects such that interval differences are constant across the scacle, but there is no true or meaningful zero point.(Examples: temperature, intelligence scores)‏ Ratio: In addition to having the properties of interval variables, these scales have a meaningful zero value. (Example: income, percentage of the population with a high school education)‏
 
Frequency Distributions Frequency distributions describe the relative frequencies of each value or a variable.  Typically, these frequencies are expressed as proportions or percentages of the data.
Frequency Distribution
 
Probability Probability is the likelihood that in the long run an observation will have a specific characteristic or an event will occur. Probabilities must meet two requirements: They must lie between 0 and 1.0 For a random process the sum of the probabilities of all the individual outcomes must equal 1.0
Odds Odds refer to the extent or degree to which one response, event or characteristic exceeds another response, event or characteristic.  Odds are expressed as ratios. Ex: 2004 NES question about law prohibiting late-term or partial birth abortions:  715 favor such as la, 417 oppose it. The law is favored by a ratio of 1.7 to 1

Stats Intro Ps 372

  • 1.
    Statistics: An IntroductionAndrew Martin PS 372 Fall 2009
  • 2.
    We will examine… Methods for describing and exploring data . We will be looking at tables, summary statistics and graphs in order to learn how to extract information from the statistical indicators. Statistical inference , or the process of drawing defensible conclusions about populations from samples.
  • 3.
    How data areorganized A data matrix is an array of row and columns that stores the value of data.
  • 4.
  • 5.
  • 6.
  • 7.
    Remember, four datatypes Nominal : Variable values are unordered names or labels (Ethnicity, gender, country of origin)‏ Ordinal : Variable values are labels having an implicit but unspecified or measured order. Numbers may be assigned to categories to show ordering or ranking, but strictly speaking, mathematical operations are inappropriate. (Example: Scale of ideology)‏
  • 8.
    Remember, four datatypes Interval: Numbers are assigned to objects such that interval differences are constant across the scacle, but there is no true or meaningful zero point.(Examples: temperature, intelligence scores)‏ Ratio: In addition to having the properties of interval variables, these scales have a meaningful zero value. (Example: income, percentage of the population with a high school education)‏
  • 9.
  • 10.
    Frequency Distributions Frequencydistributions describe the relative frequencies of each value or a variable. Typically, these frequencies are expressed as proportions or percentages of the data.
  • 11.
  • 12.
  • 13.
    Probability Probability isthe likelihood that in the long run an observation will have a specific characteristic or an event will occur. Probabilities must meet two requirements: They must lie between 0 and 1.0 For a random process the sum of the probabilities of all the individual outcomes must equal 1.0
  • 14.
    Odds Odds referto the extent or degree to which one response, event or characteristic exceeds another response, event or characteristic. Odds are expressed as ratios. Ex: 2004 NES question about law prohibiting late-term or partial birth abortions: 715 favor such as la, 417 oppose it. The law is favored by a ratio of 1.7 to 1