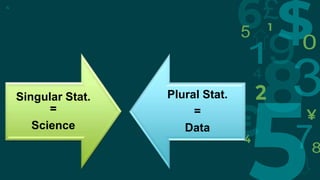
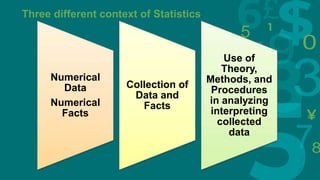
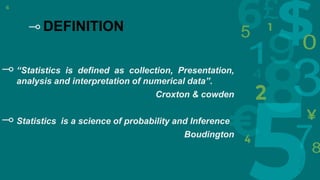
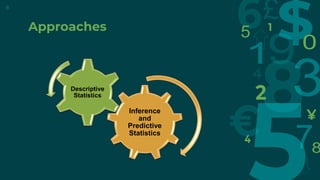
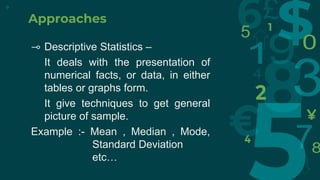
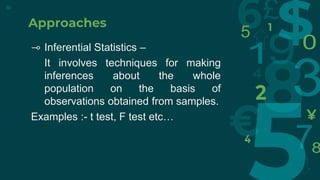
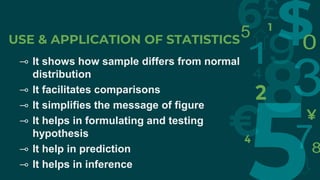
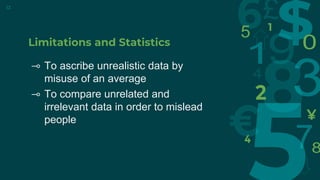
Introduction to
Statistics
By
Dr. Minalba B. Jadeja
M.Sc. M.Ed. M.Phil. Ph.D. NET, GSET
2
⊸ The word statistics conveys a variety of meaning to people in
different walks of life.
⊸ The word statistics comes from the Italian words
Statista = "statesman"
Or
⊸ Latin Word ‘Status’ = State
Or
⊸ The German word Statistik = "Collection of data involving the
State"
INTRODUCTION
⊸ The word Statistics today refers to :
⊸ either quantitative information or a method of dealing
with quantitative or qualitative information.
⊸ Statistical Science or Statistics
3
4
Singular Stat.
=
Science
Plural Stat.
=
Data
5
Three different context of Statistics
Numerical
Data
Numerical
Facts
Collection of
Data and
Facts
Use of
Theory,
Methods, and
Procedures
in analyzing
interpreting
collected
data
6
⊸ DEFINITION
⊸ “Statistics is defined as collection, Presentation,
analysis and interpretation of numerical data”.
Croxton & cowden
⊸ Statistics is a science of probability and Inference
Boudington
7
⊸ Statistics is a Science of
averages
⊸ Statistics is a science of
measurement in Social
Sciences
⊸ Statistics is the sciences and
art of dealing with figure and
facts.
Approaches
Inference
and
Predictive
Statistics
Descriptive
Statistics
8
Approaches
⊸ Descriptive Statistics –
It deals with the presentation of
numerical facts, or data, in either
tables or graphs form.
It give techniques to get general
picture of sample.
Example :- Mean , Median , Mode,
Standard Deviation
etc…
9
Approaches
⊸ Inferential Statistics –
It involves techniques for making
inferences about the whole
population on the basis of
observations obtained from samples.
Examples :- t test, F test etc…
10
USE & APPLICATION OF STATISTICS
⊸ It shows how sample differs from normal
distribution
⊸ It facilitates comparisons
⊸ It simplifies the message of figure
⊸ It helps in formulating and testing
hypothesis
⊸ It help in prediction
⊸ It helps in inference
Limitations and Statistics
⊸ To ascribe unrealistic data by
misuse of an average
⊸ To compare unrelated and
irrelevant data in order to mislead
people
12
Students marks out of 100
( passing marks 35) :-
Average :- 42
13
Roll No Marks
1 30
2 25
3 25
4 30
5 30
6 25
7 35
8 25
9 96
10 99
Actually 7 Students failed but for advertisement only
average will be presented
Limitations and Statistics
⊸ Students scores 99 marks out of
100
⊸ But the actual situation is differ
14
Limitations and Statistics
⊸ To commit an error of generalizing
the conclusion on the basis of small
samples
⊸ In the above mentioned example
the result of only brilliant class is
displayed for advertisement of the
school
15
Limitations and Statistics
⊸ To predict changes in two variables
without taking cognizance of causal
relationship between them
⊸ To mislead people by making
unnecessary and clumsy
presentation of statistical data
16
Thanks!
17

Introduction to statistics for social sciences 1

  • 1.
    Introduction to Statistics By Dr. MinalbaB. Jadeja M.Sc. M.Ed. M.Phil. Ph.D. NET, GSET
  • 2.
    2 ⊸ The wordstatistics conveys a variety of meaning to people in different walks of life. ⊸ The word statistics comes from the Italian words Statista = "statesman" Or ⊸ Latin Word ‘Status’ = State Or ⊸ The German word Statistik = "Collection of data involving the State" INTRODUCTION
  • 3.
    ⊸ The wordStatistics today refers to : ⊸ either quantitative information or a method of dealing with quantitative or qualitative information. ⊸ Statistical Science or Statistics 3
  • 4.
  • 5.
    5 Three different contextof Statistics Numerical Data Numerical Facts Collection of Data and Facts Use of Theory, Methods, and Procedures in analyzing interpreting collected data
  • 6.
    6 ⊸ DEFINITION ⊸ “Statisticsis defined as collection, Presentation, analysis and interpretation of numerical data”. Croxton & cowden ⊸ Statistics is a science of probability and Inference Boudington
  • 7.
    7 ⊸ Statistics isa Science of averages ⊸ Statistics is a science of measurement in Social Sciences ⊸ Statistics is the sciences and art of dealing with figure and facts.
  • 8.
  • 9.
    Approaches ⊸ Descriptive Statistics– It deals with the presentation of numerical facts, or data, in either tables or graphs form. It give techniques to get general picture of sample. Example :- Mean , Median , Mode, Standard Deviation etc… 9
  • 10.
    Approaches ⊸ Inferential Statistics– It involves techniques for making inferences about the whole population on the basis of observations obtained from samples. Examples :- t test, F test etc… 10
  • 11.
    USE & APPLICATIONOF STATISTICS ⊸ It shows how sample differs from normal distribution ⊸ It facilitates comparisons ⊸ It simplifies the message of figure ⊸ It helps in formulating and testing hypothesis ⊸ It help in prediction ⊸ It helps in inference
  • 12.
    Limitations and Statistics ⊸To ascribe unrealistic data by misuse of an average ⊸ To compare unrelated and irrelevant data in order to mislead people 12
  • 13.
    Students marks outof 100 ( passing marks 35) :- Average :- 42 13 Roll No Marks 1 30 2 25 3 25 4 30 5 30 6 25 7 35 8 25 9 96 10 99 Actually 7 Students failed but for advertisement only average will be presented
  • 14.
    Limitations and Statistics ⊸Students scores 99 marks out of 100 ⊸ But the actual situation is differ 14
  • 15.
    Limitations and Statistics ⊸To commit an error of generalizing the conclusion on the basis of small samples ⊸ In the above mentioned example the result of only brilliant class is displayed for advertisement of the school 15
  • 16.
    Limitations and Statistics ⊸To predict changes in two variables without taking cognizance of causal relationship between them ⊸ To mislead people by making unnecessary and clumsy presentation of statistical data 16
  • 17.

Editor's Notes

  • #3 Student :- subject Business men :- 5 star Politician :- trees 10000 Gruhini :- average