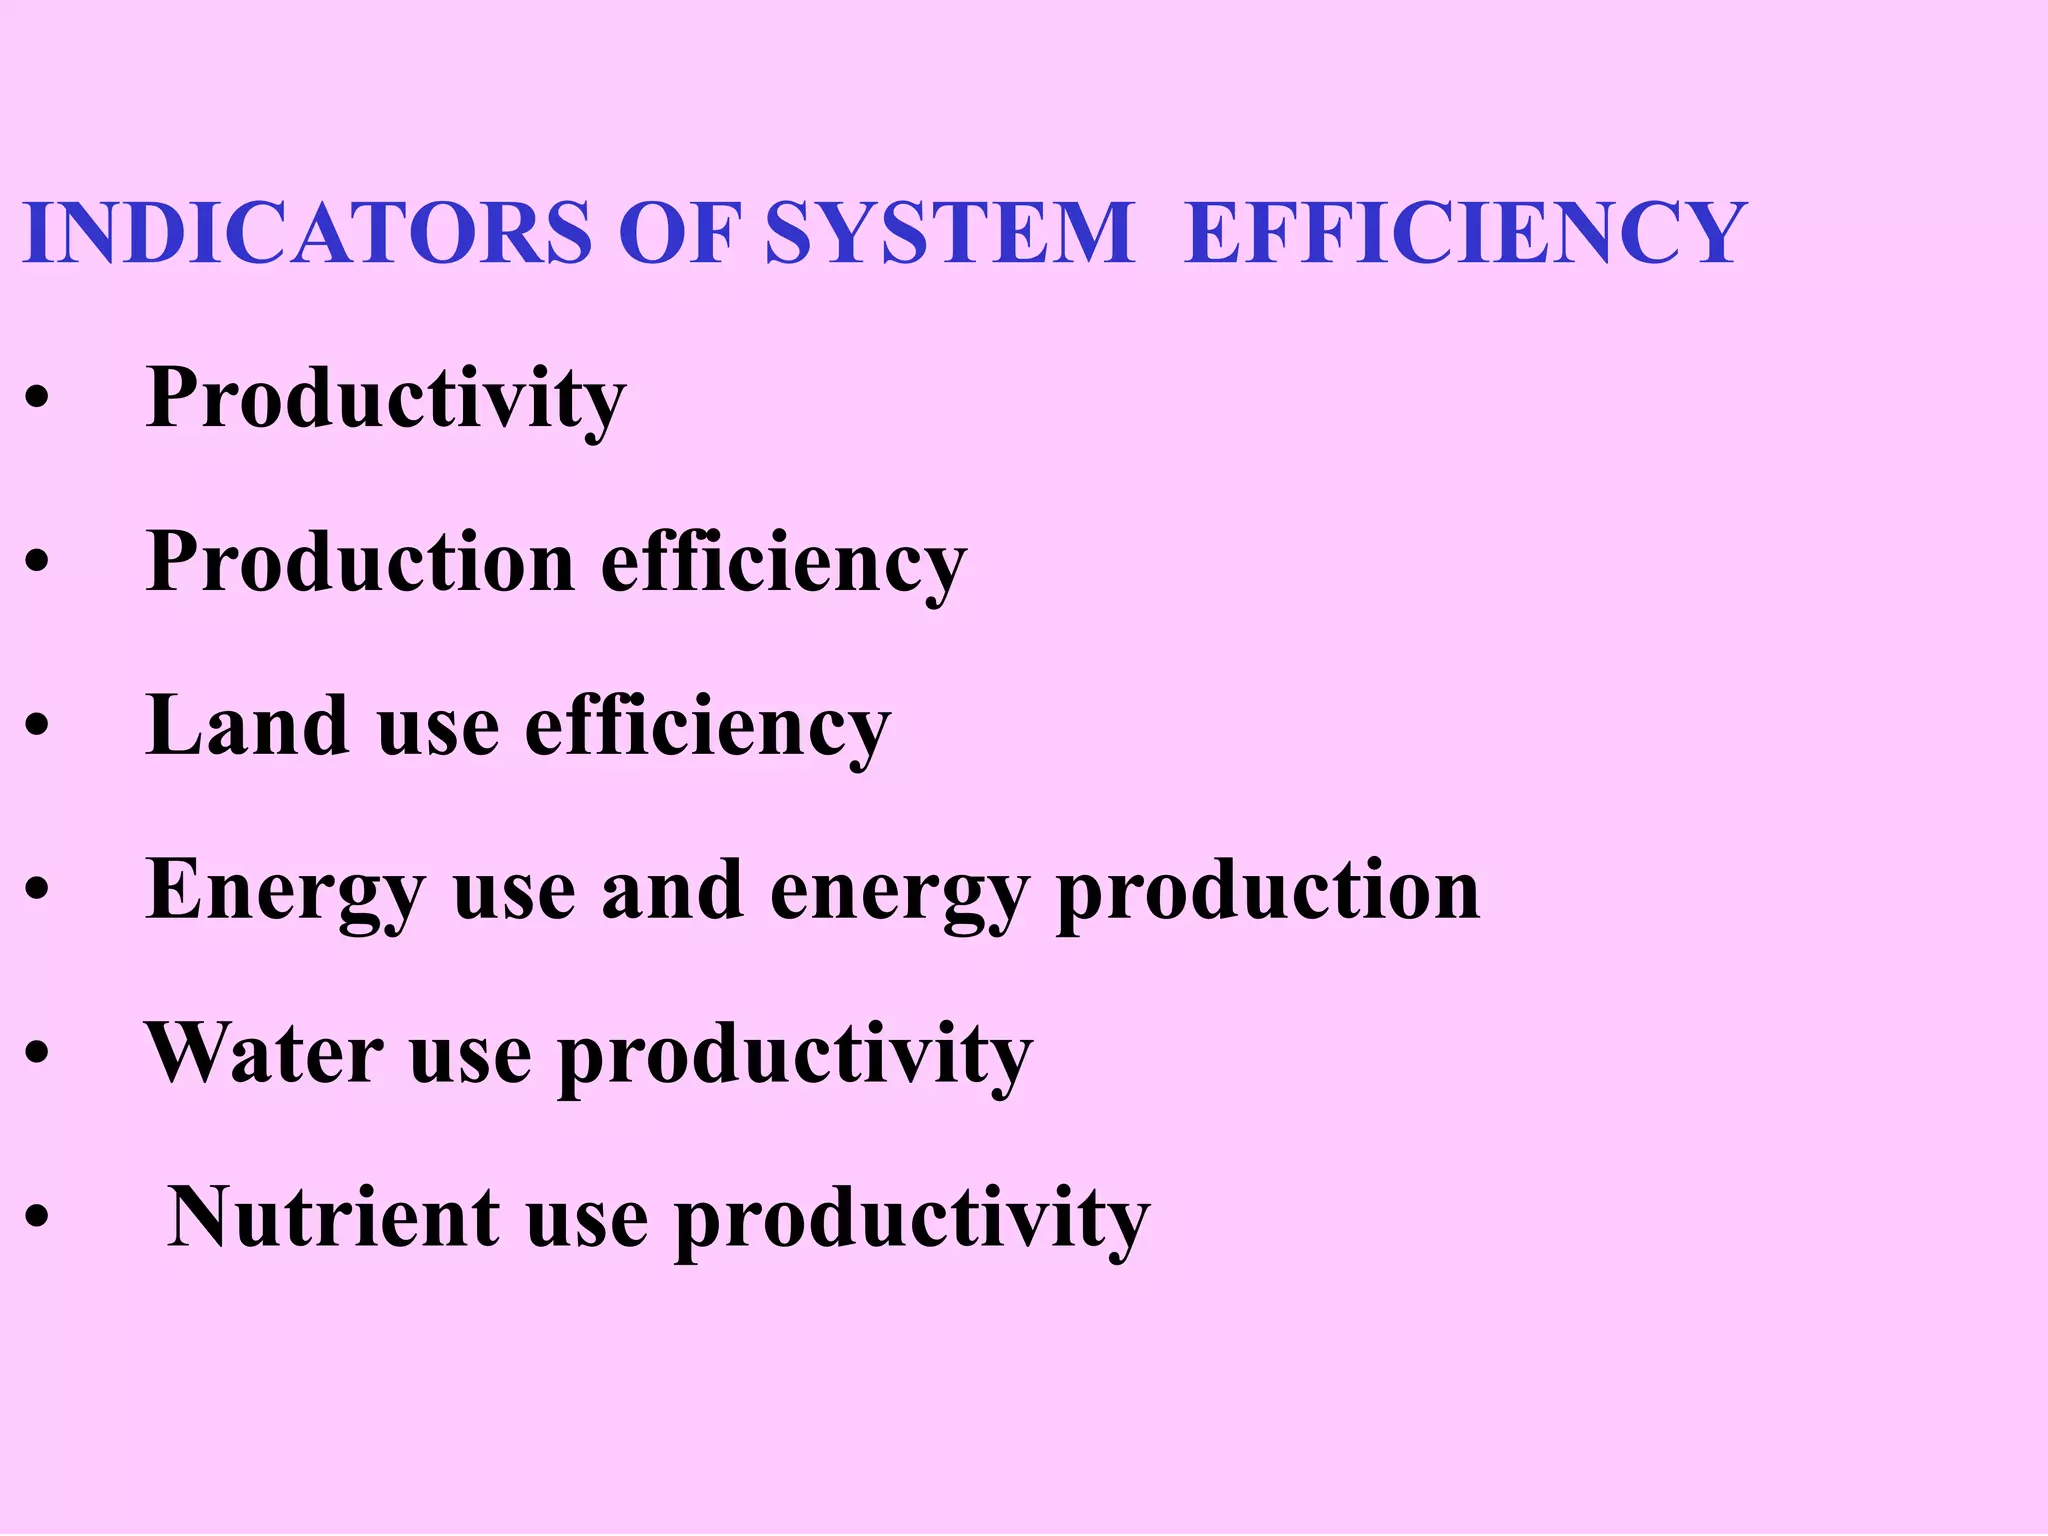
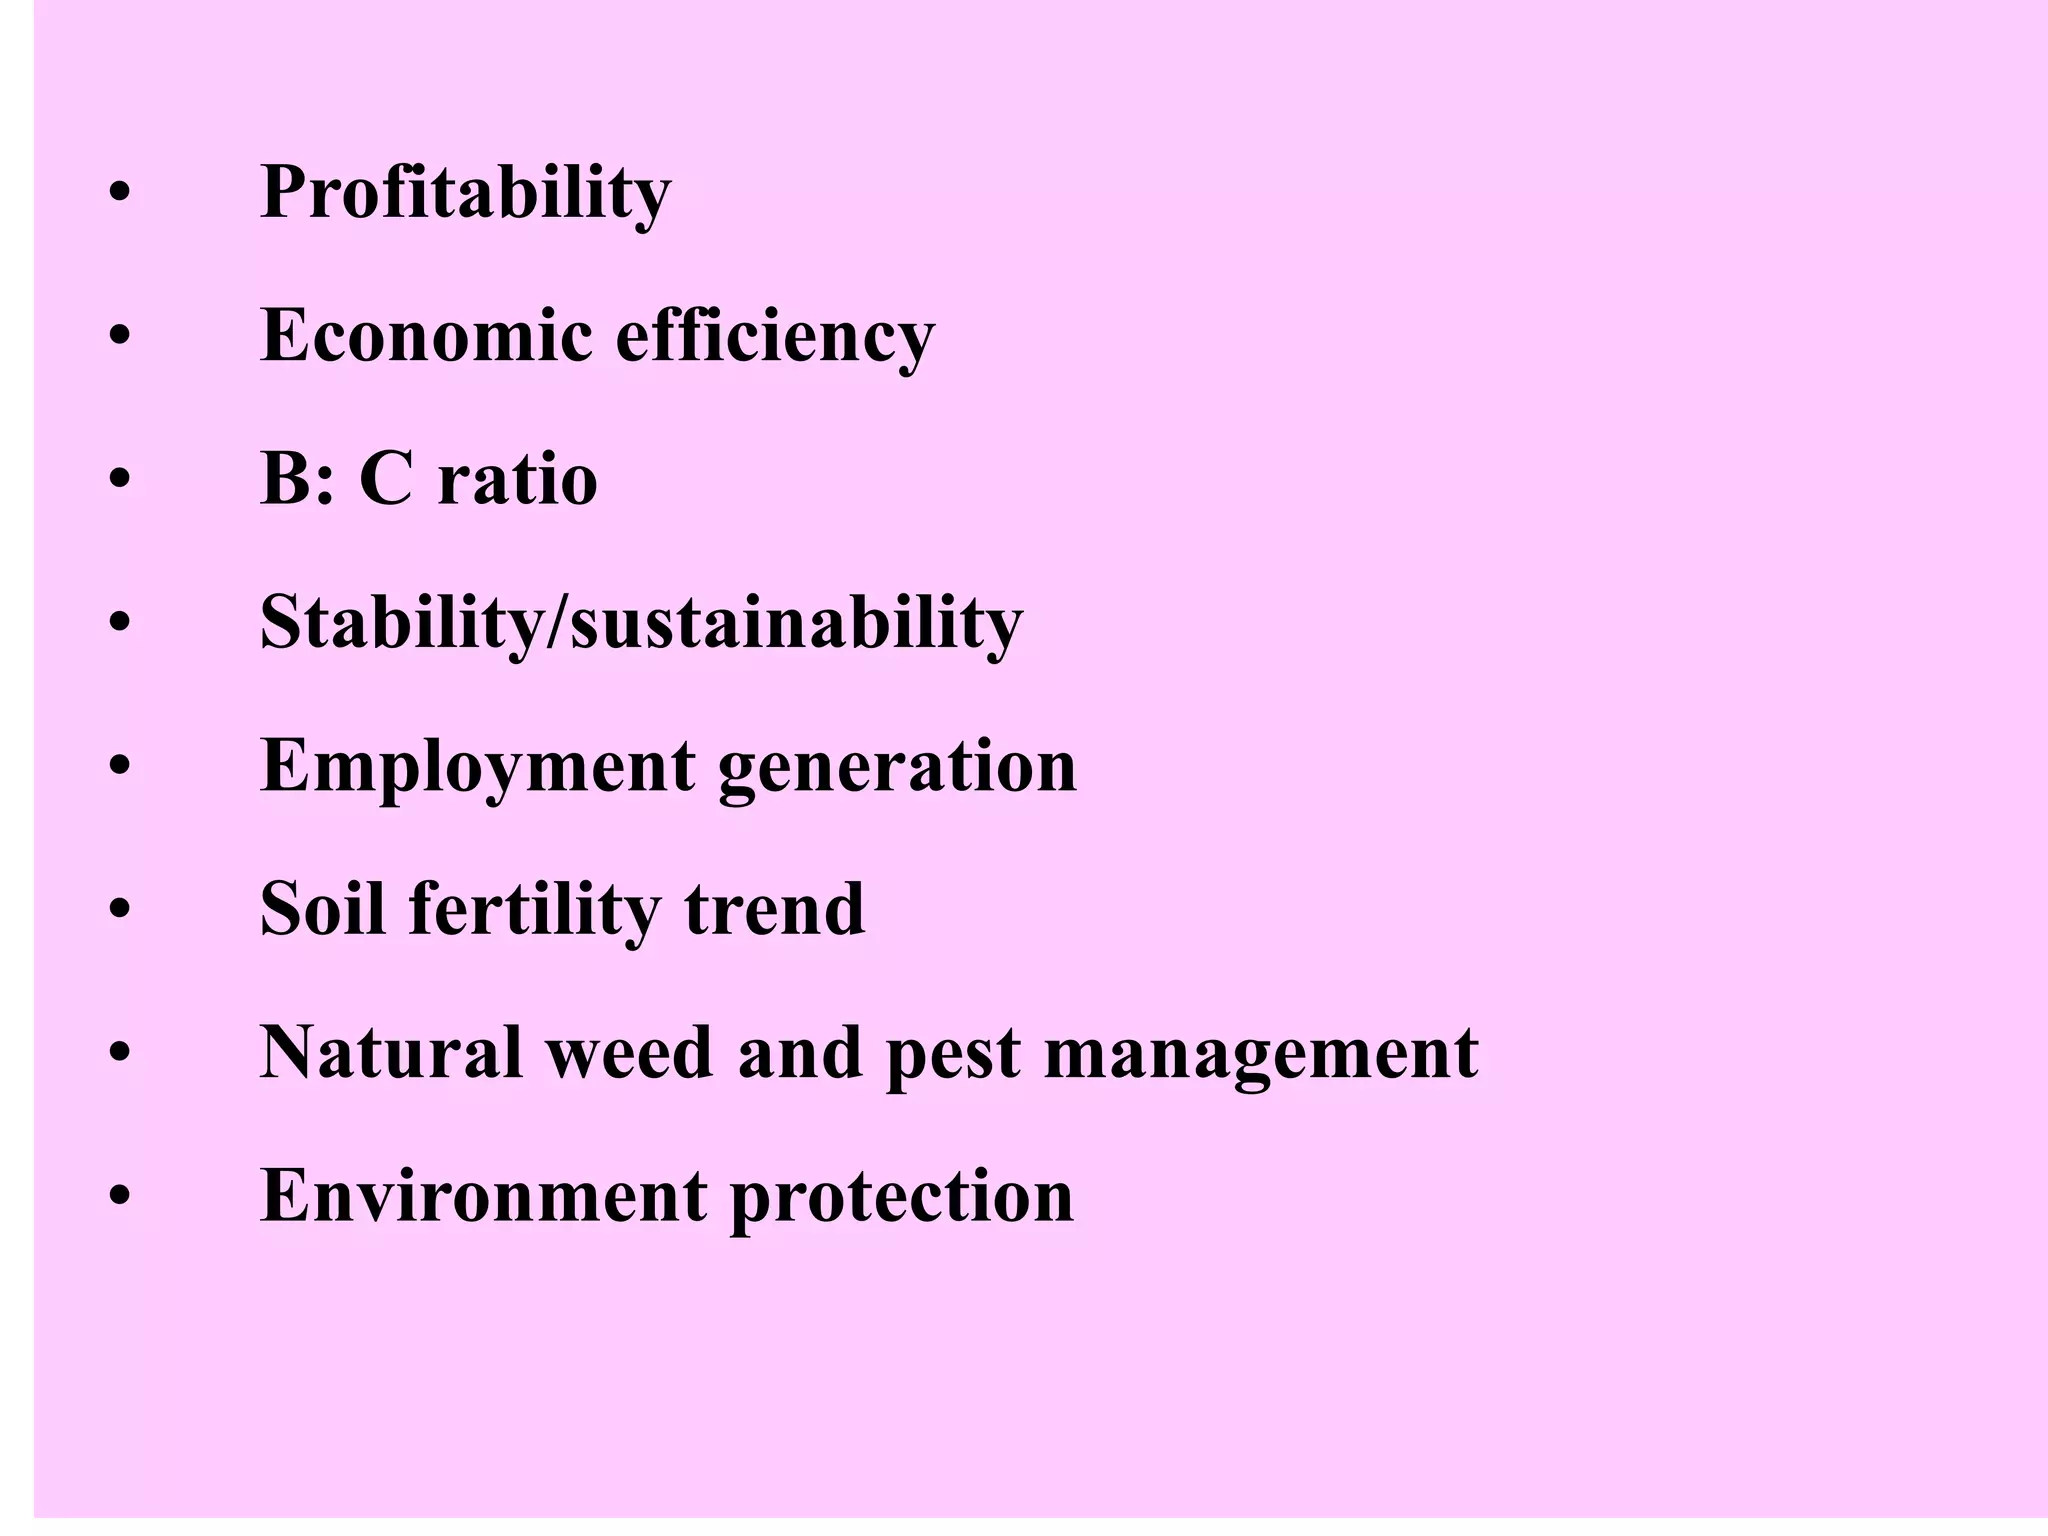
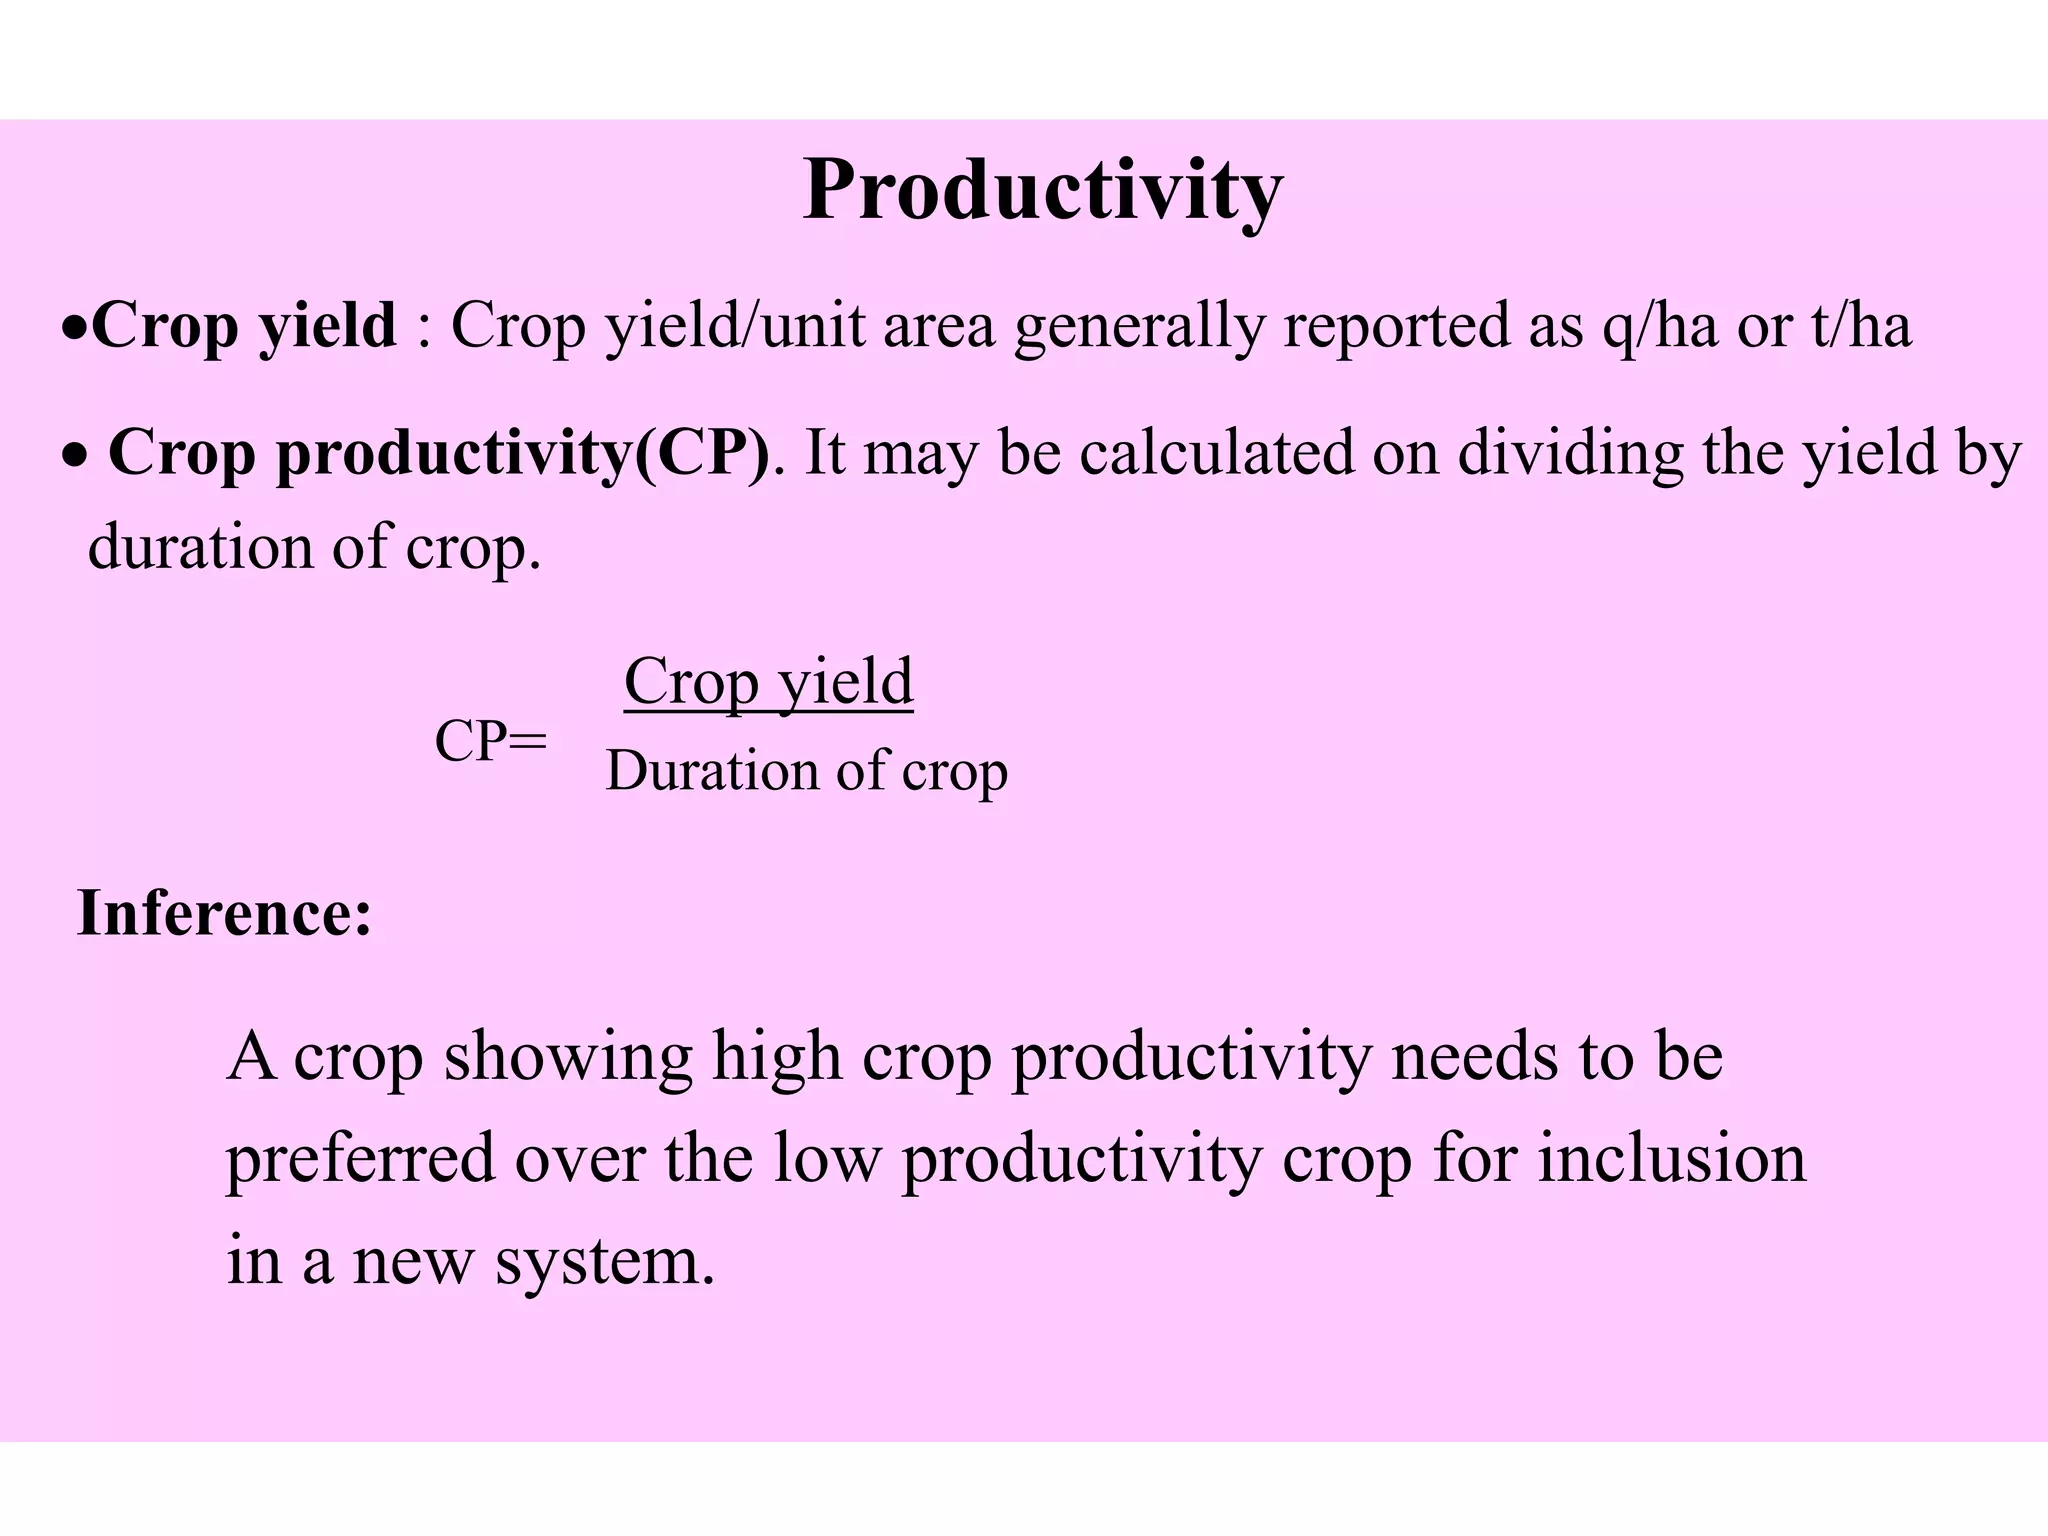
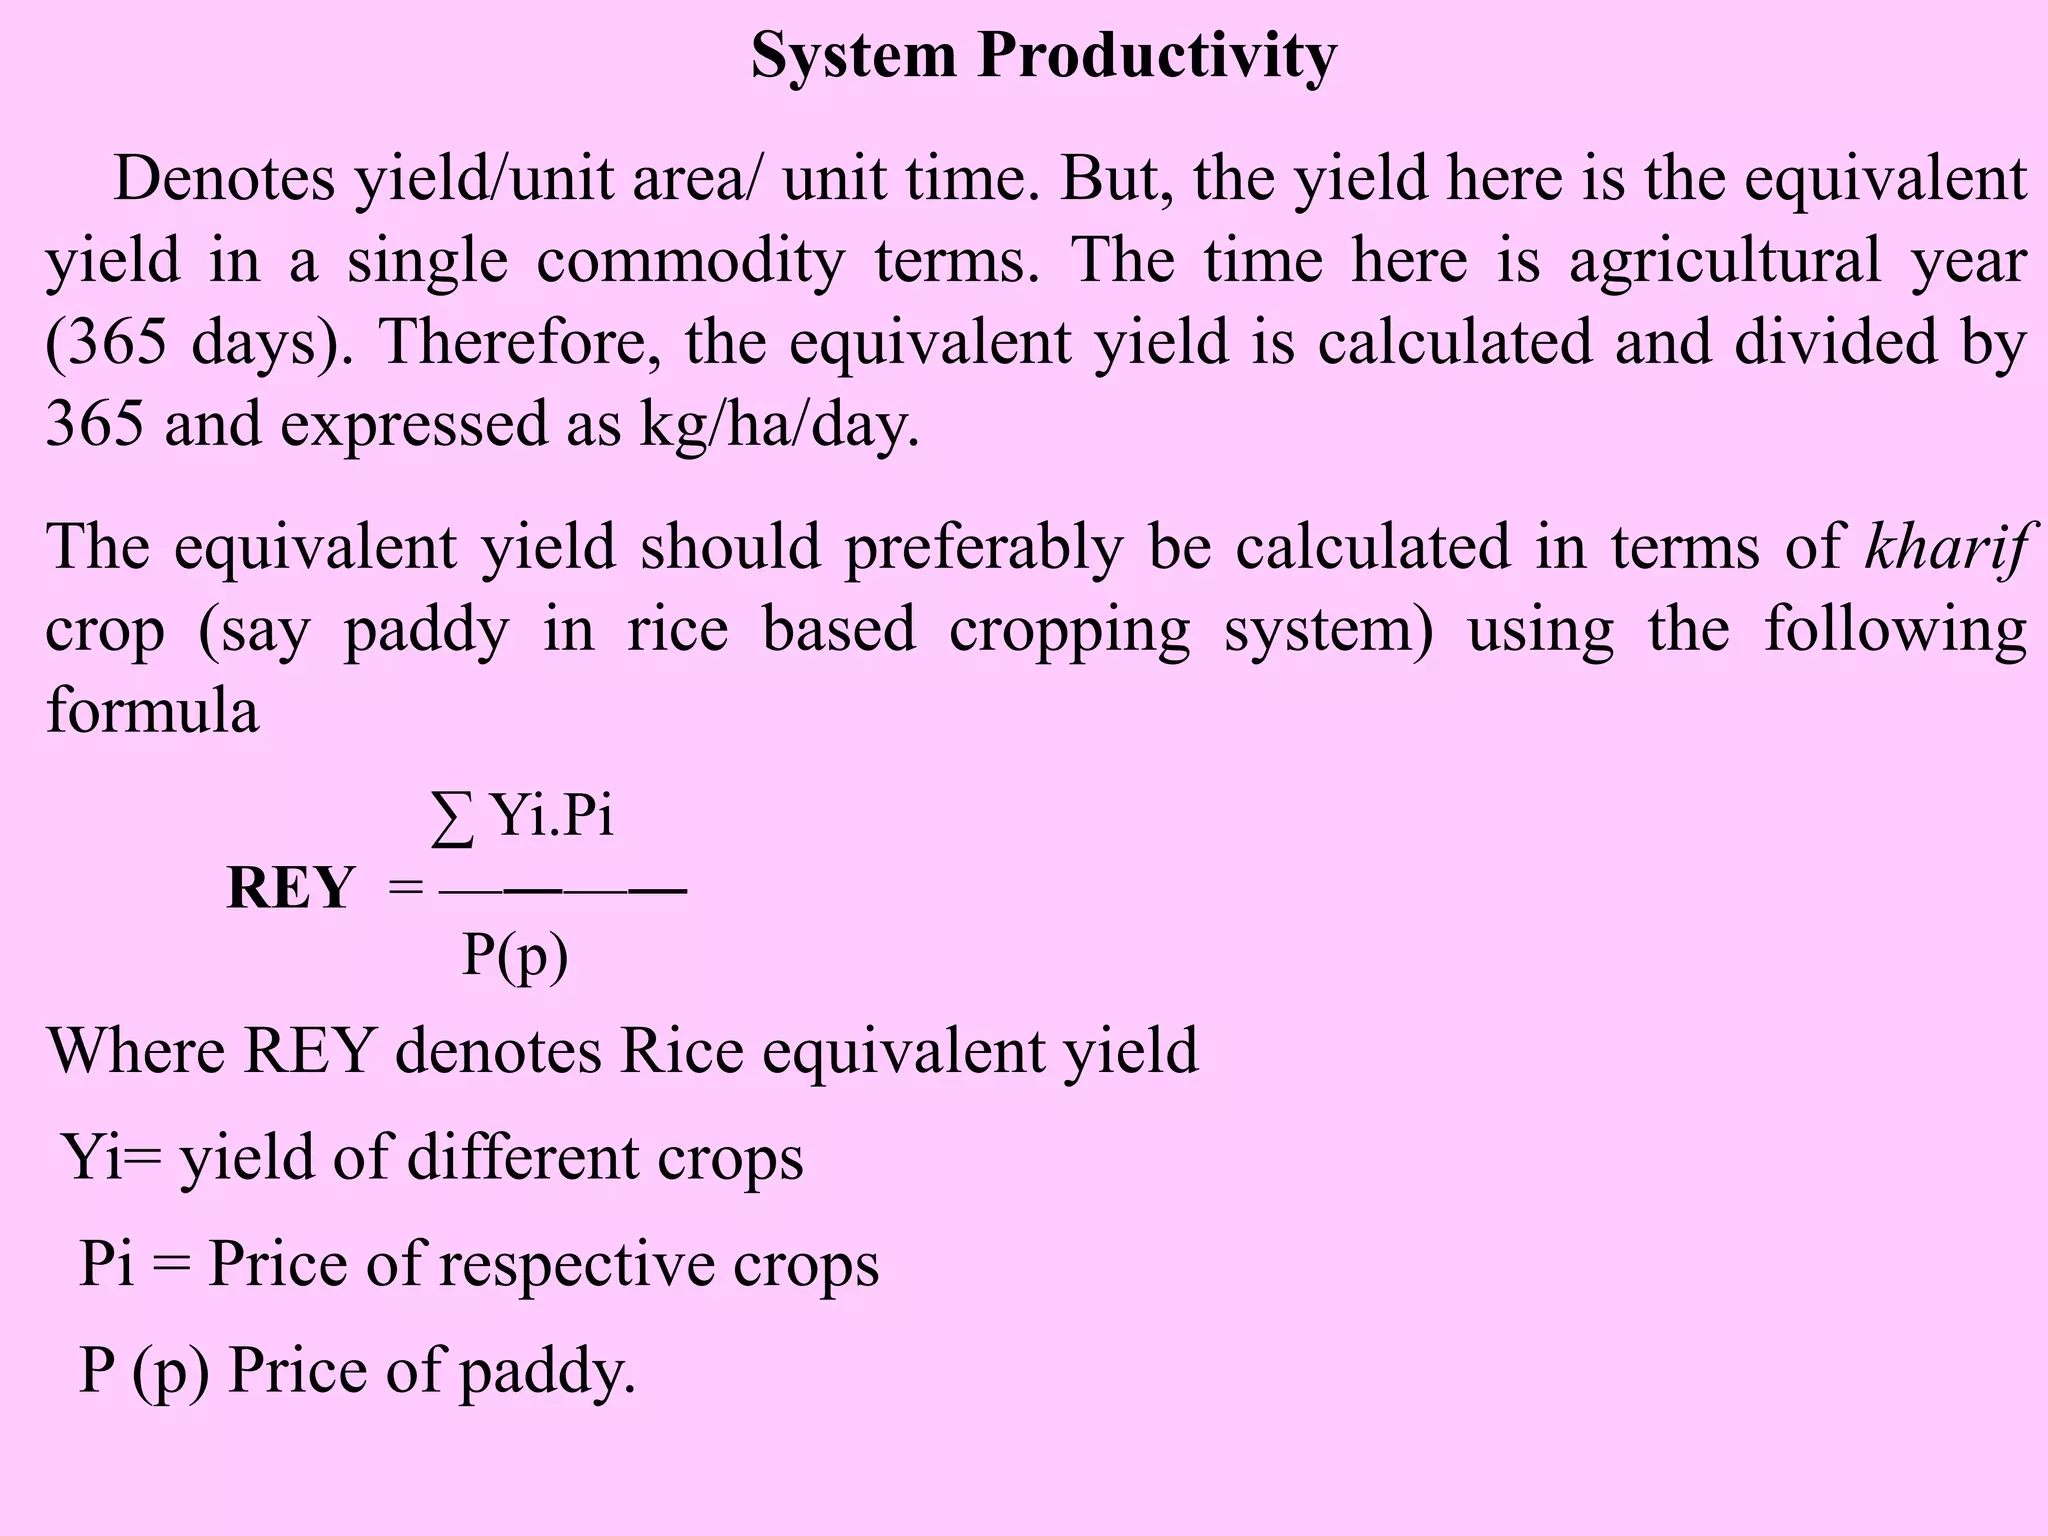
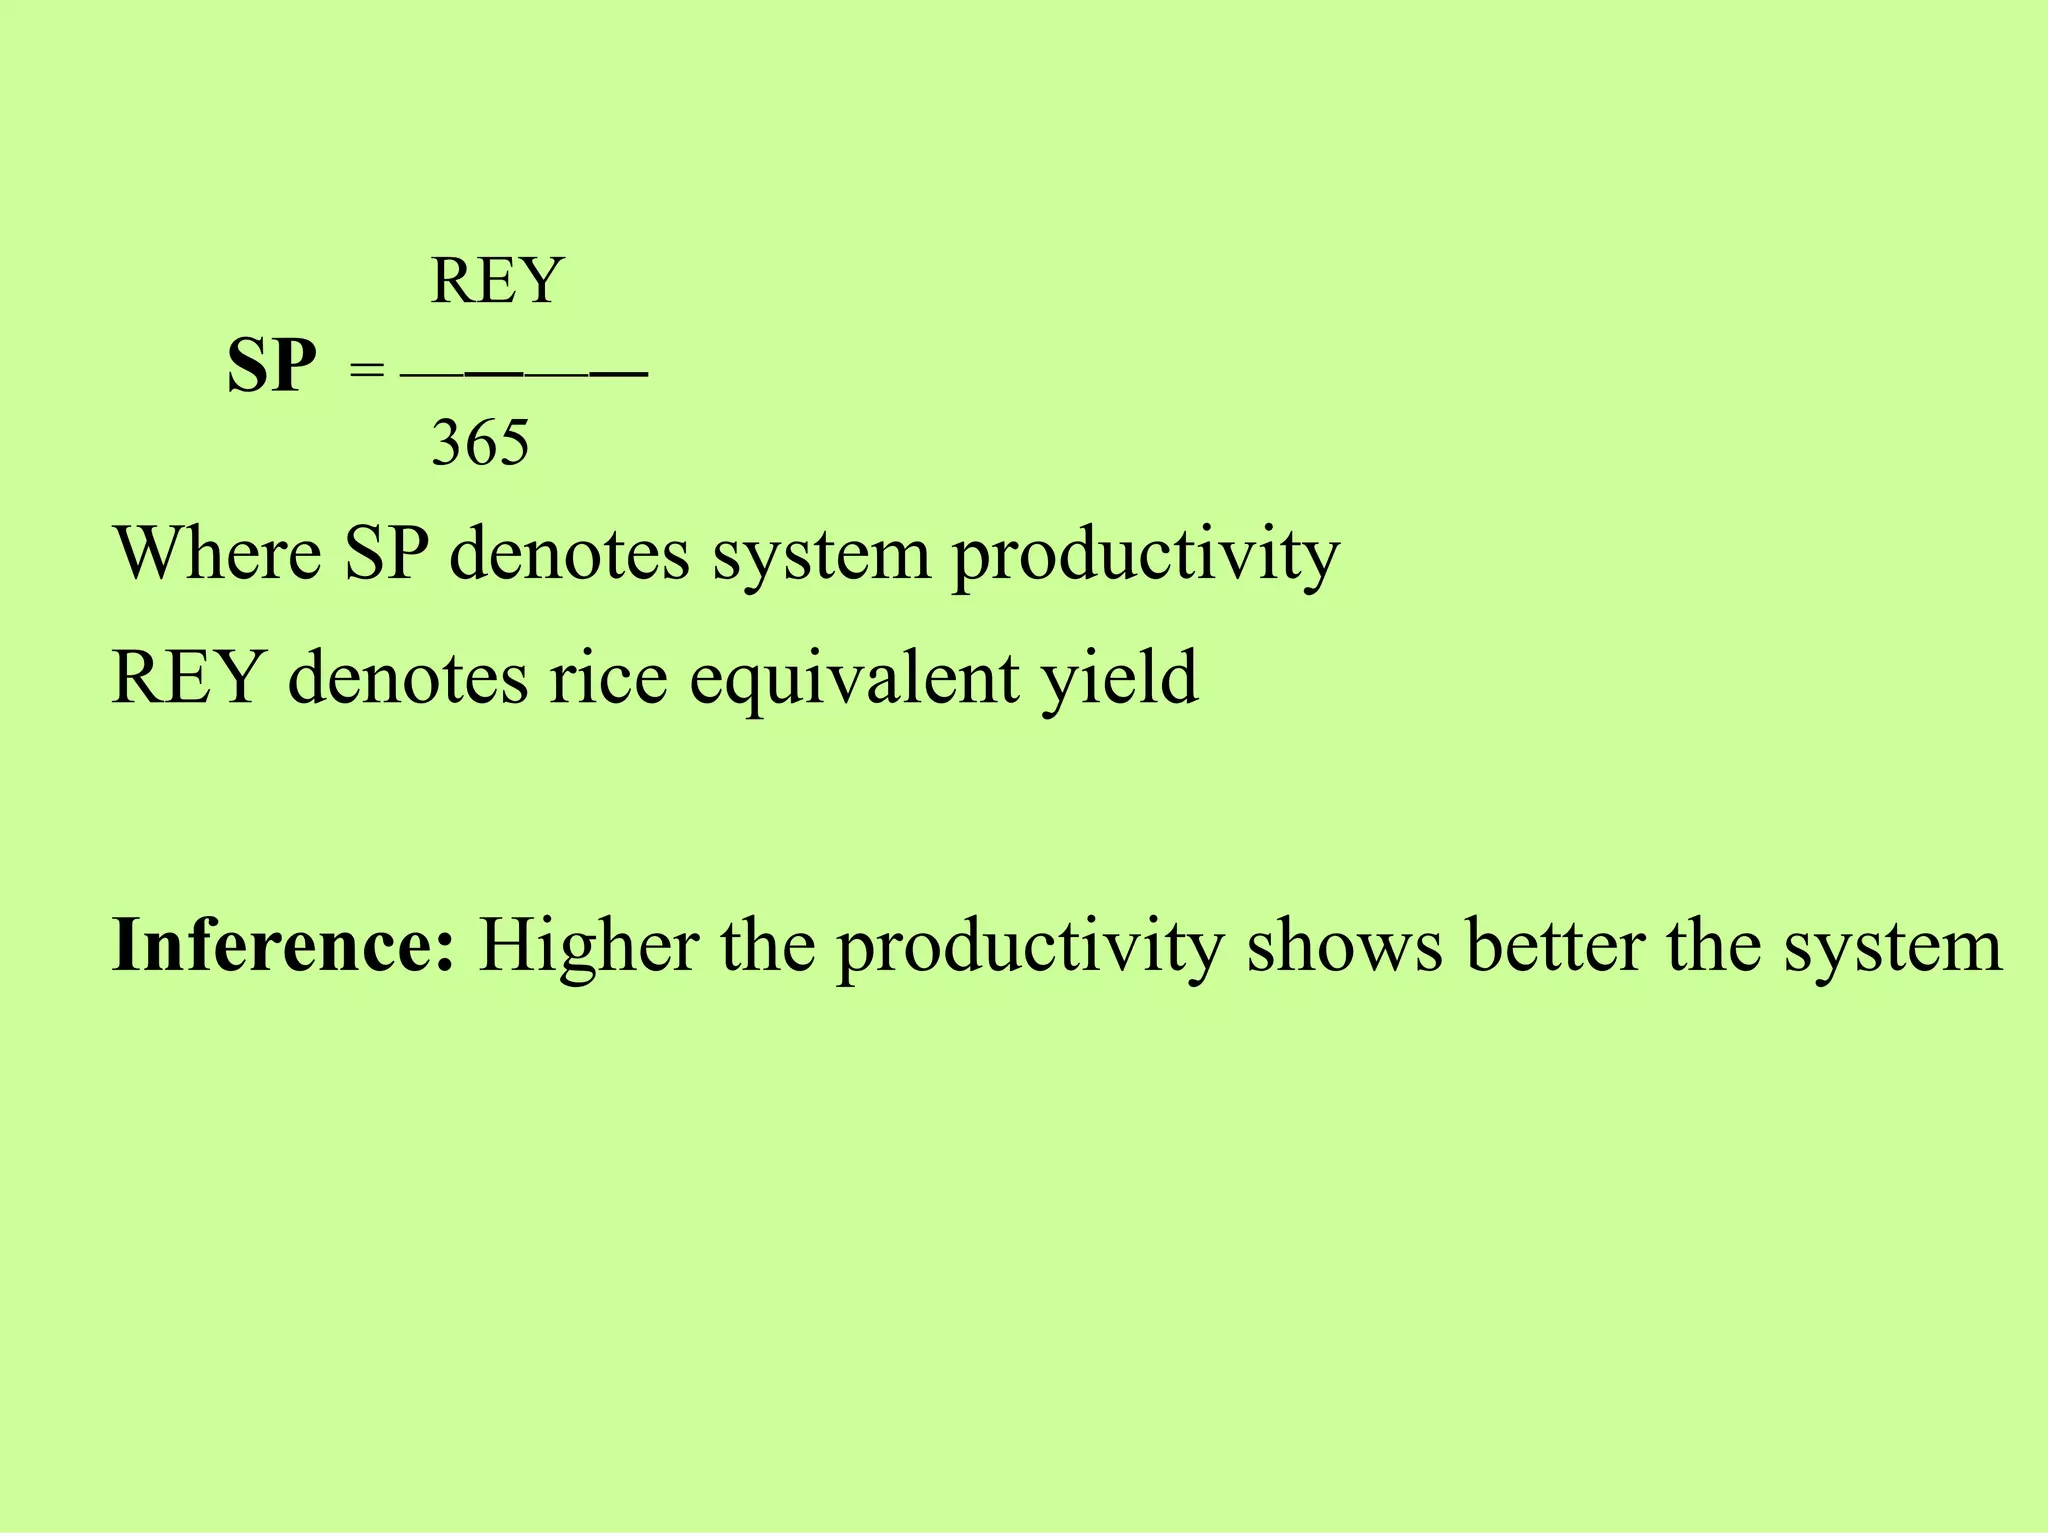
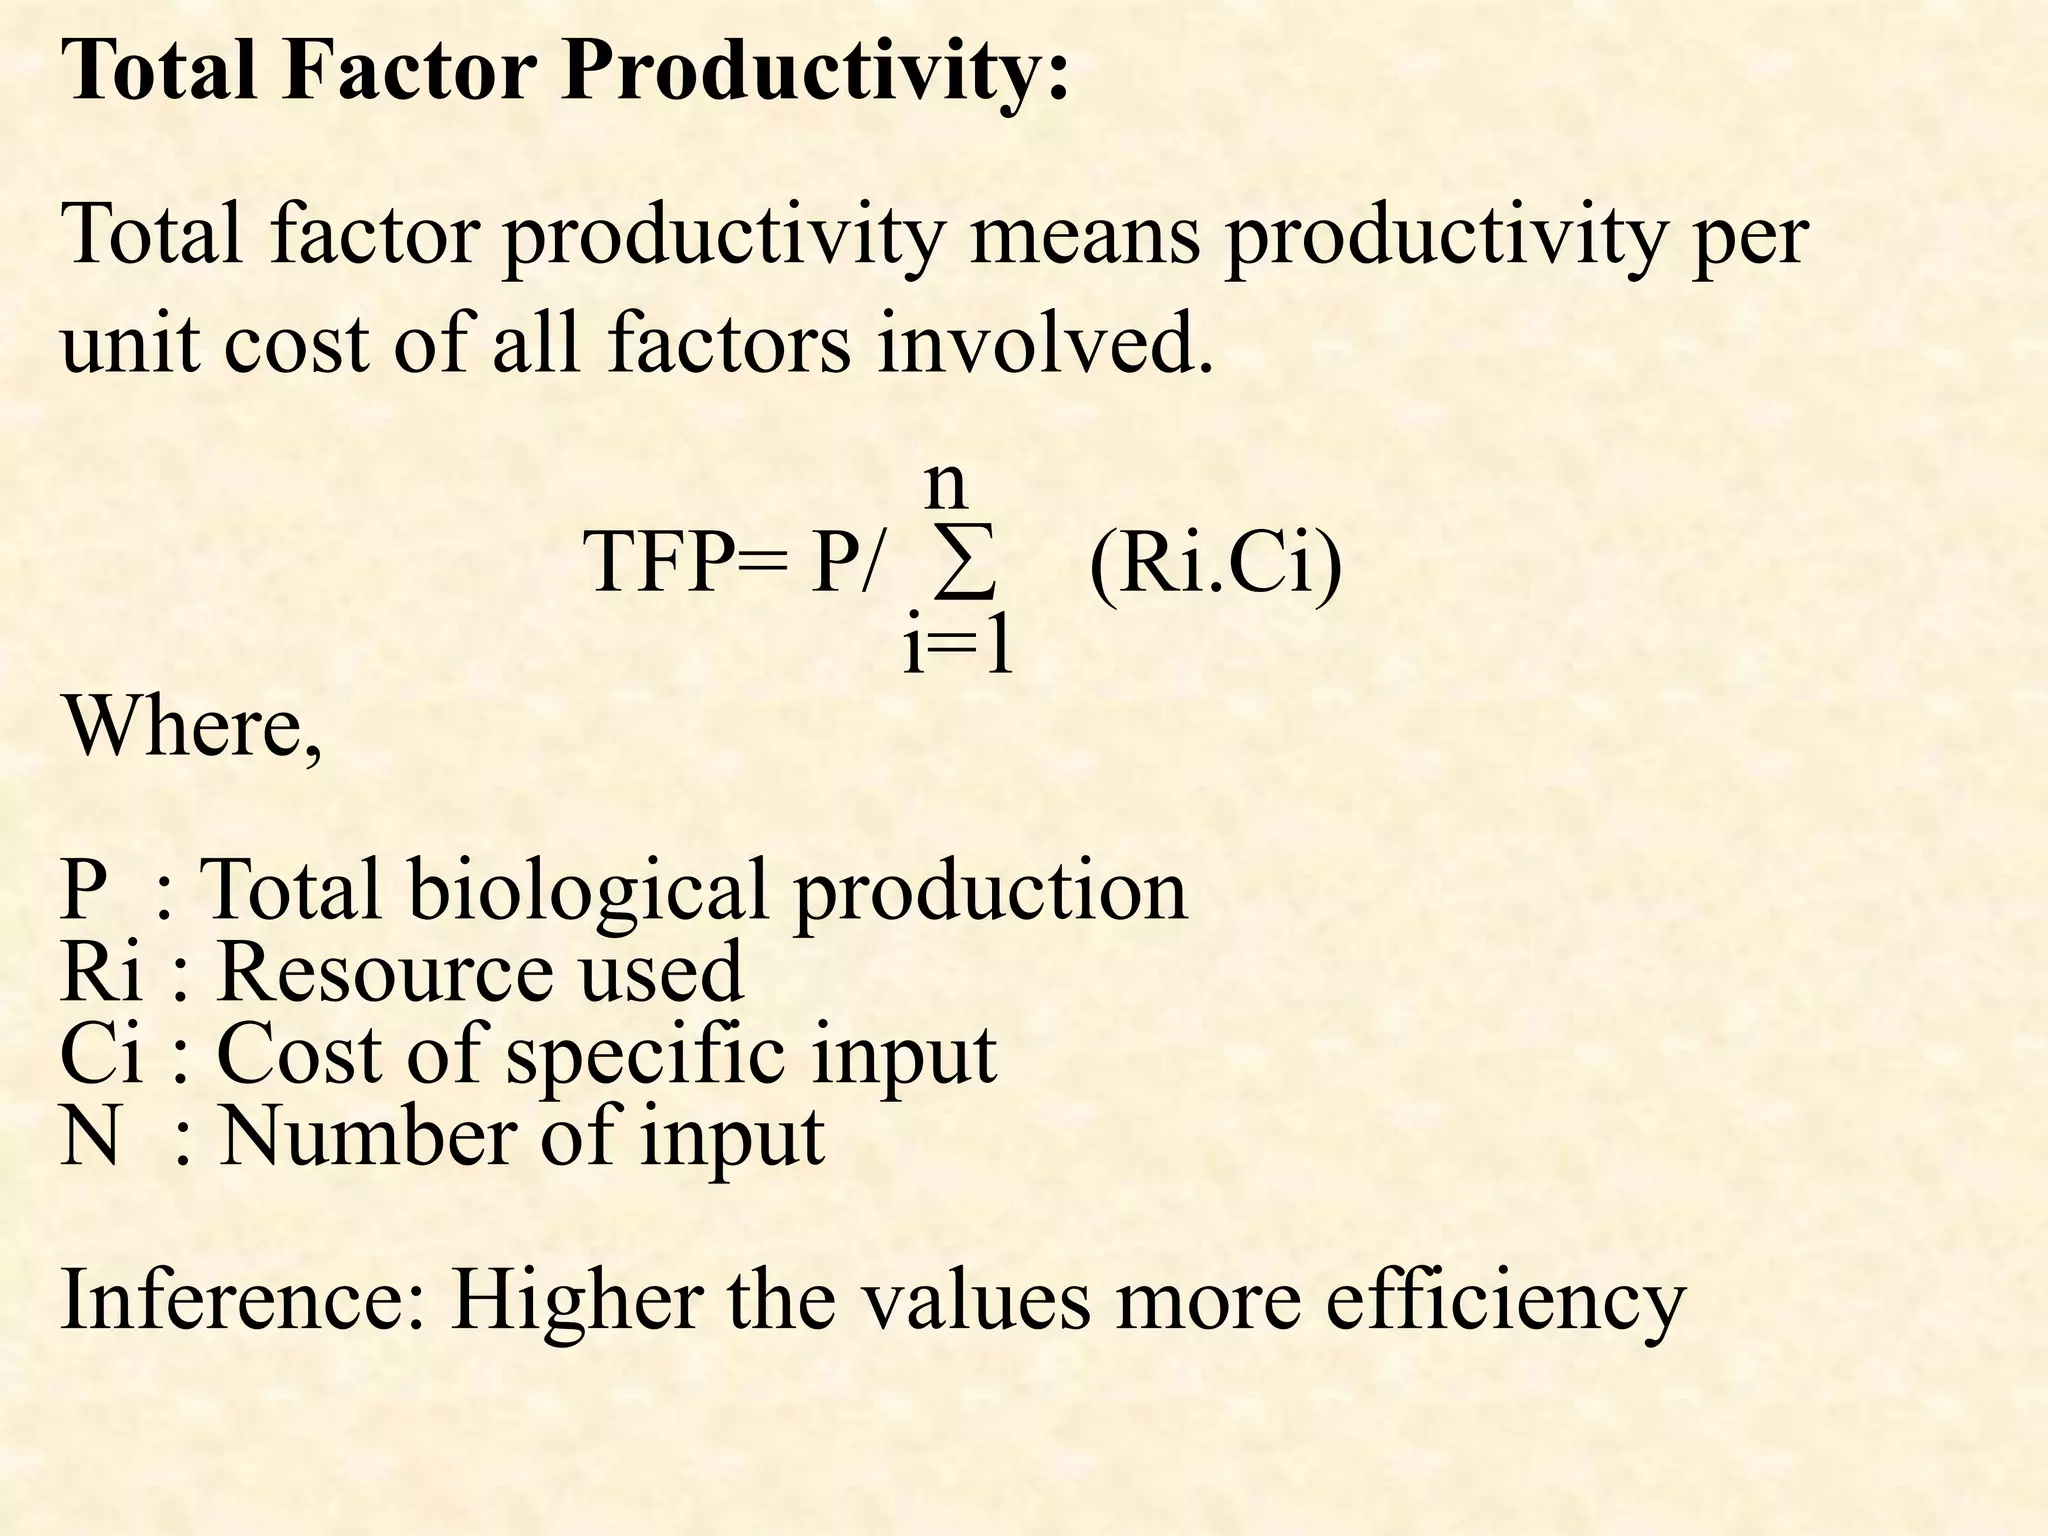
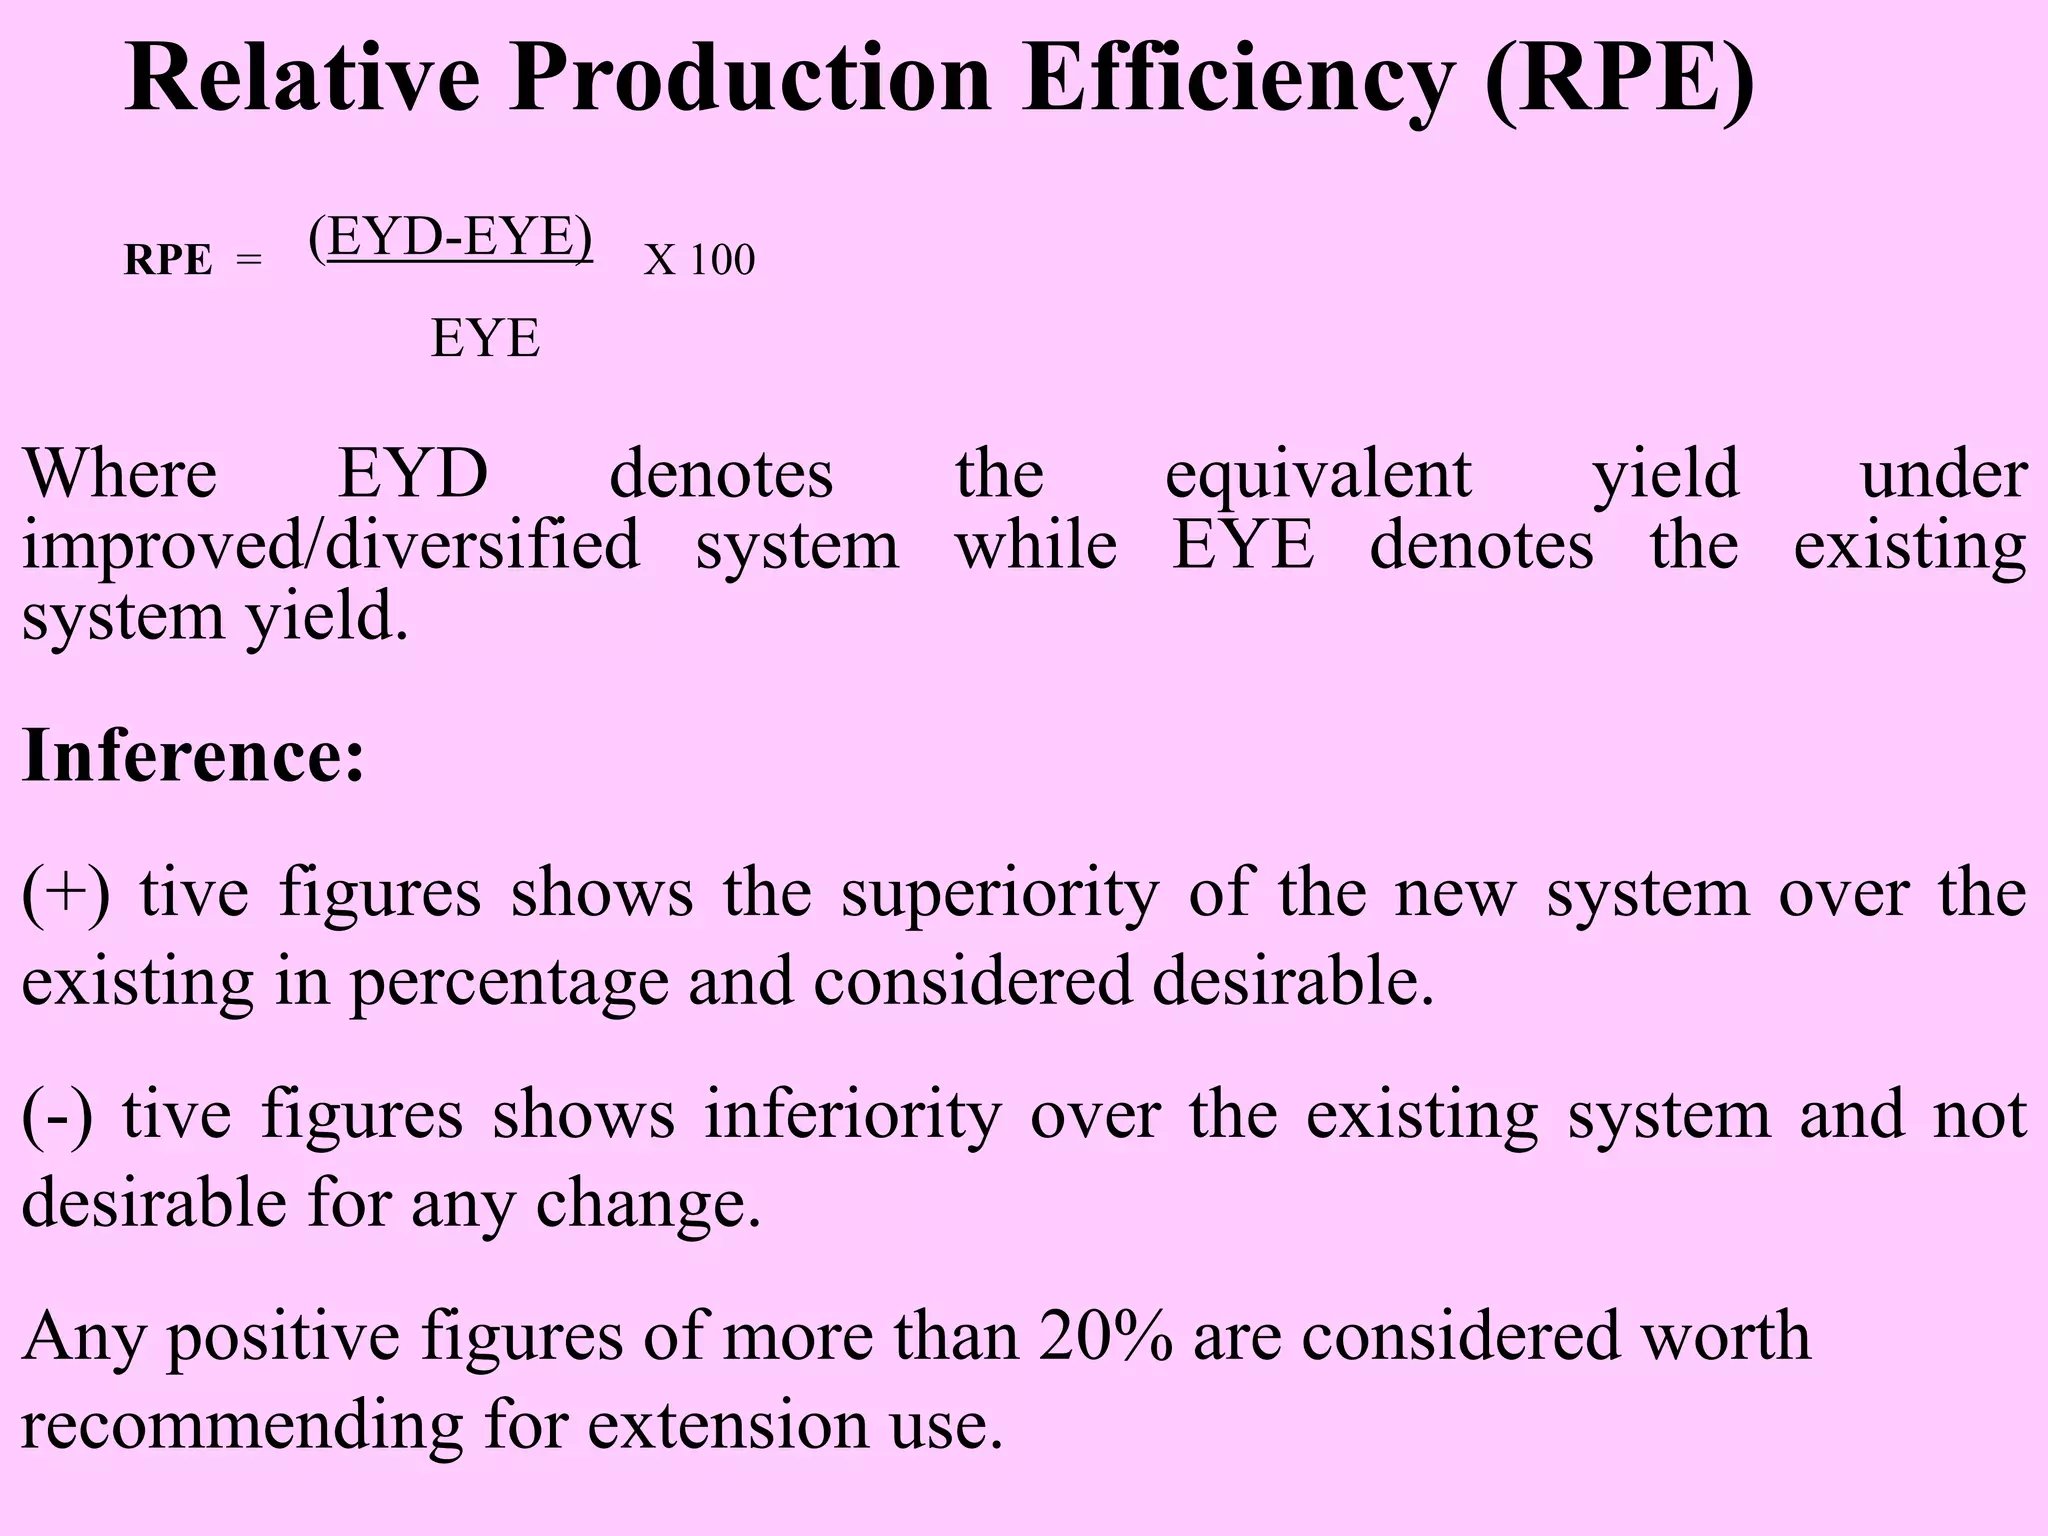
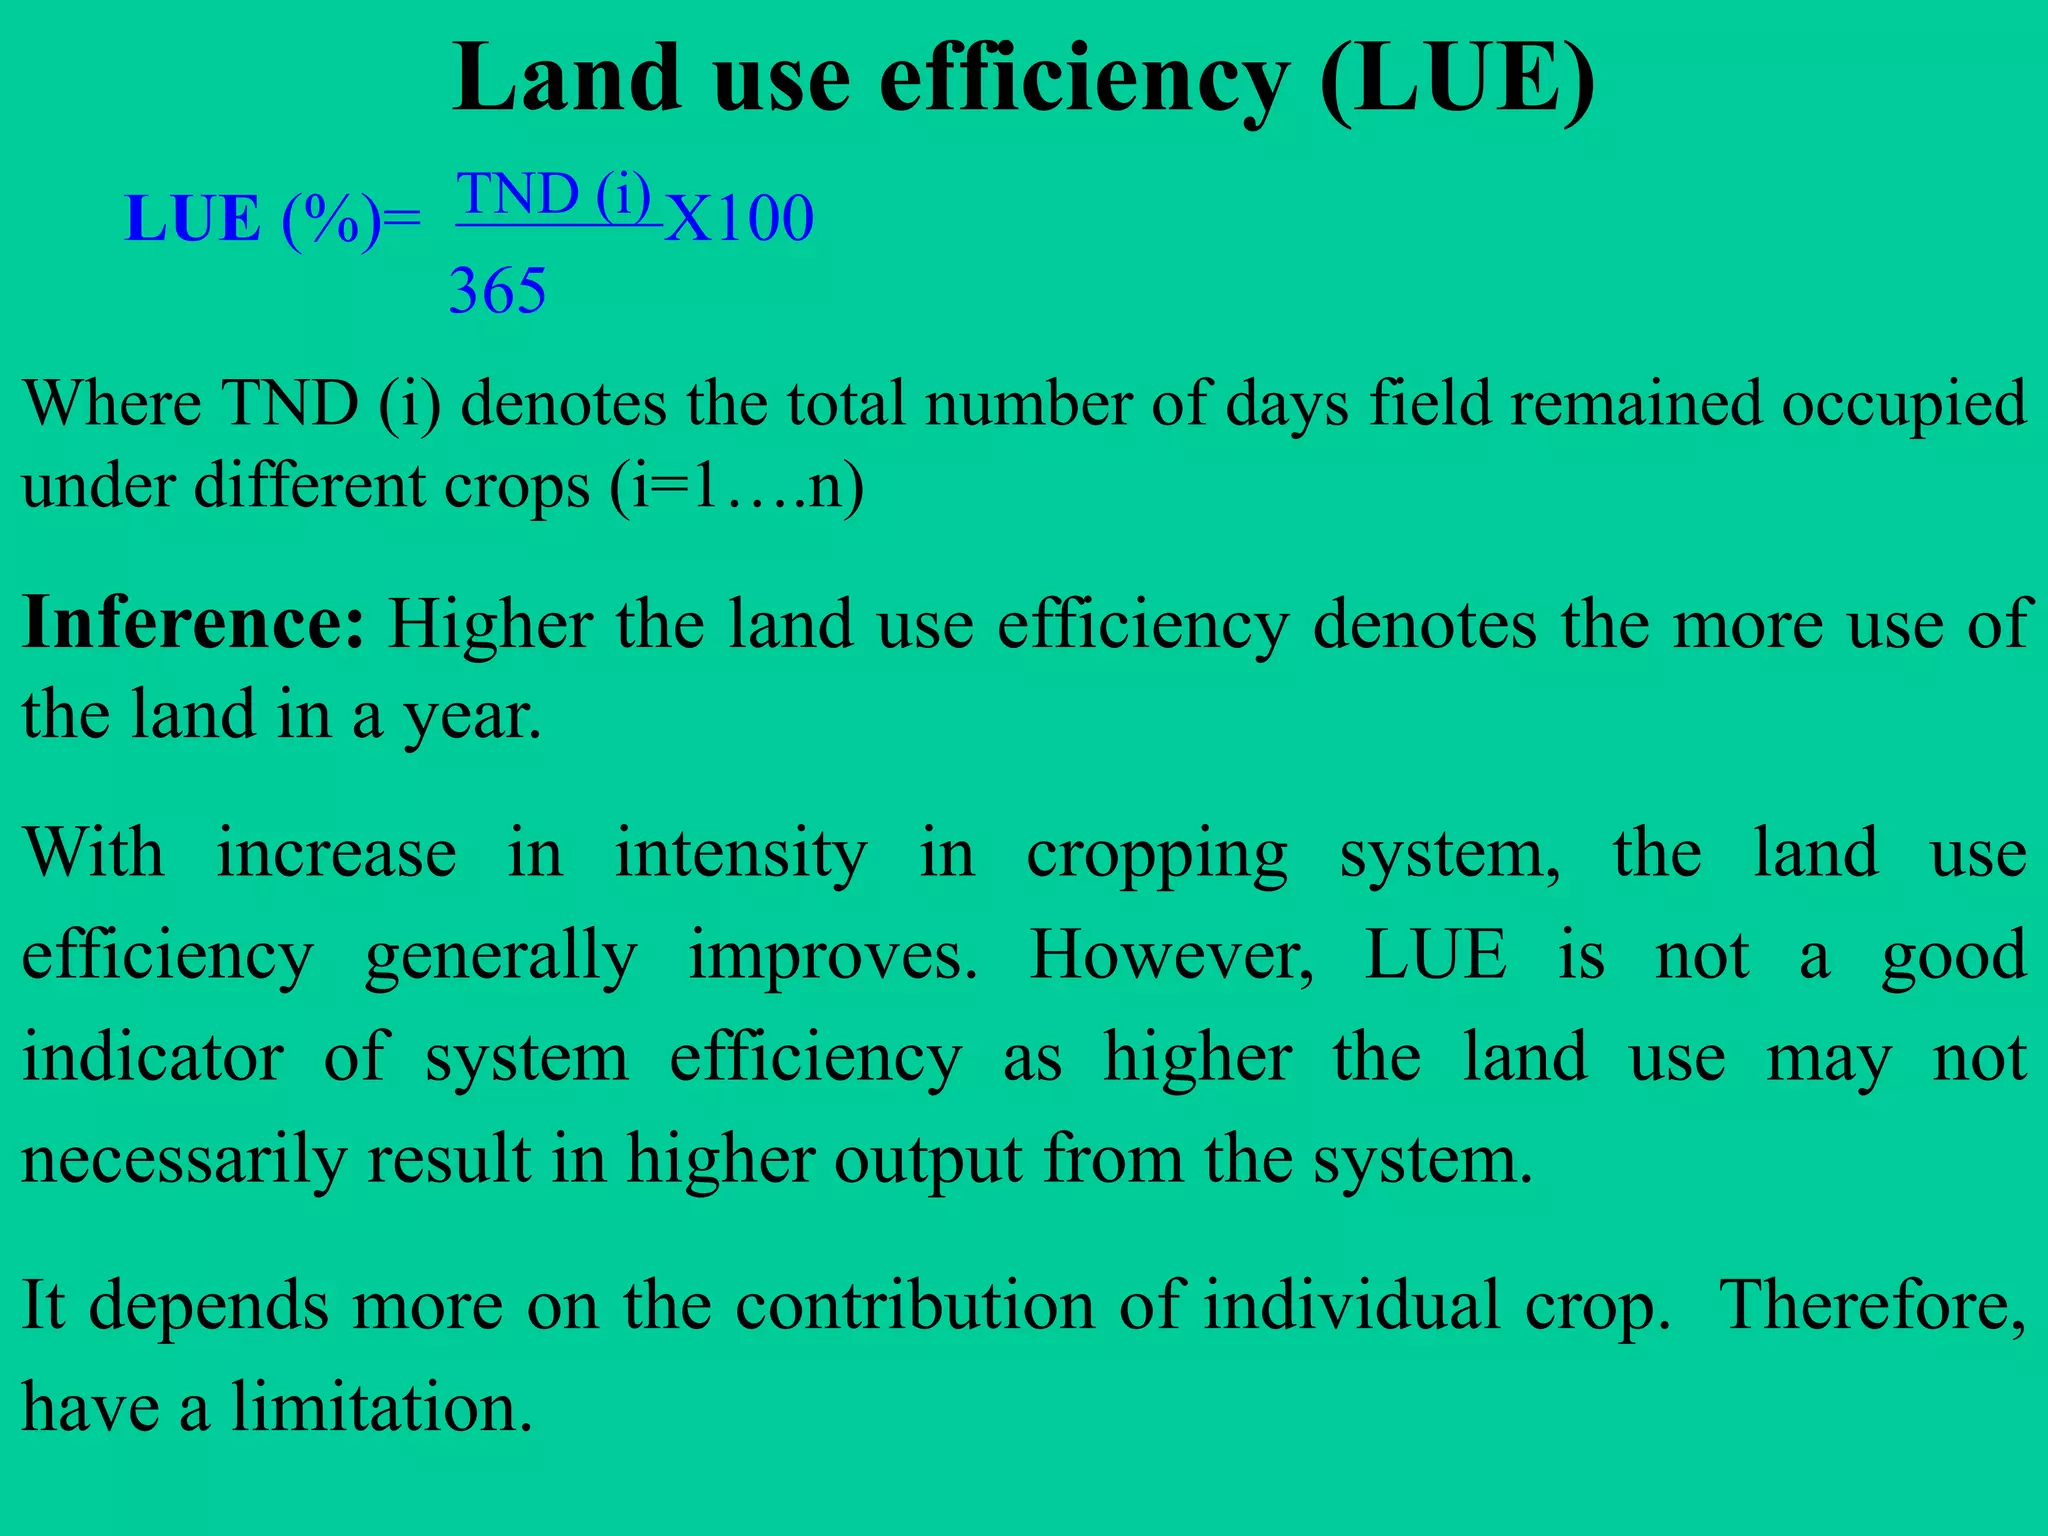
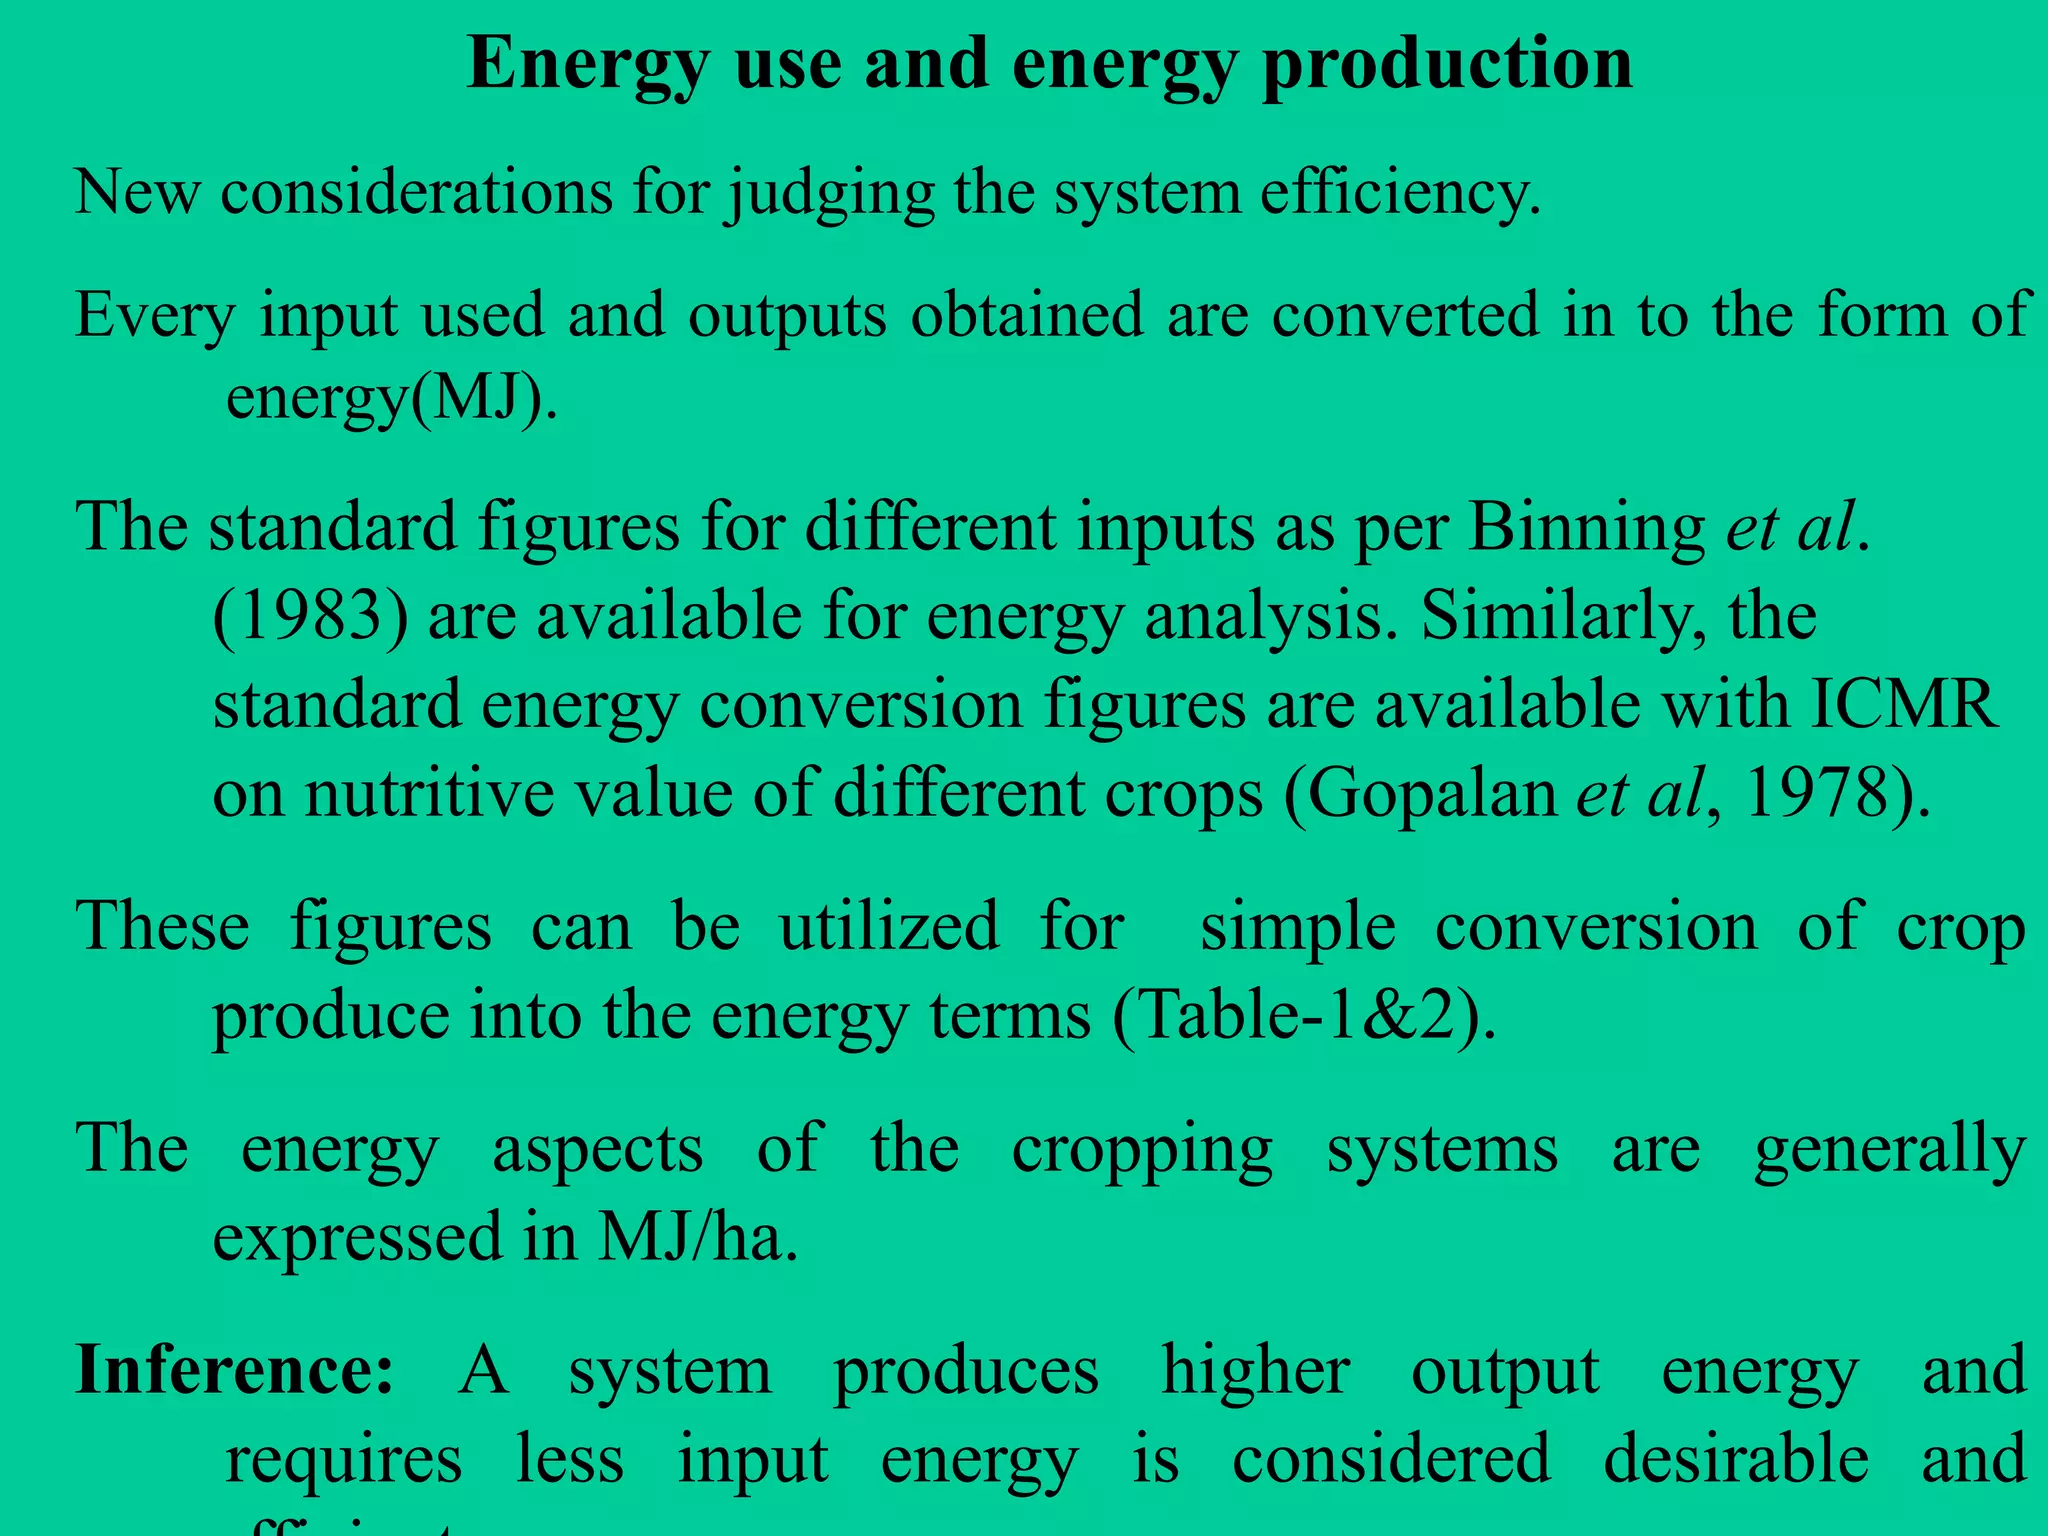
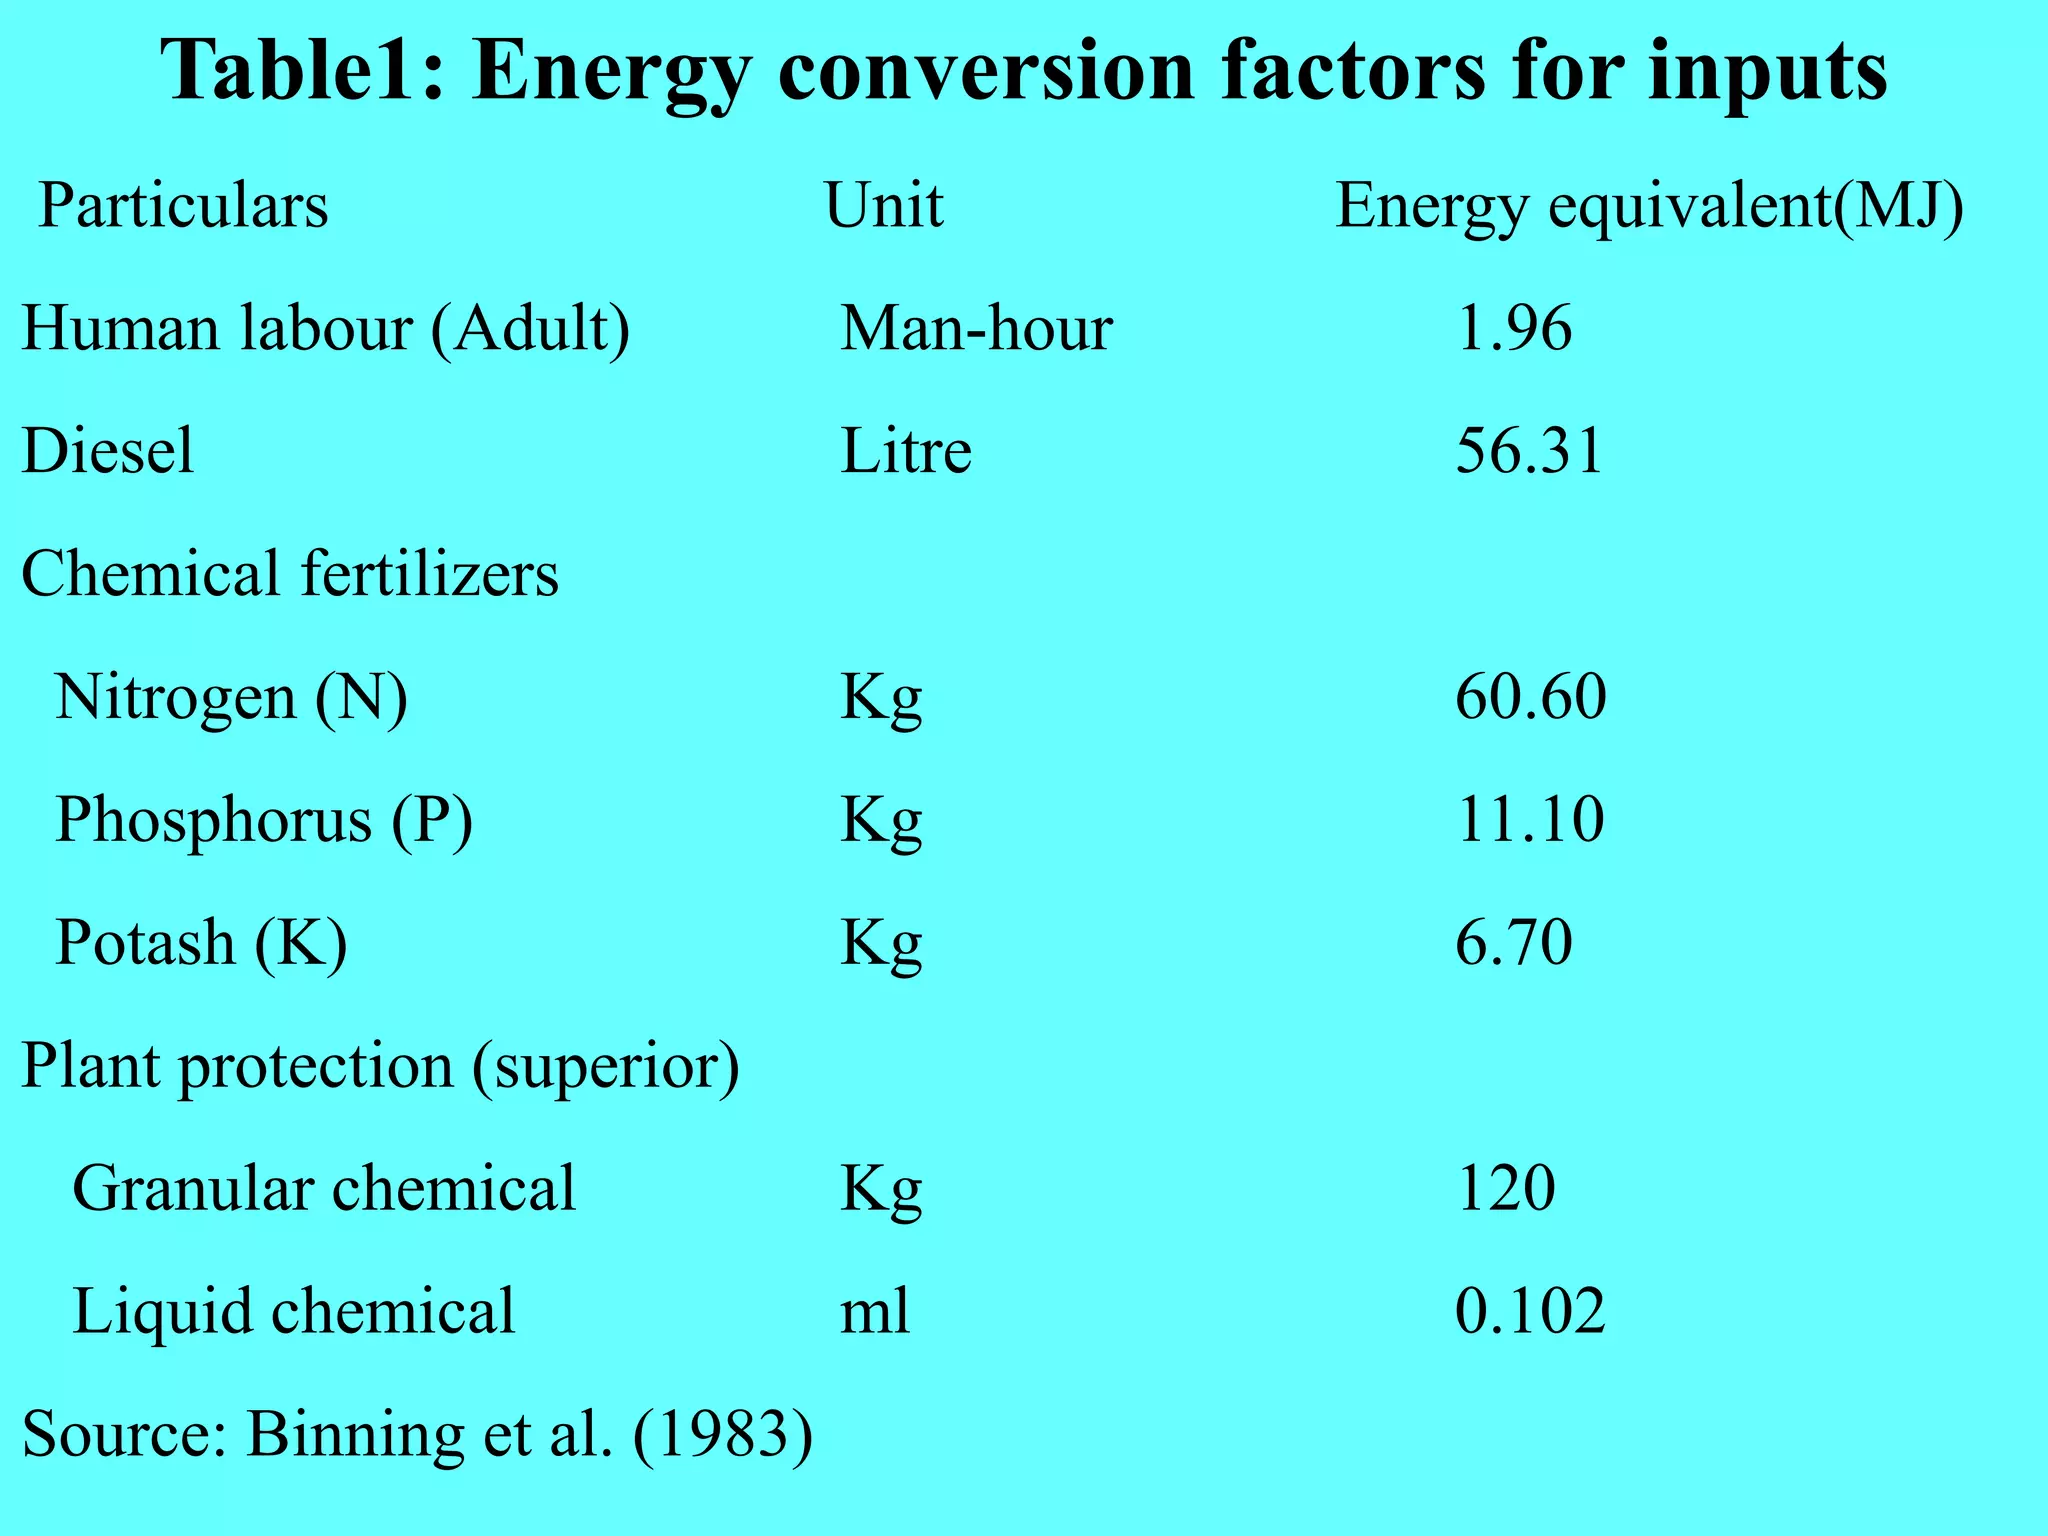
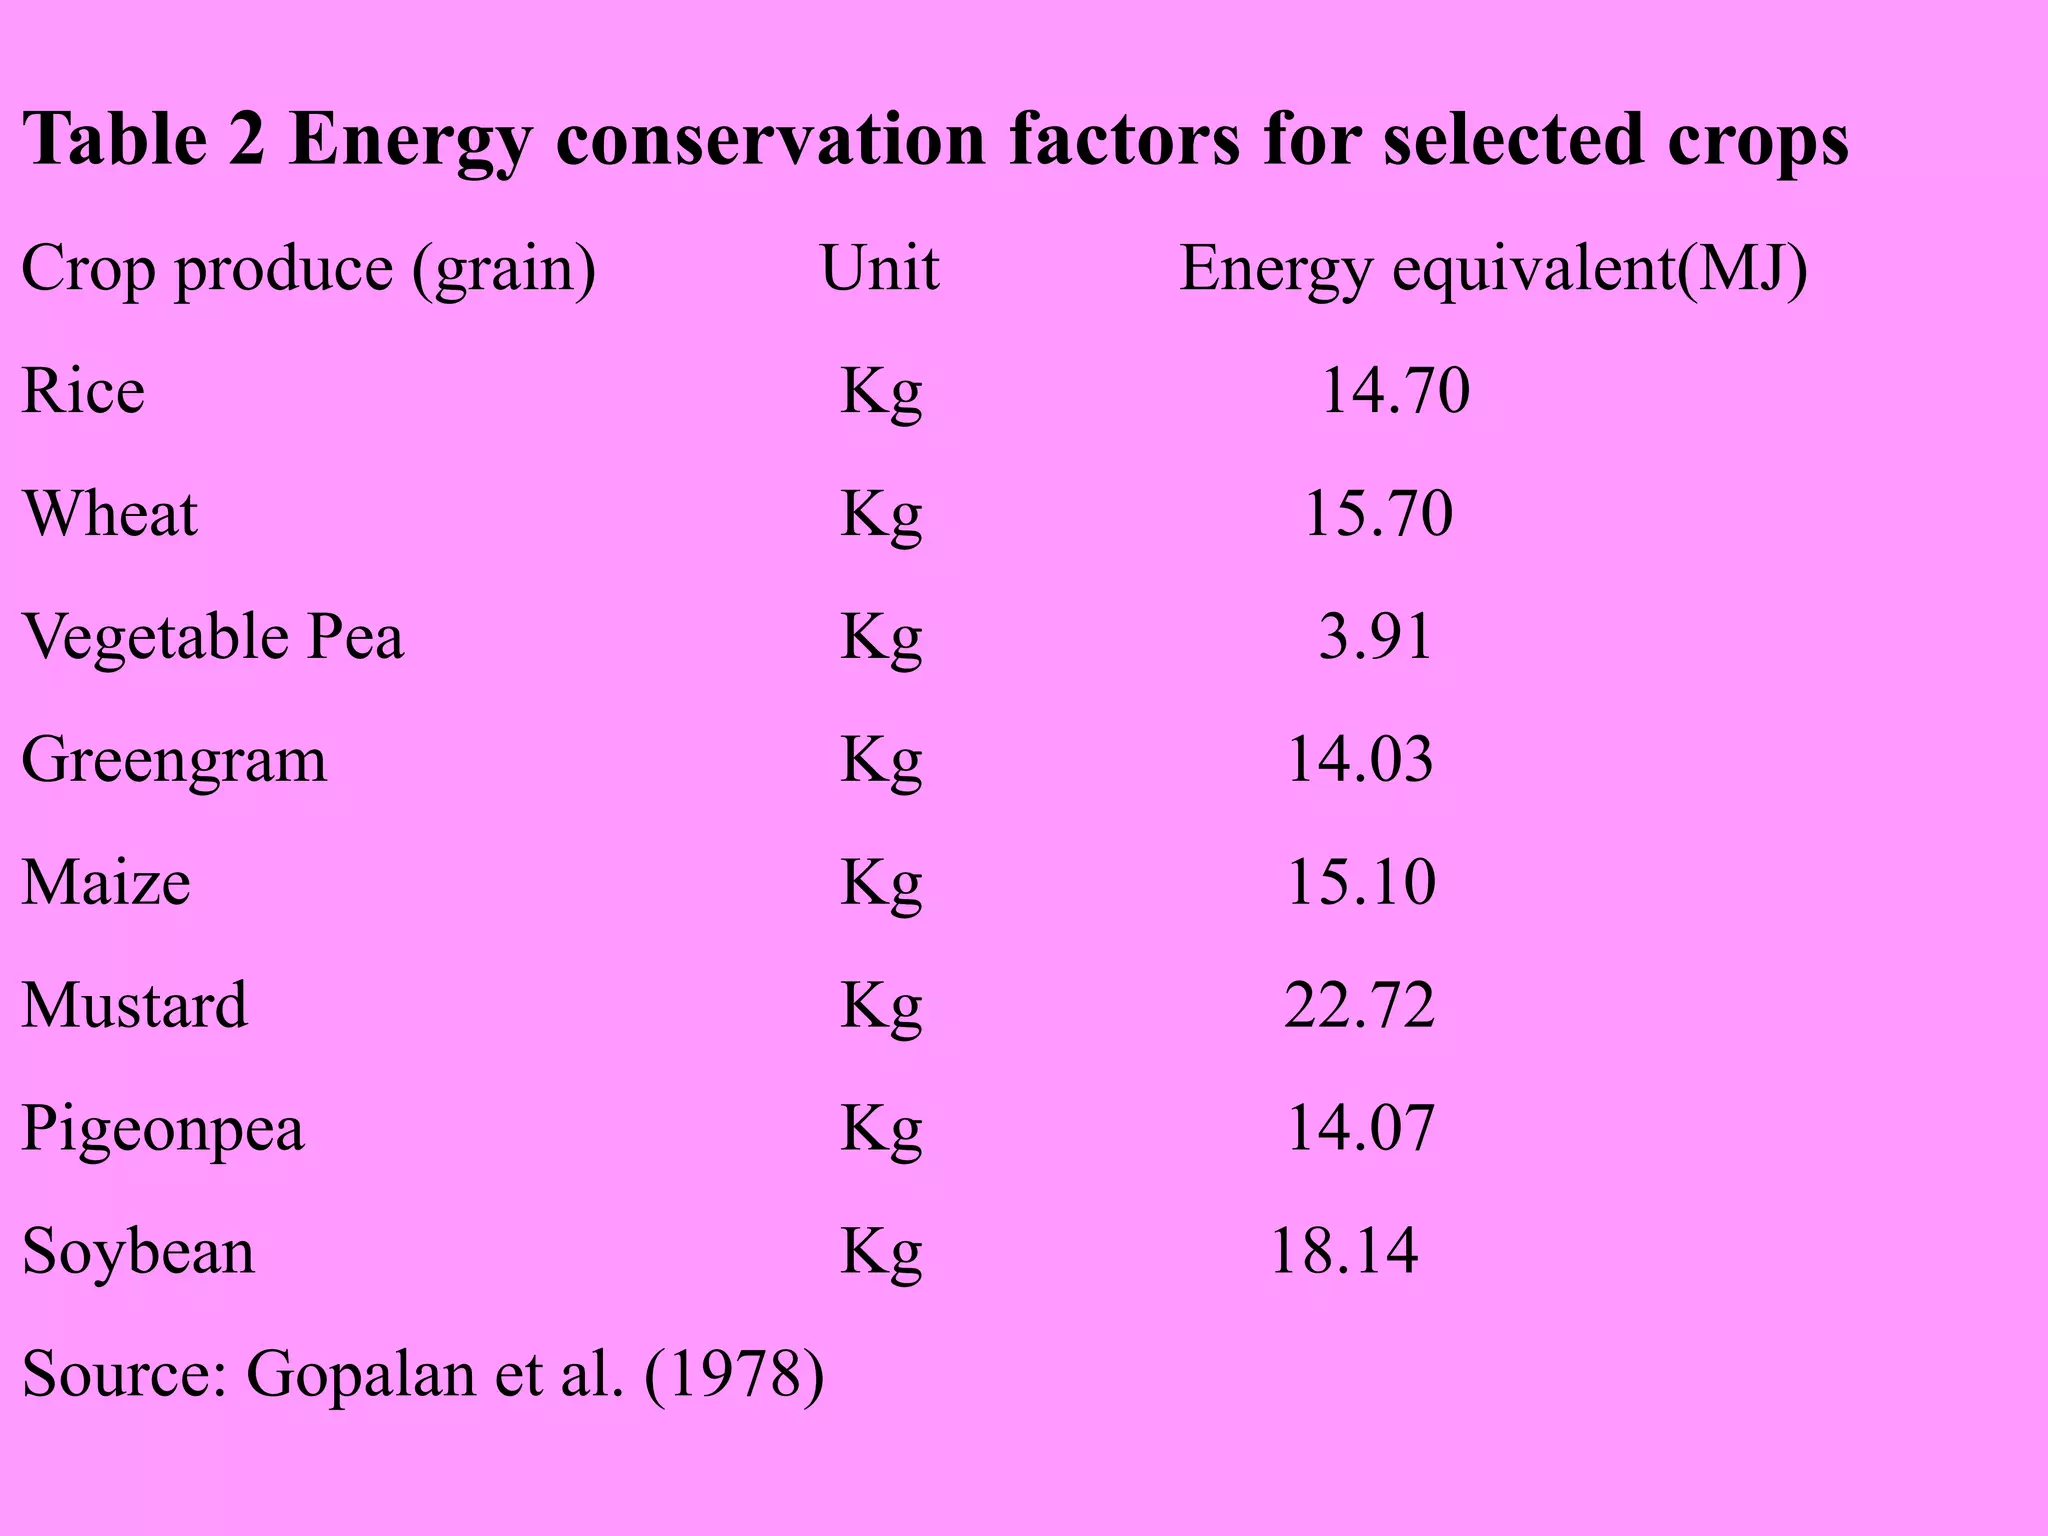
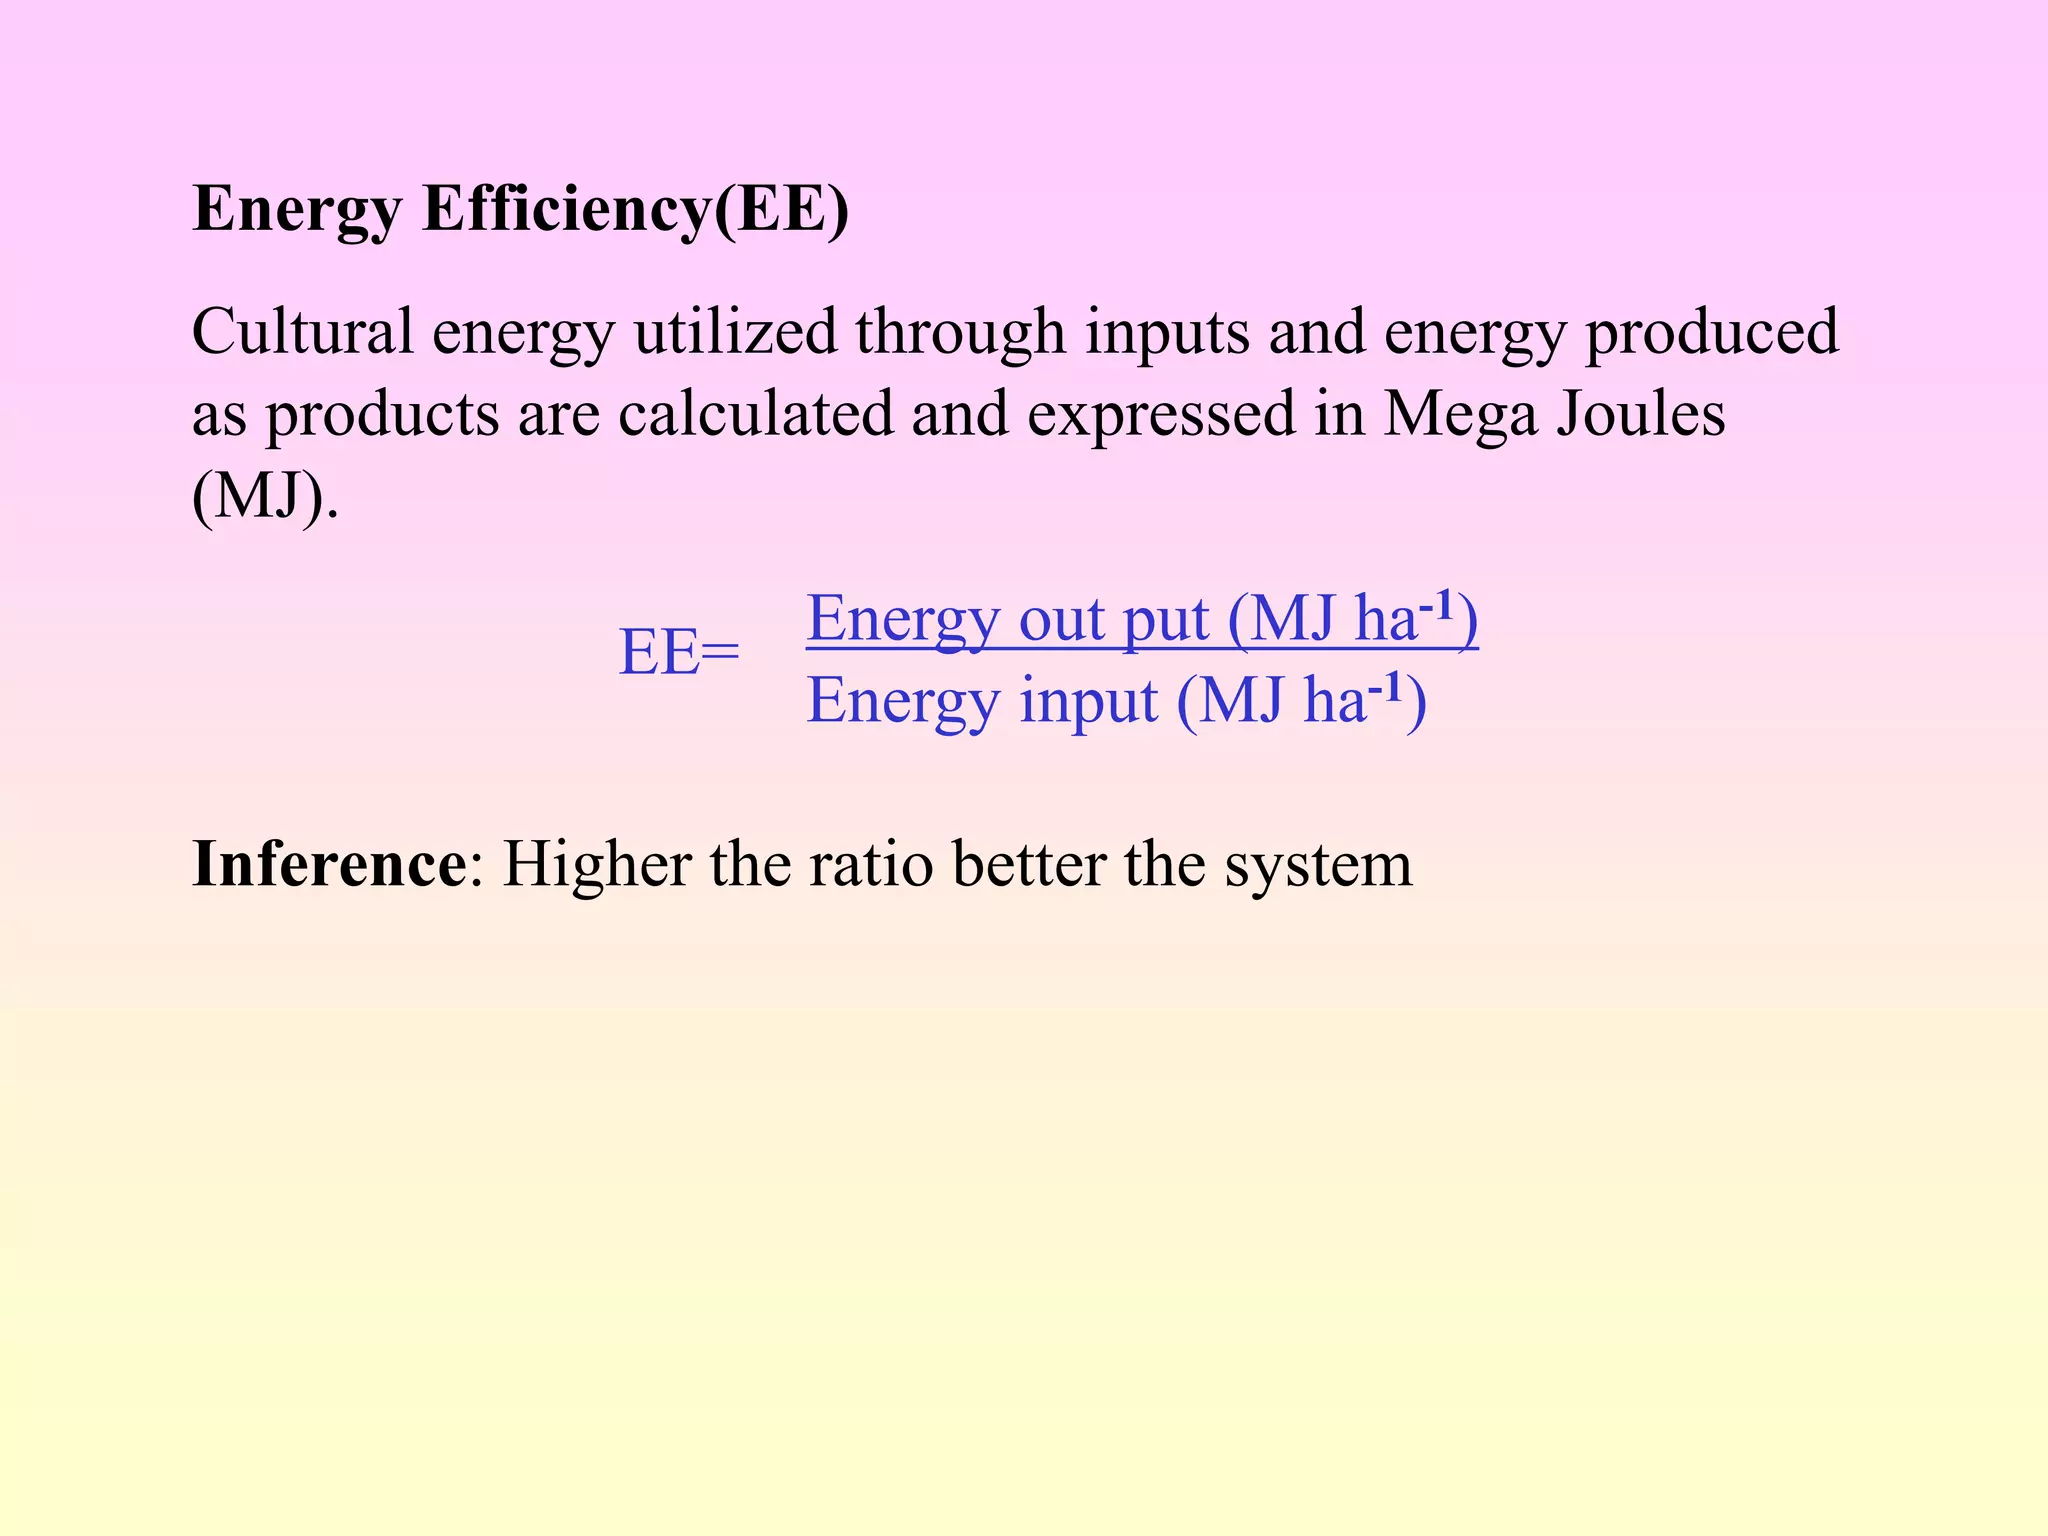
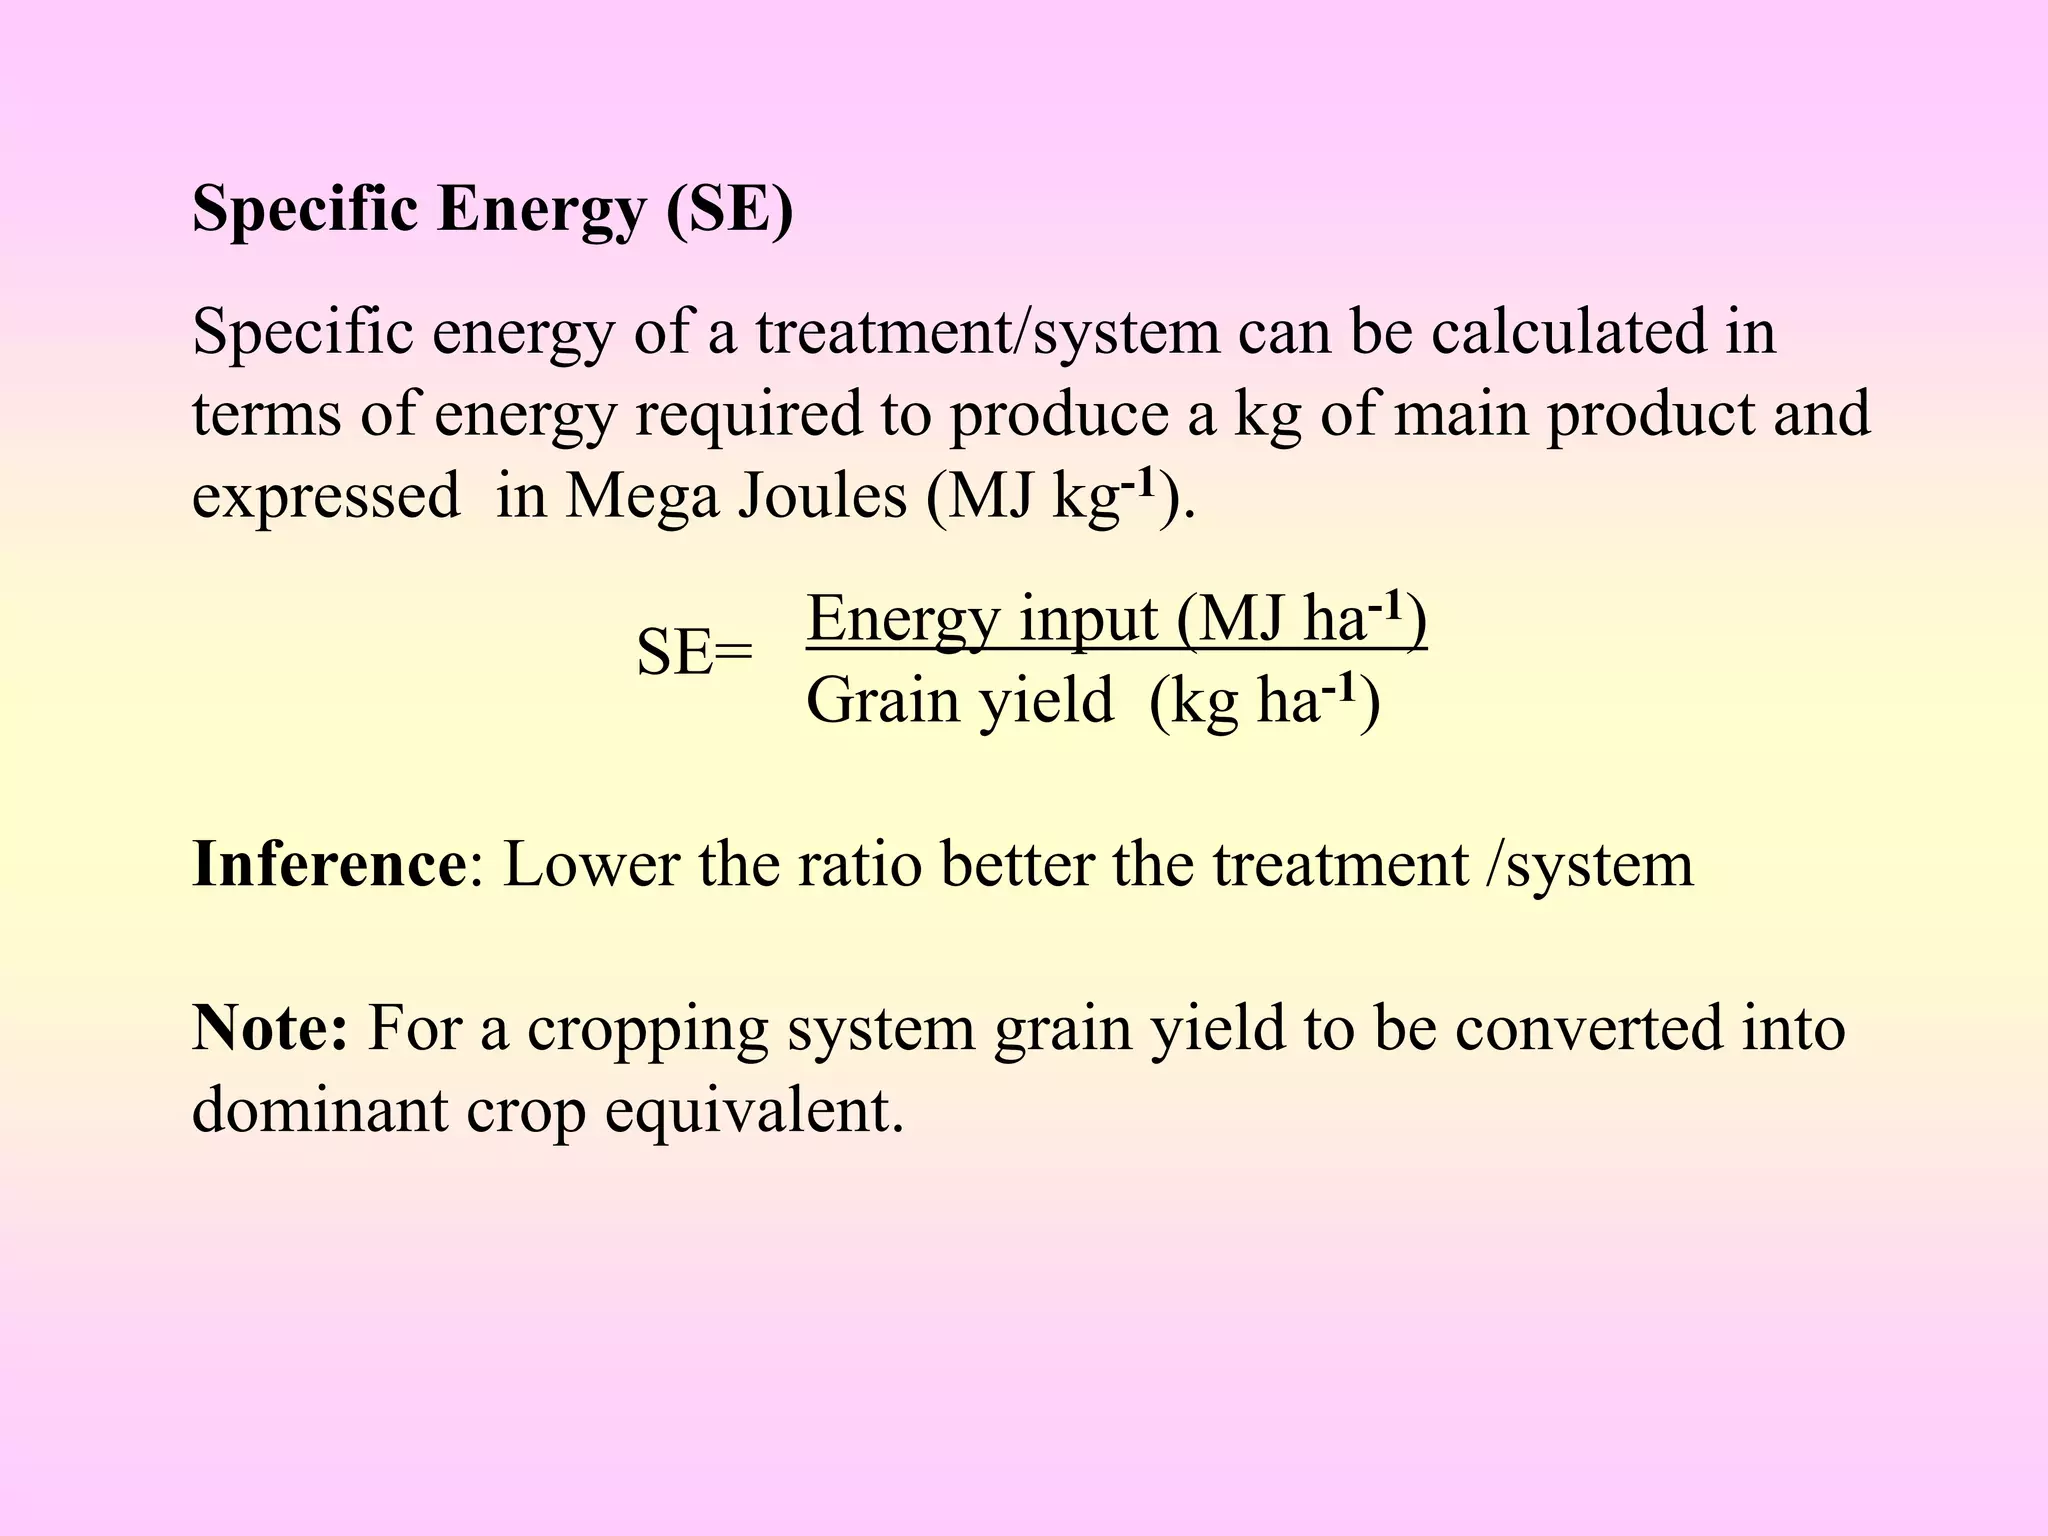
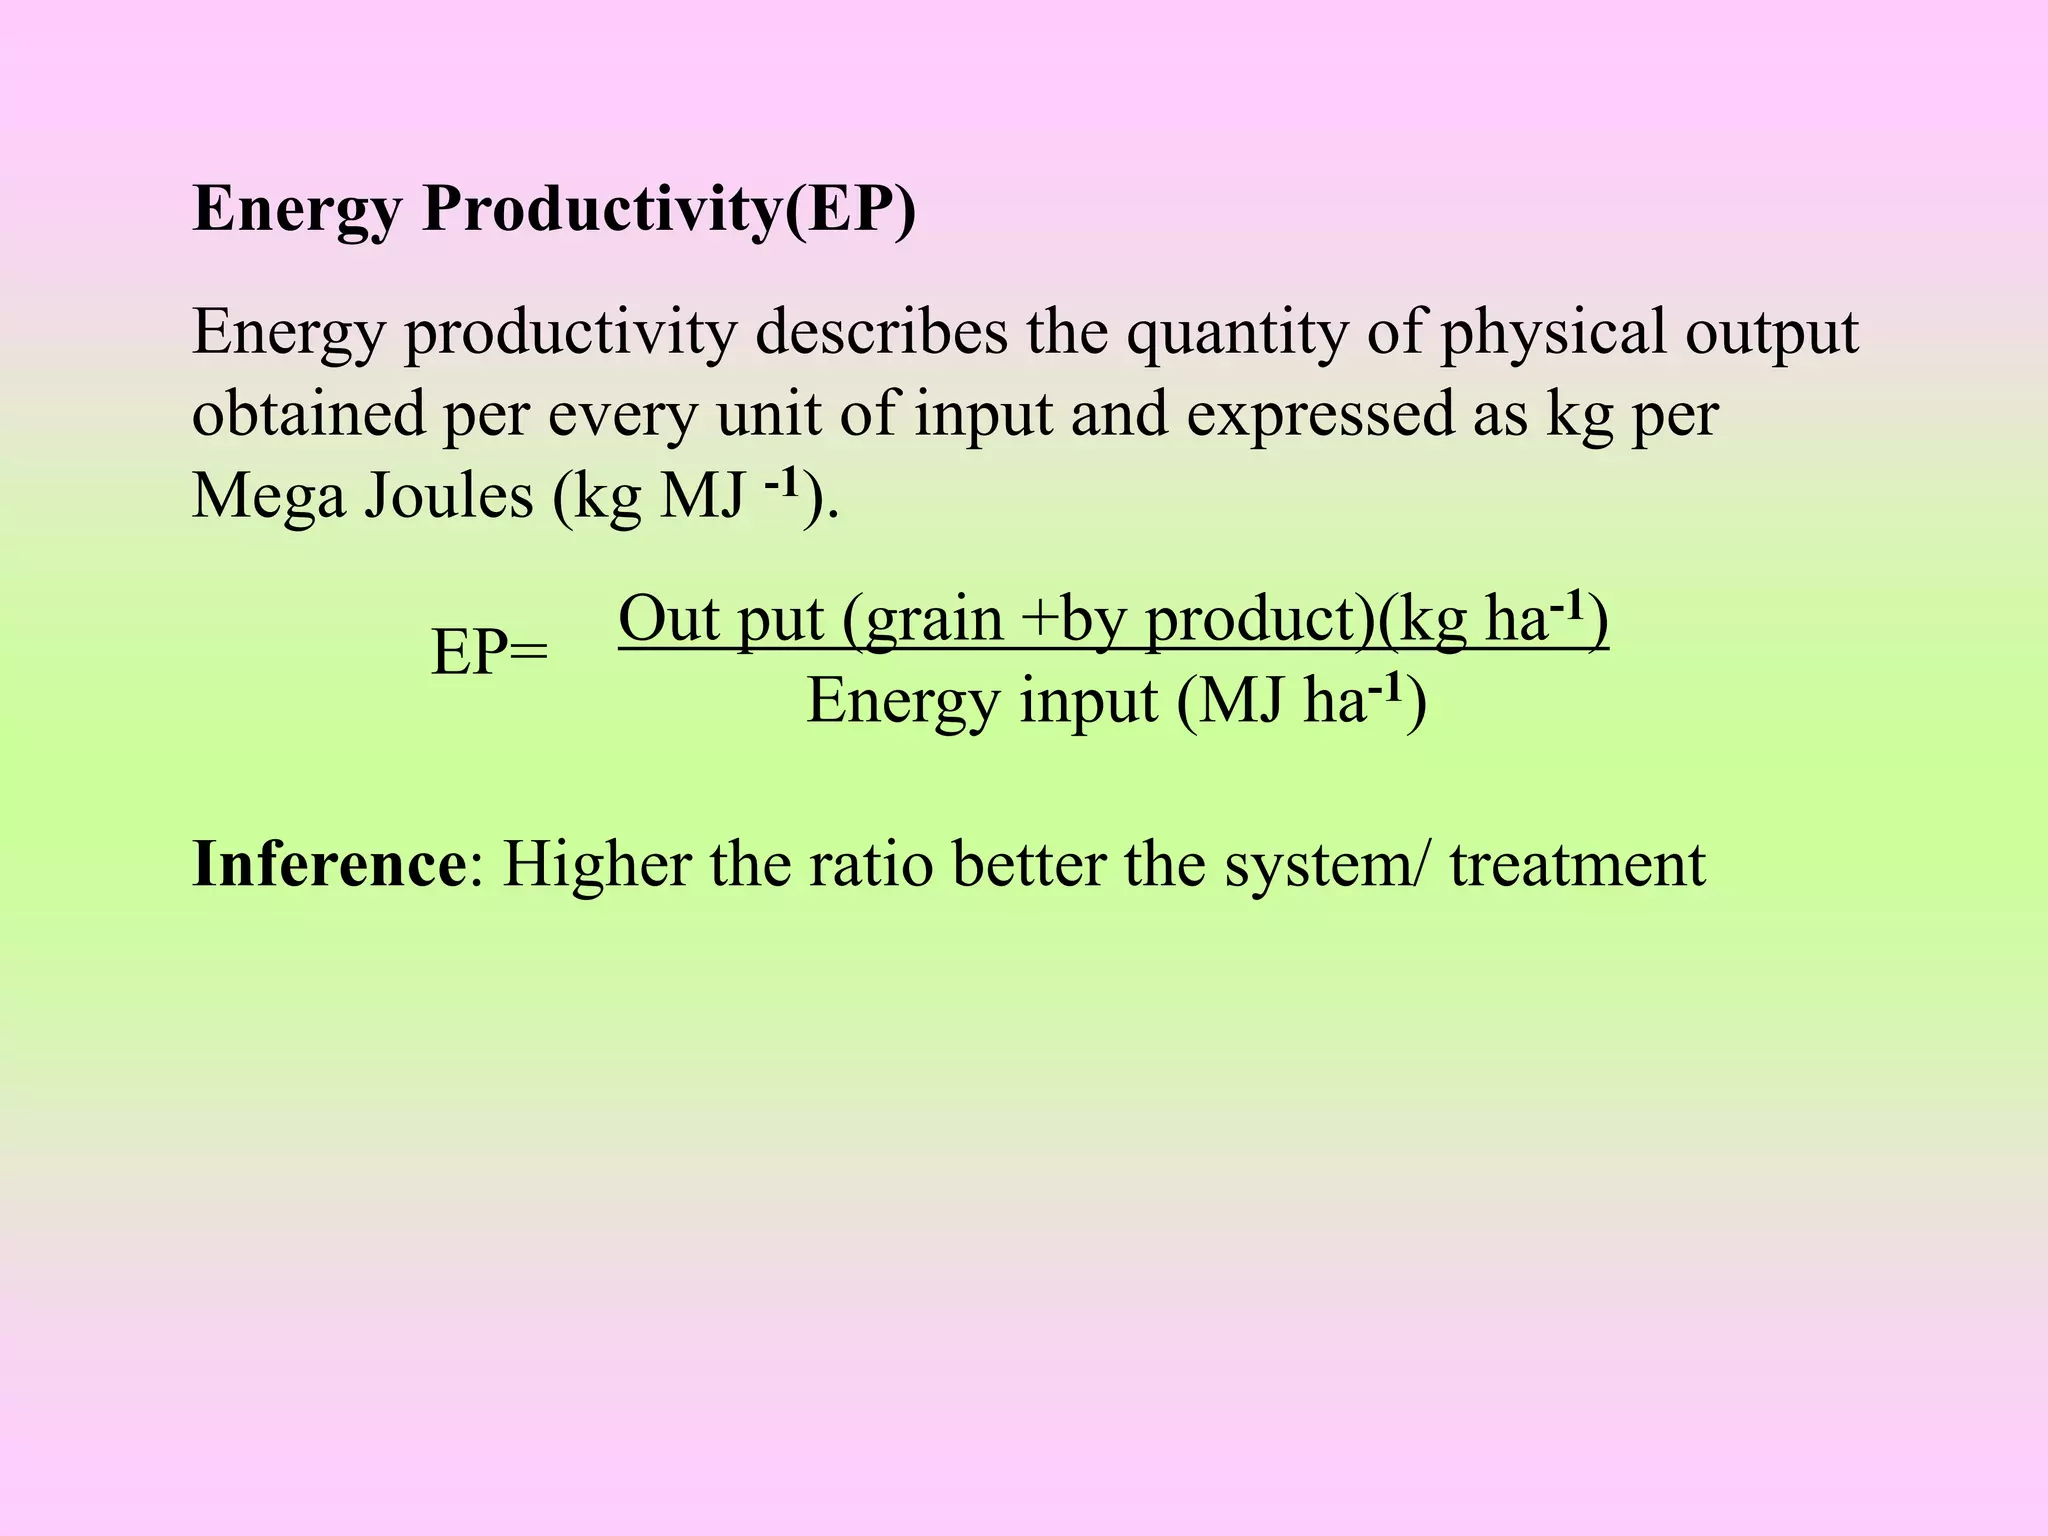
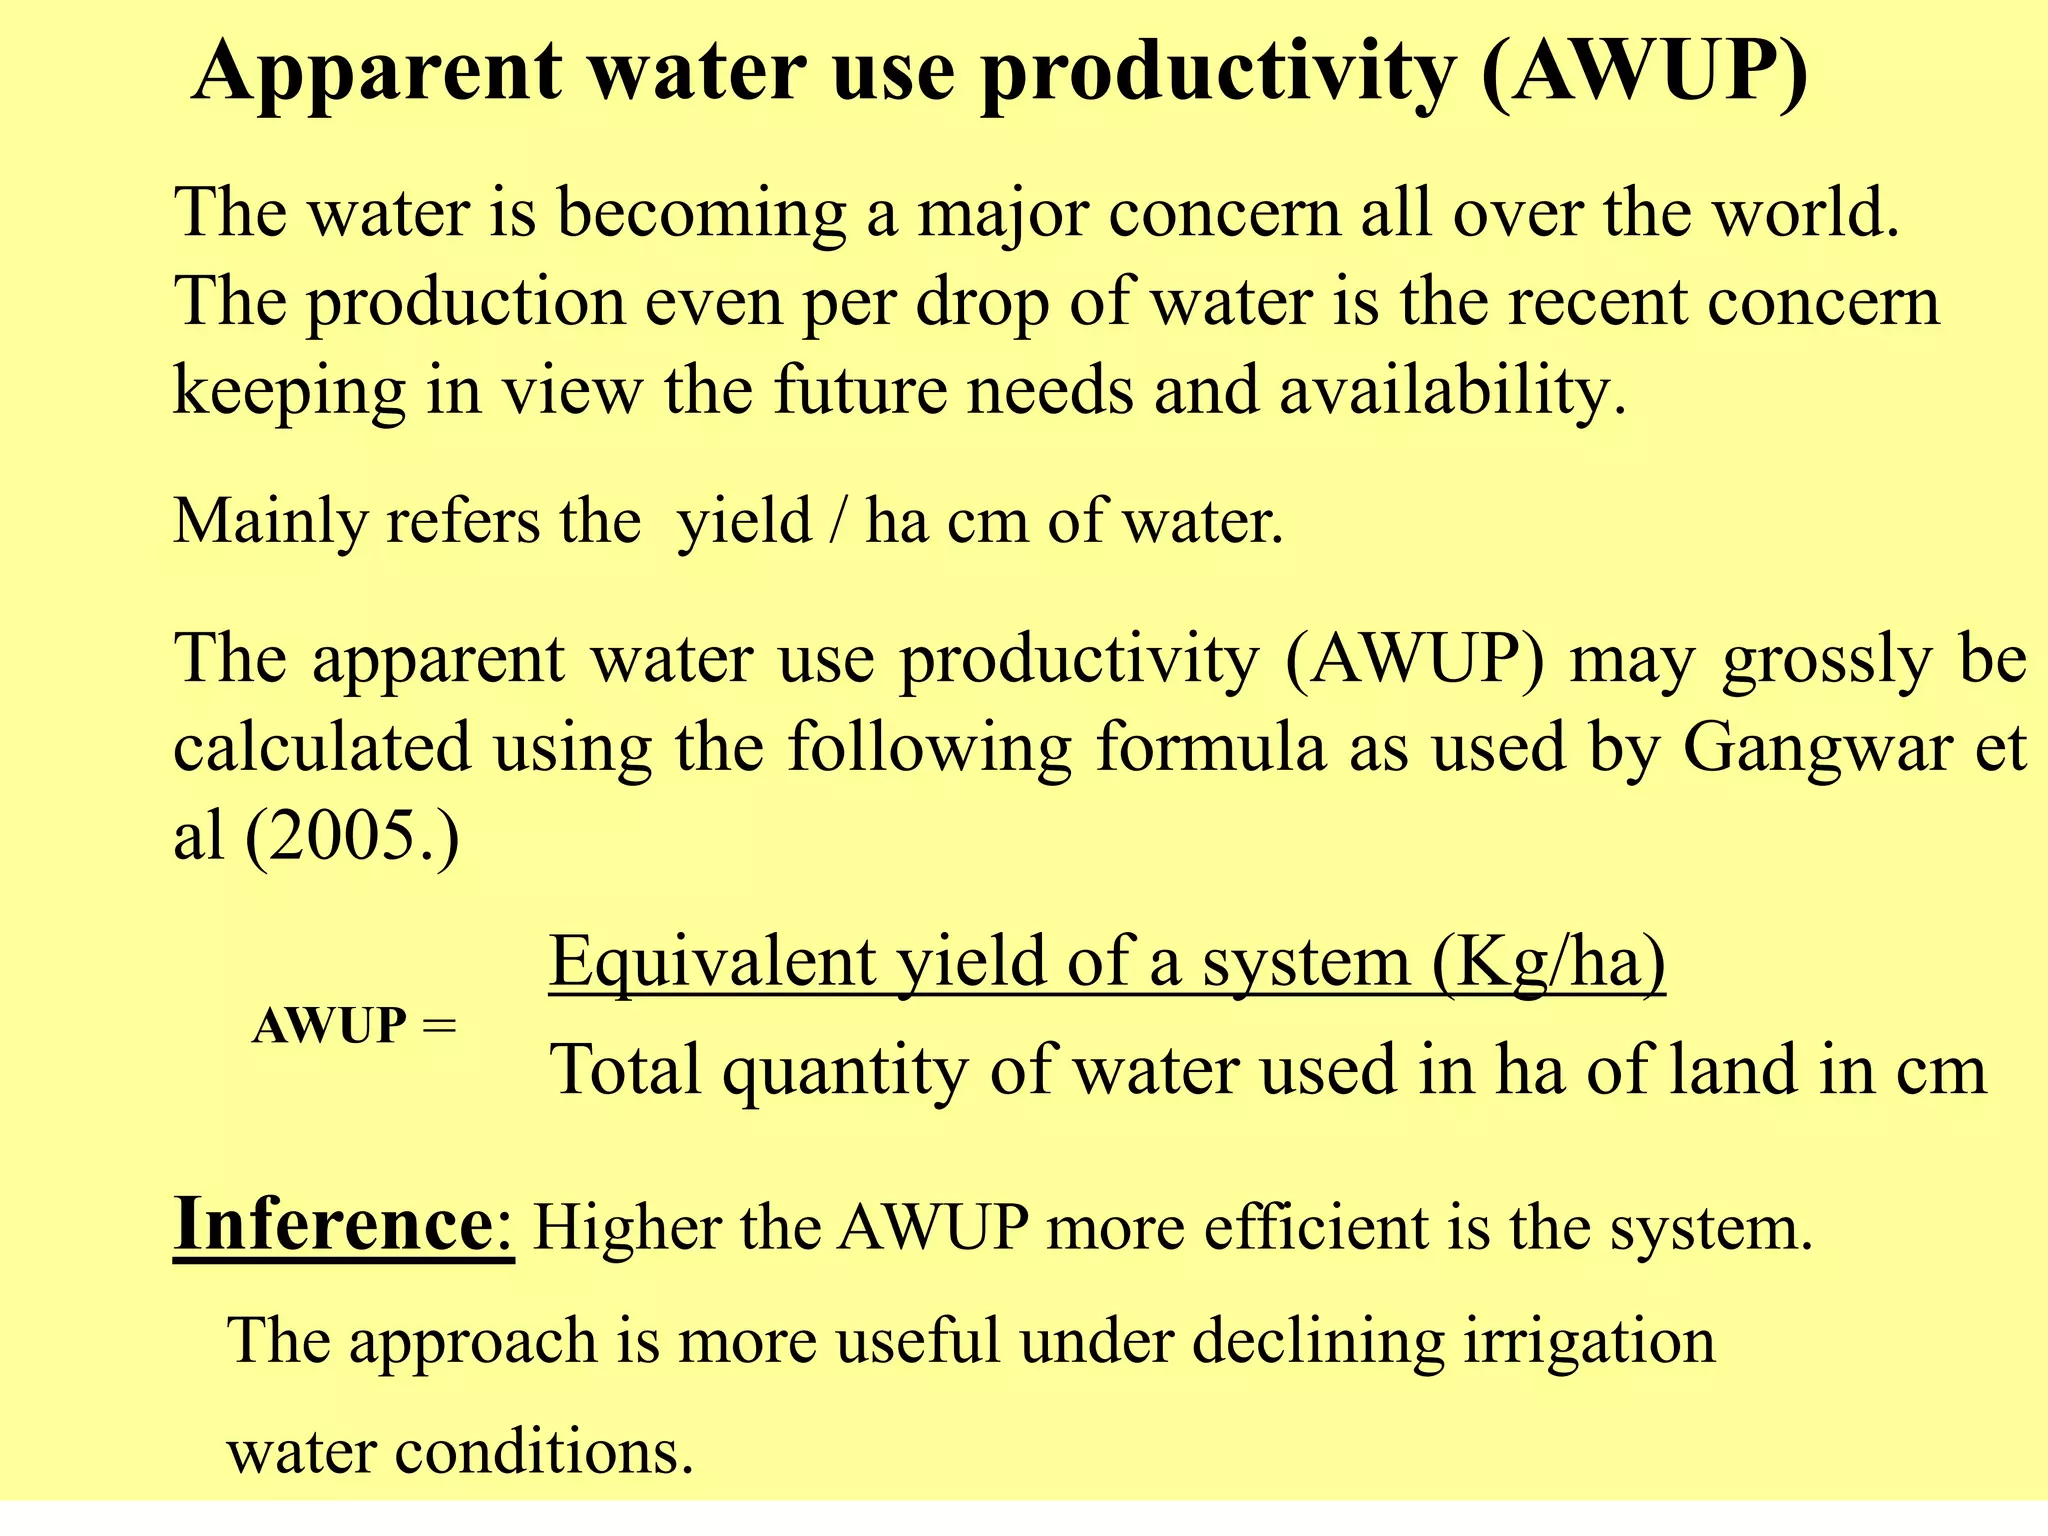
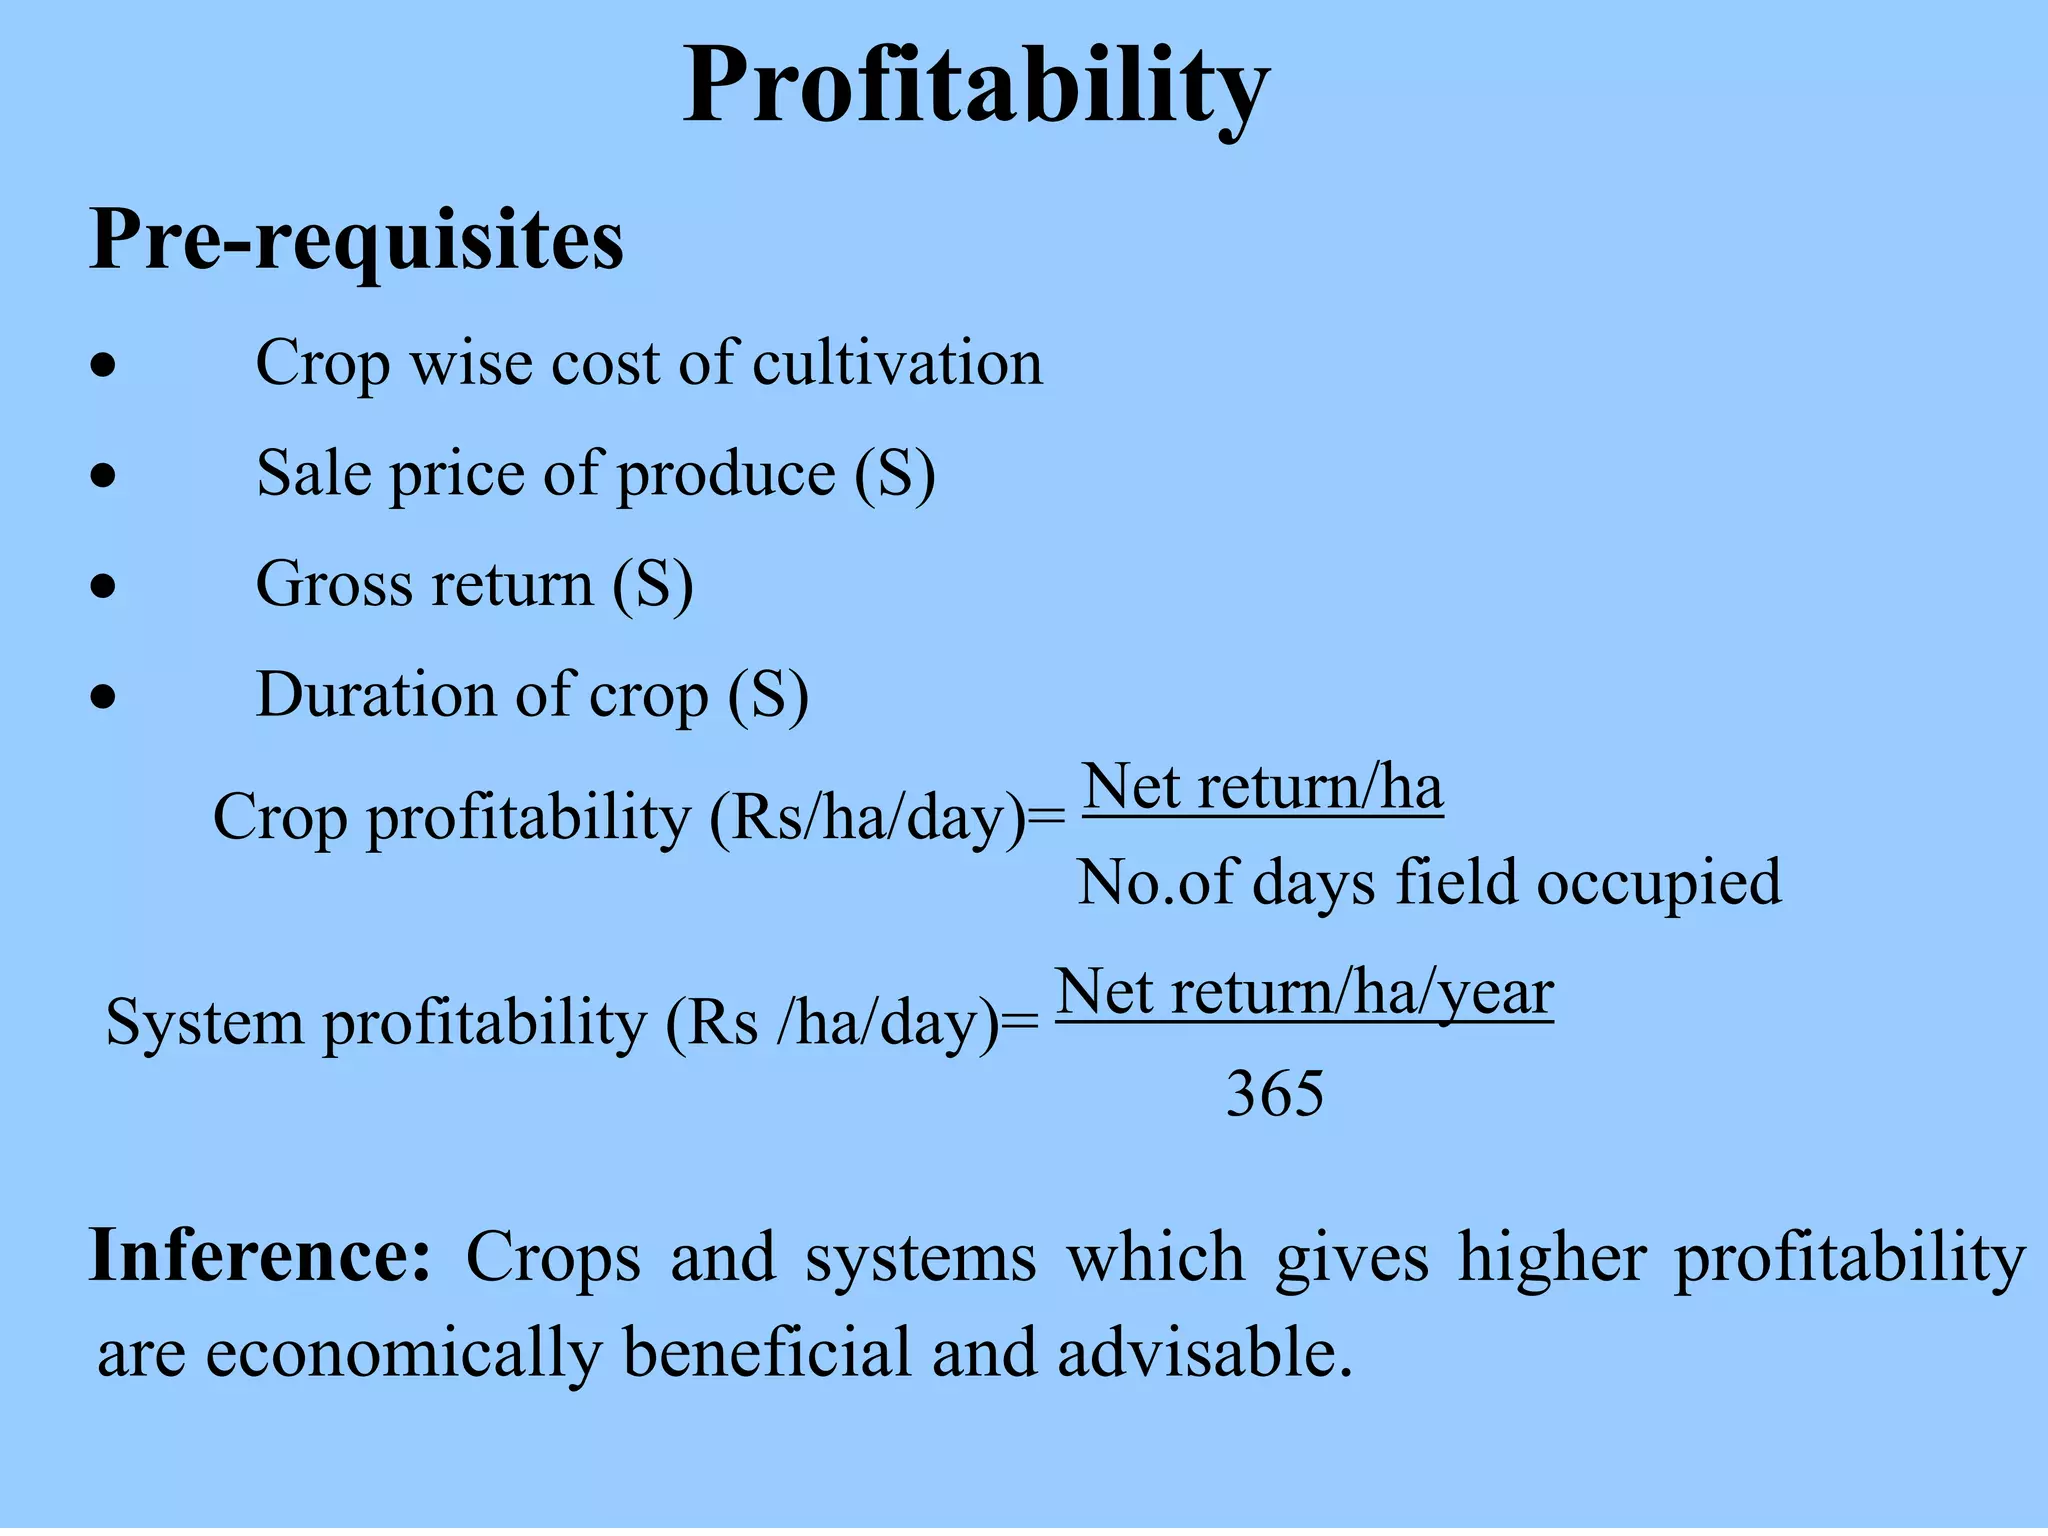
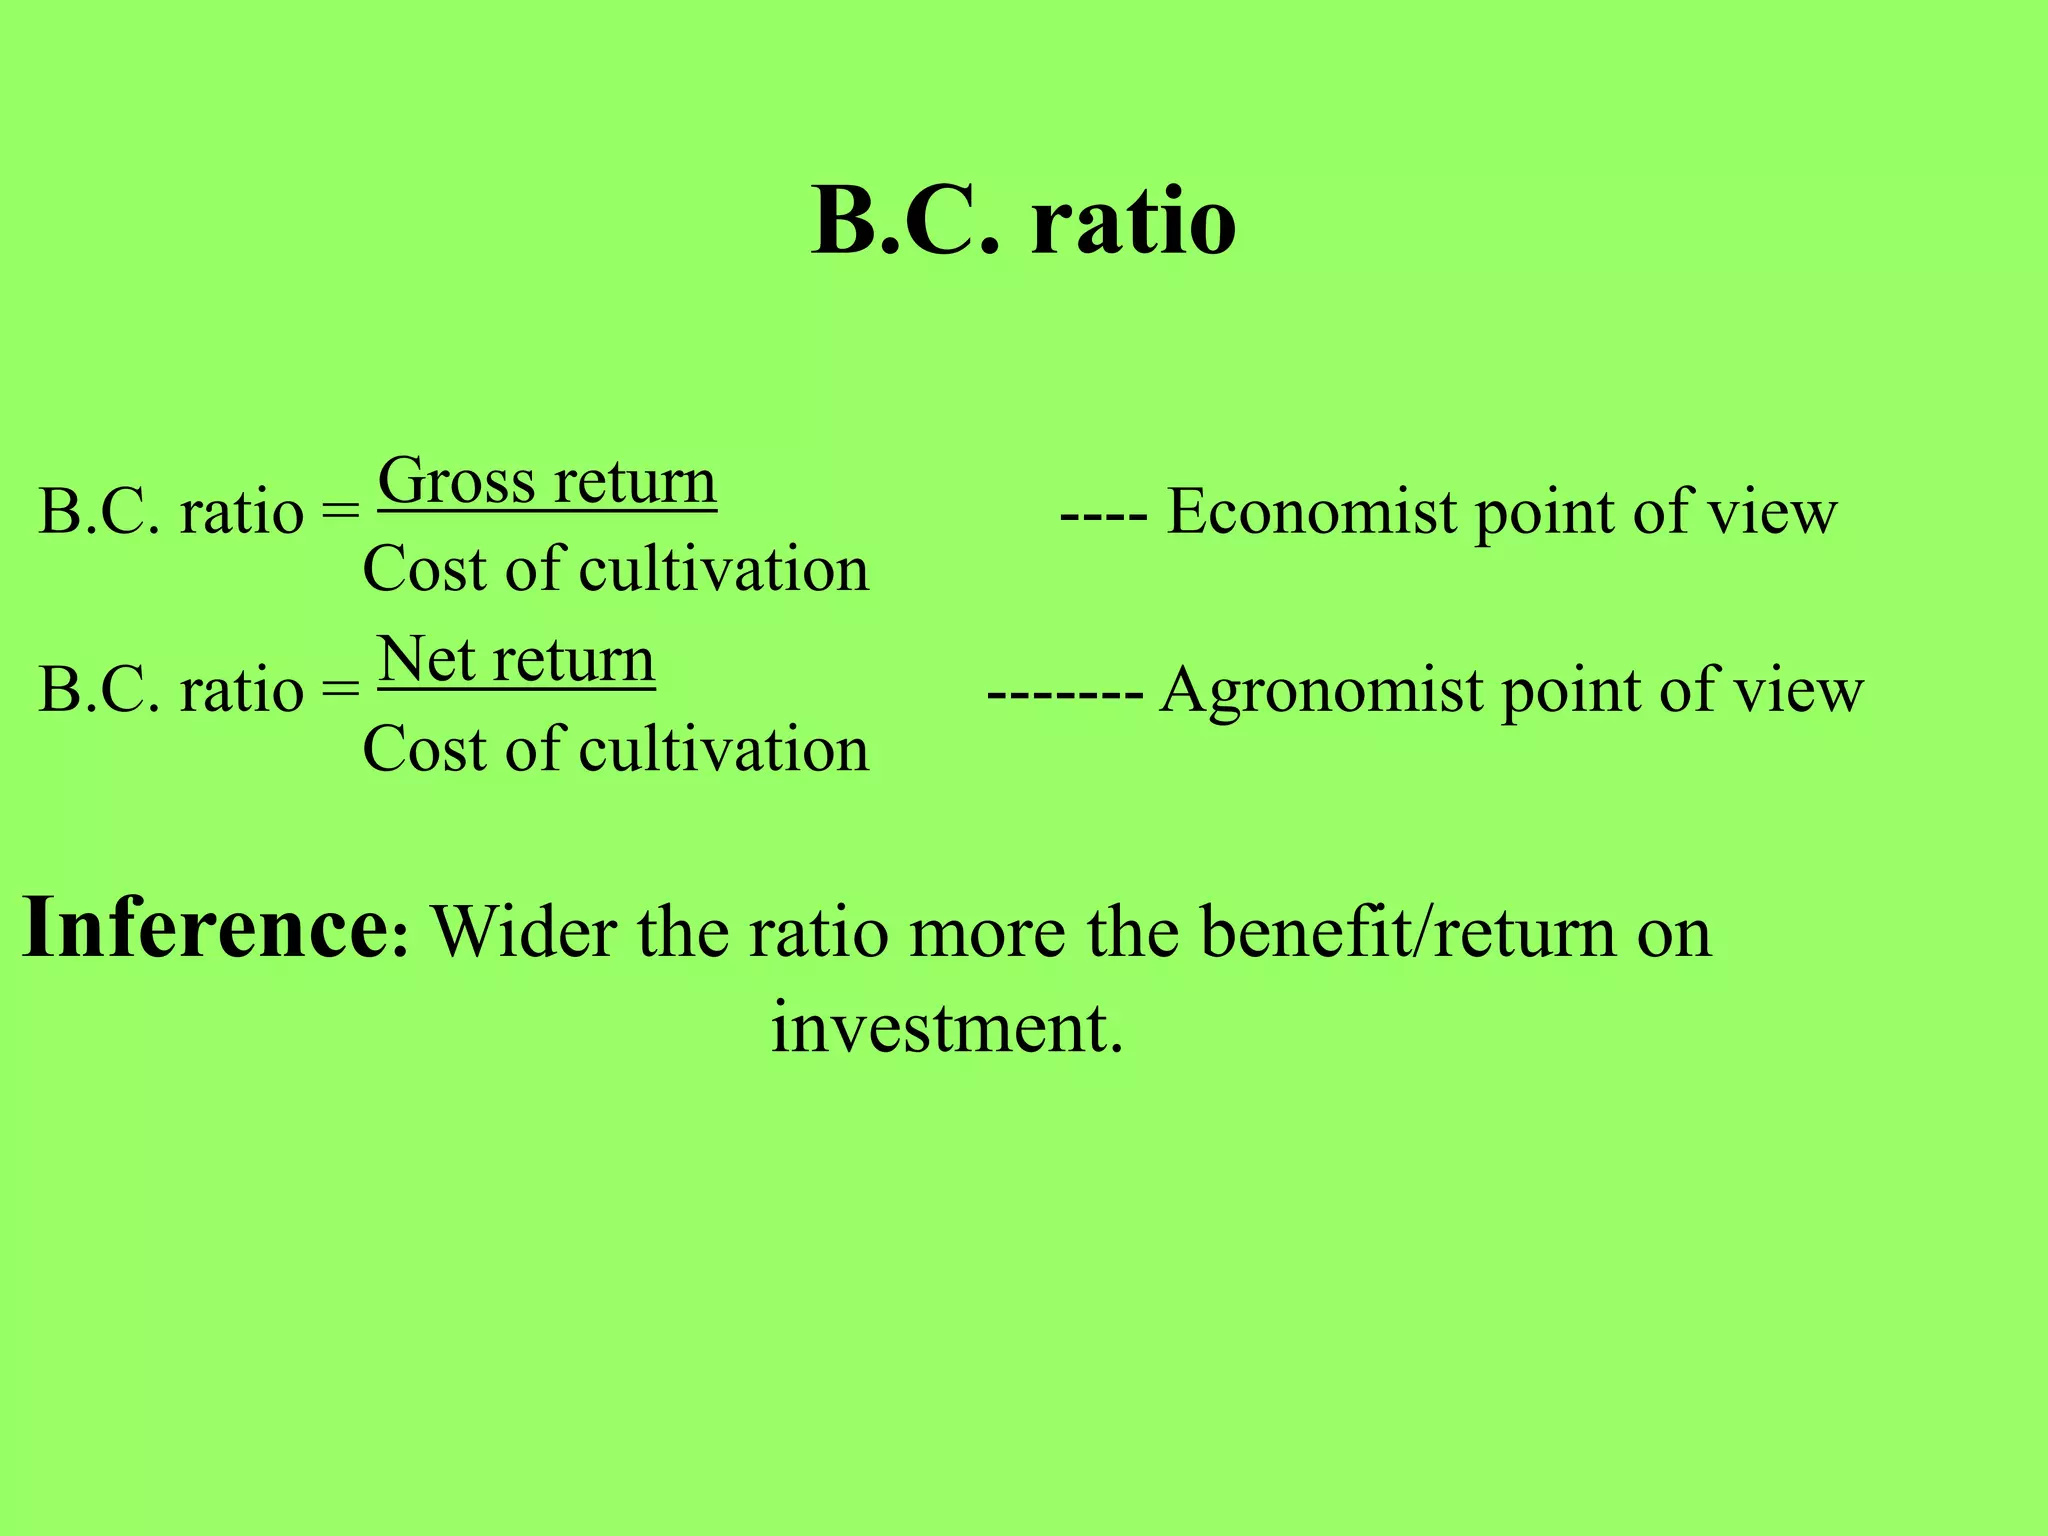
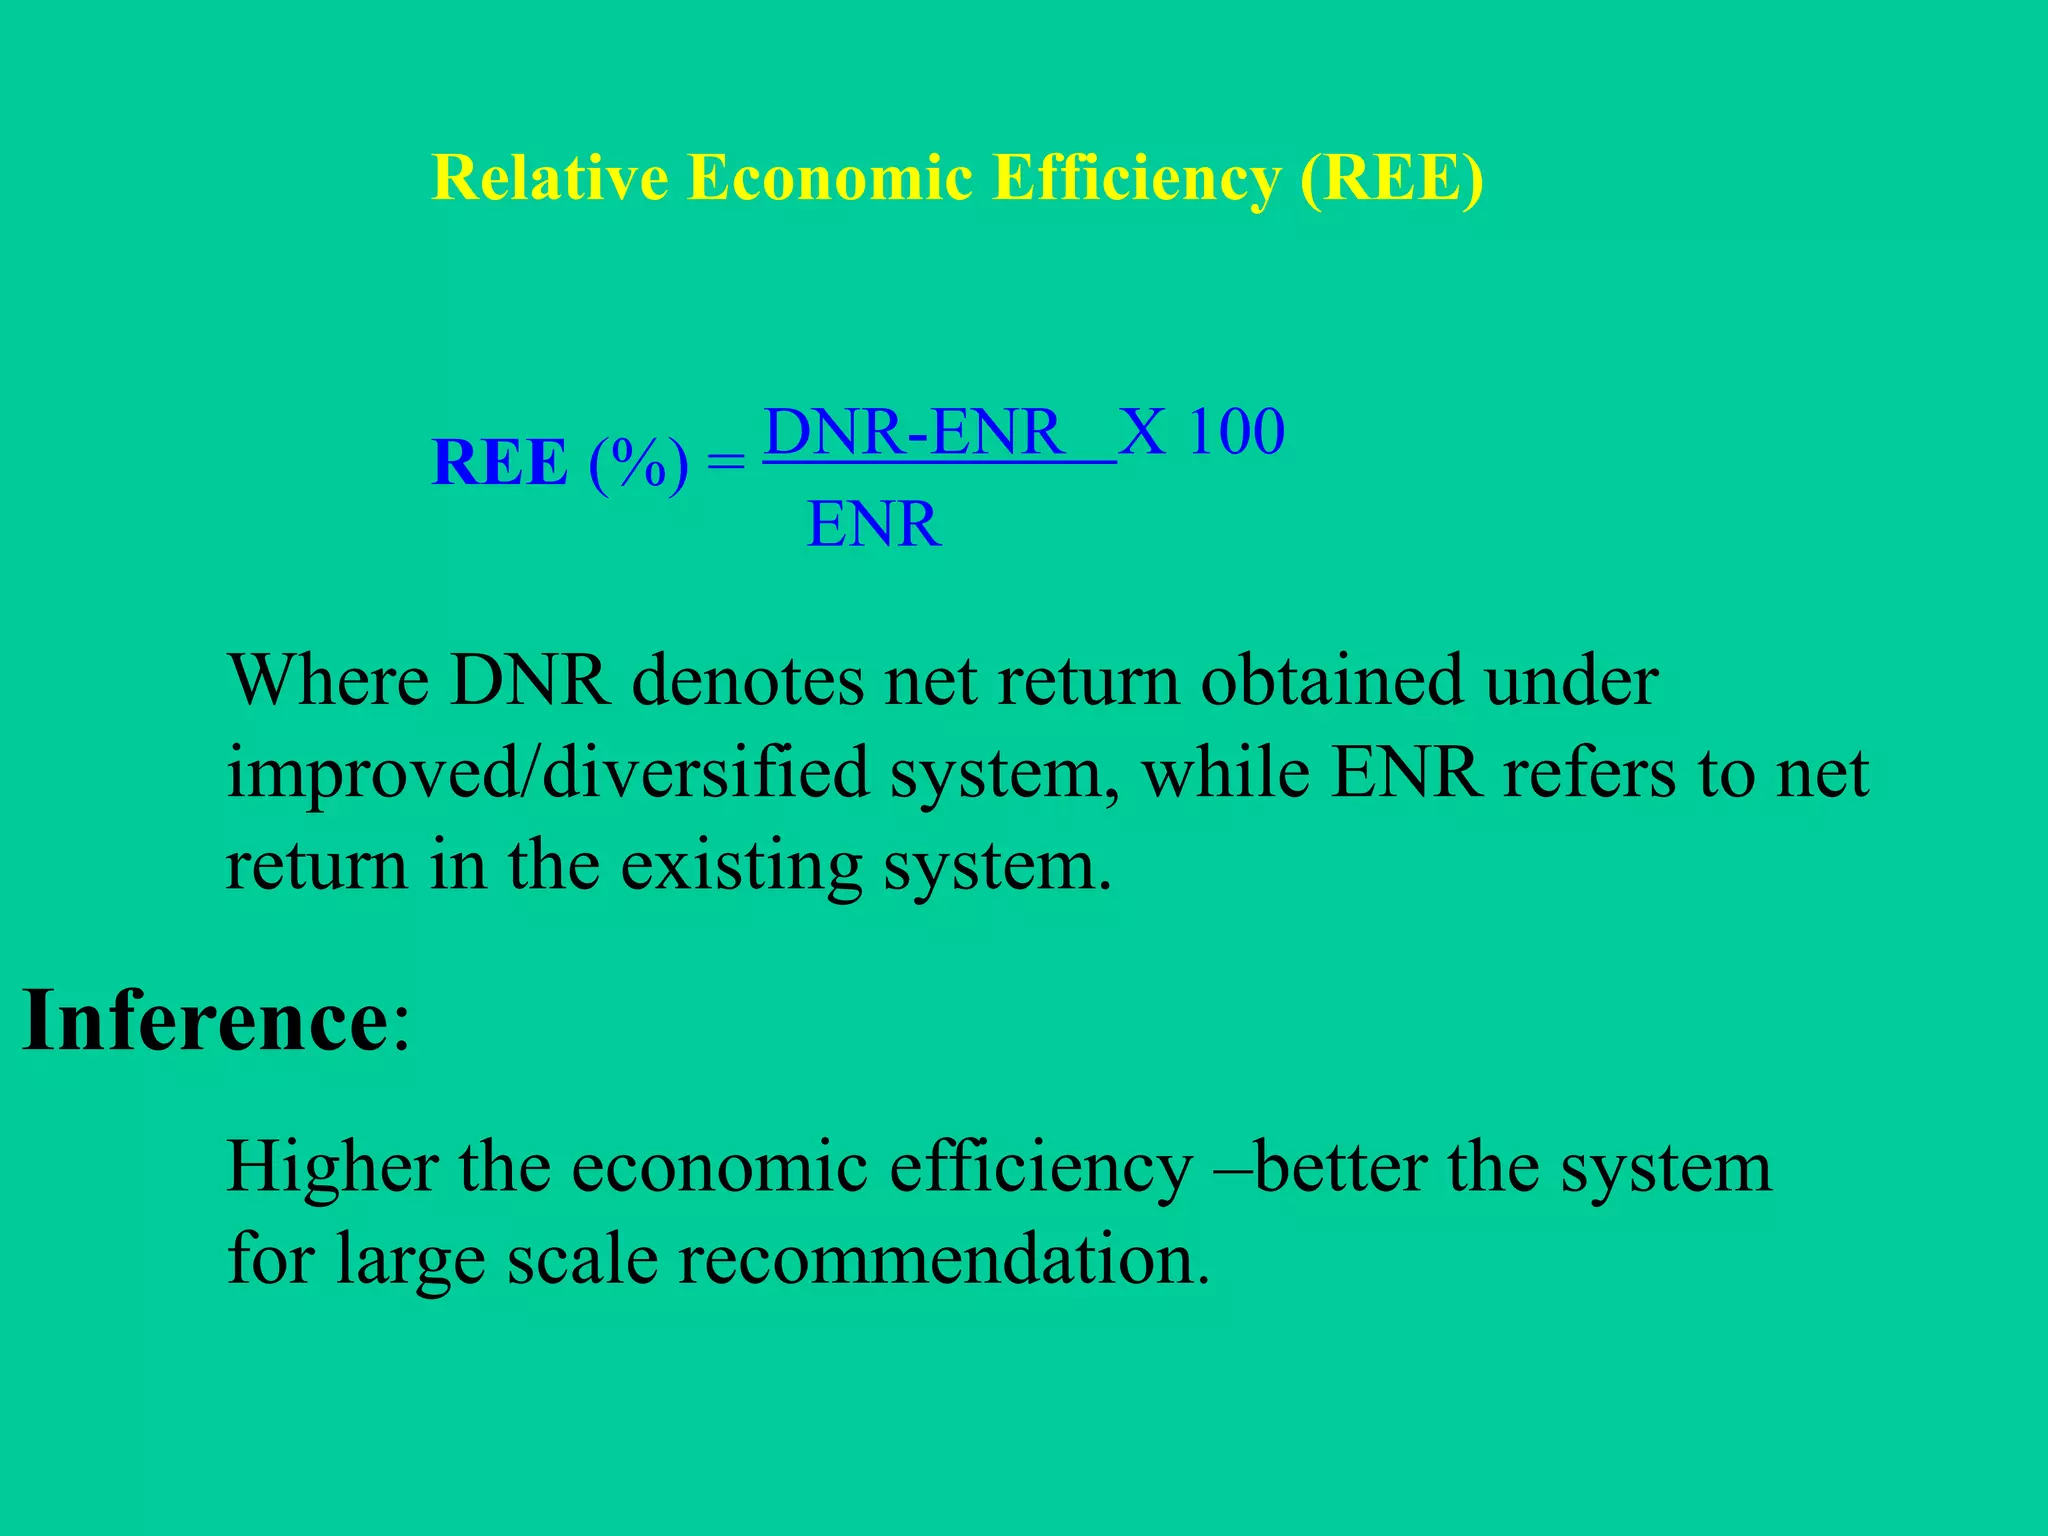
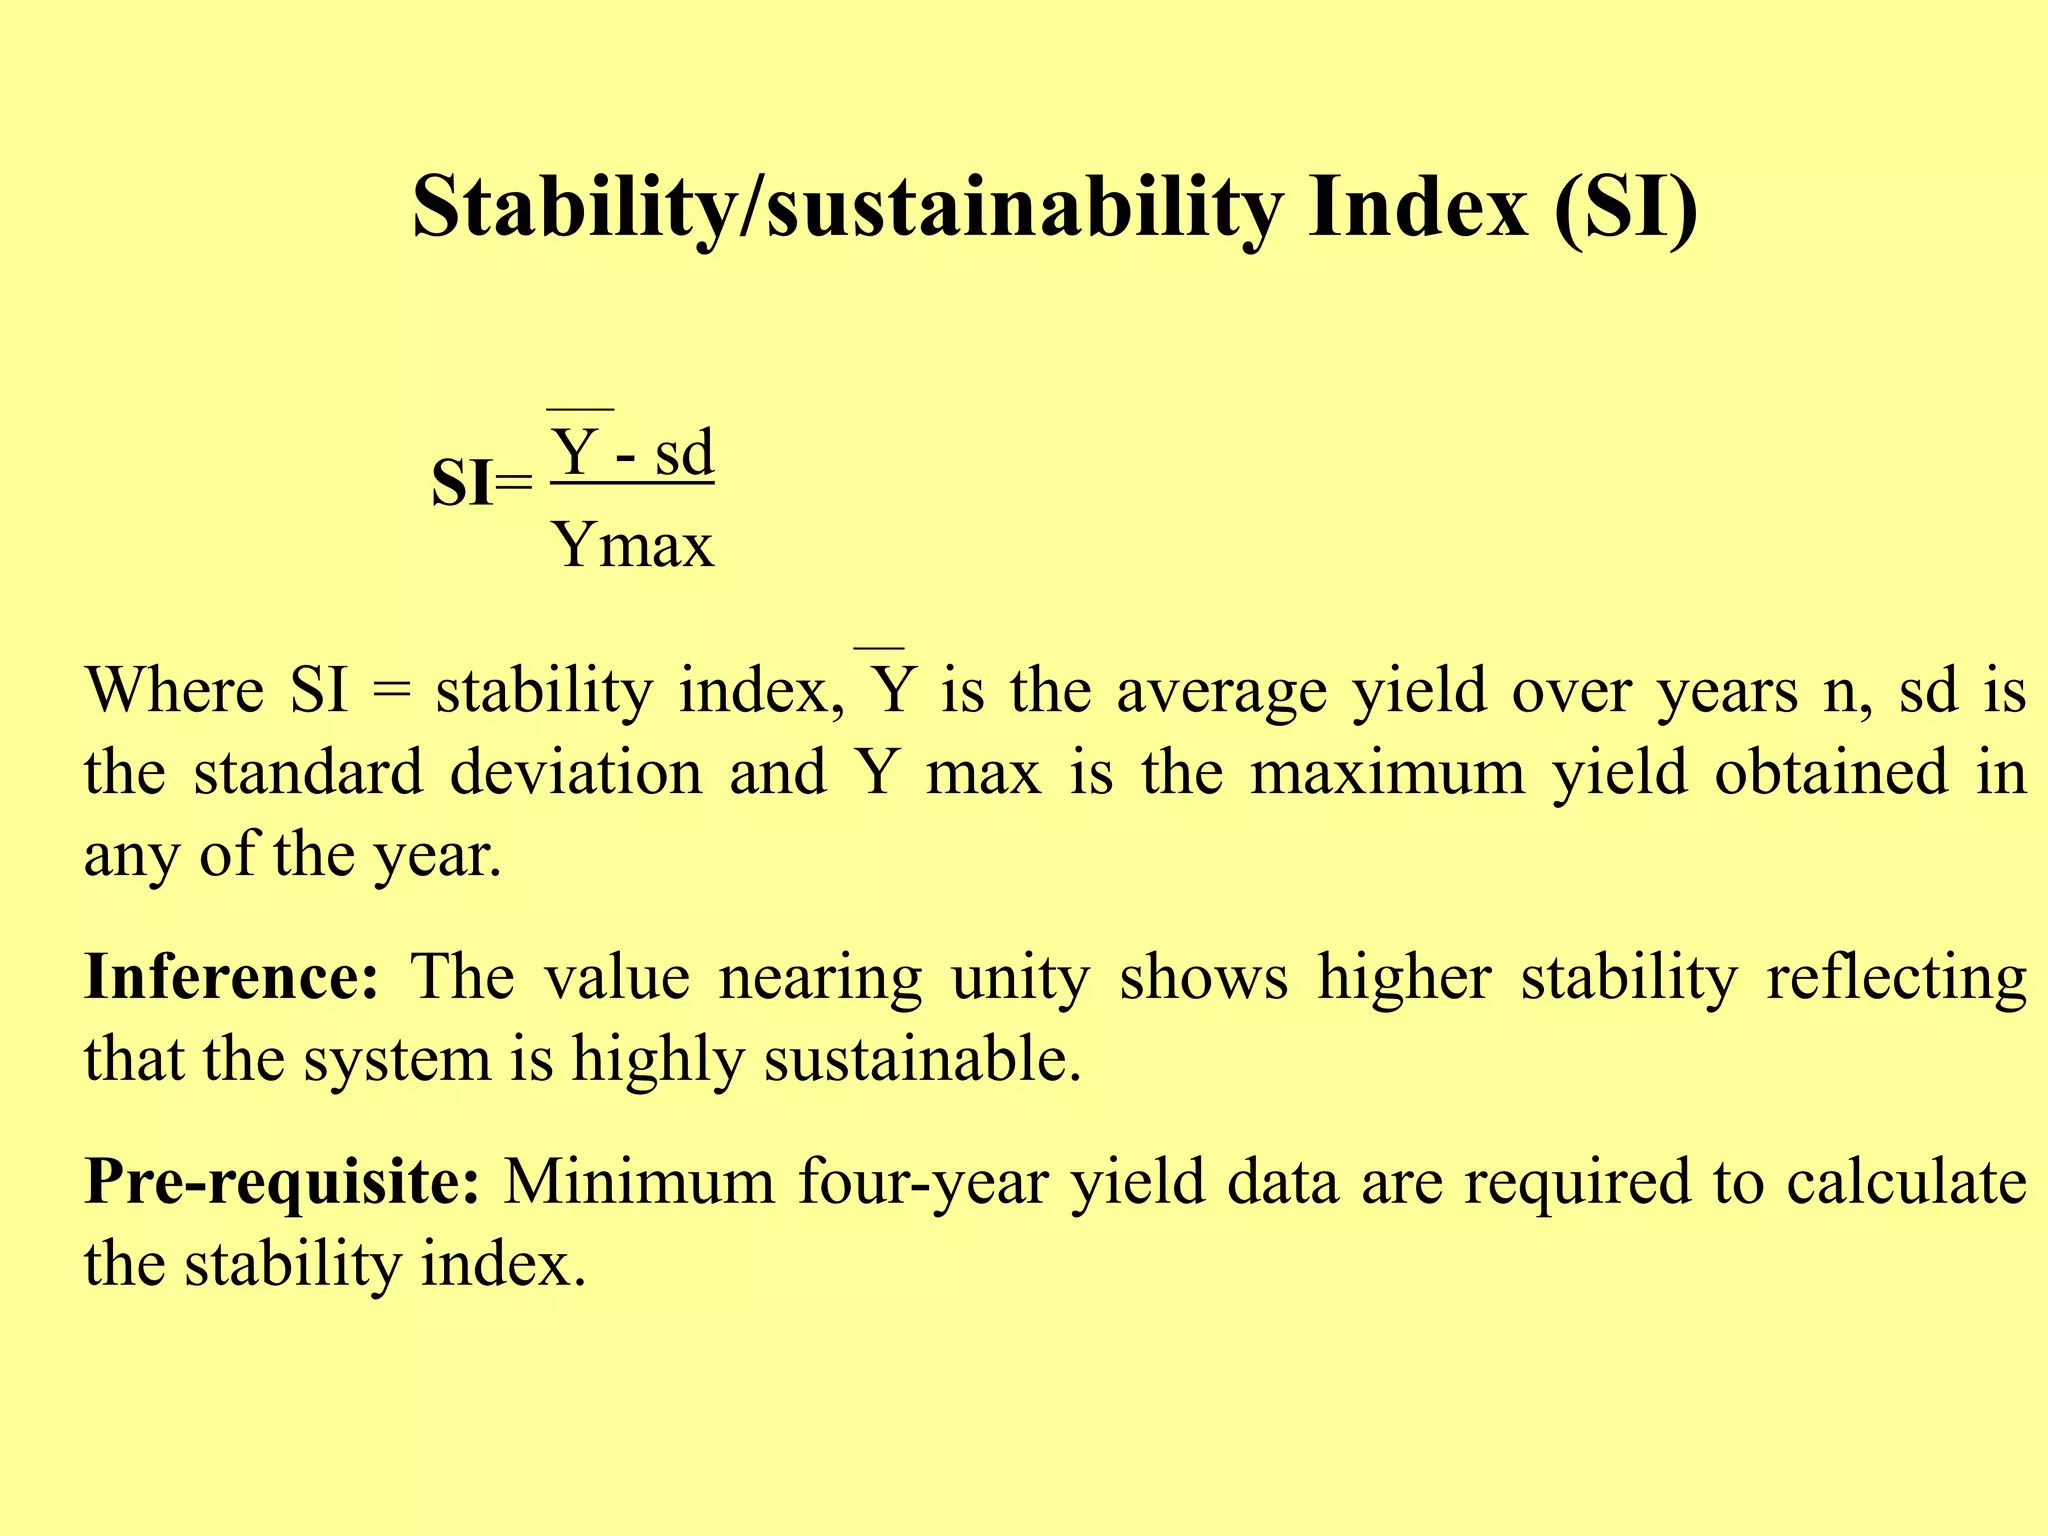
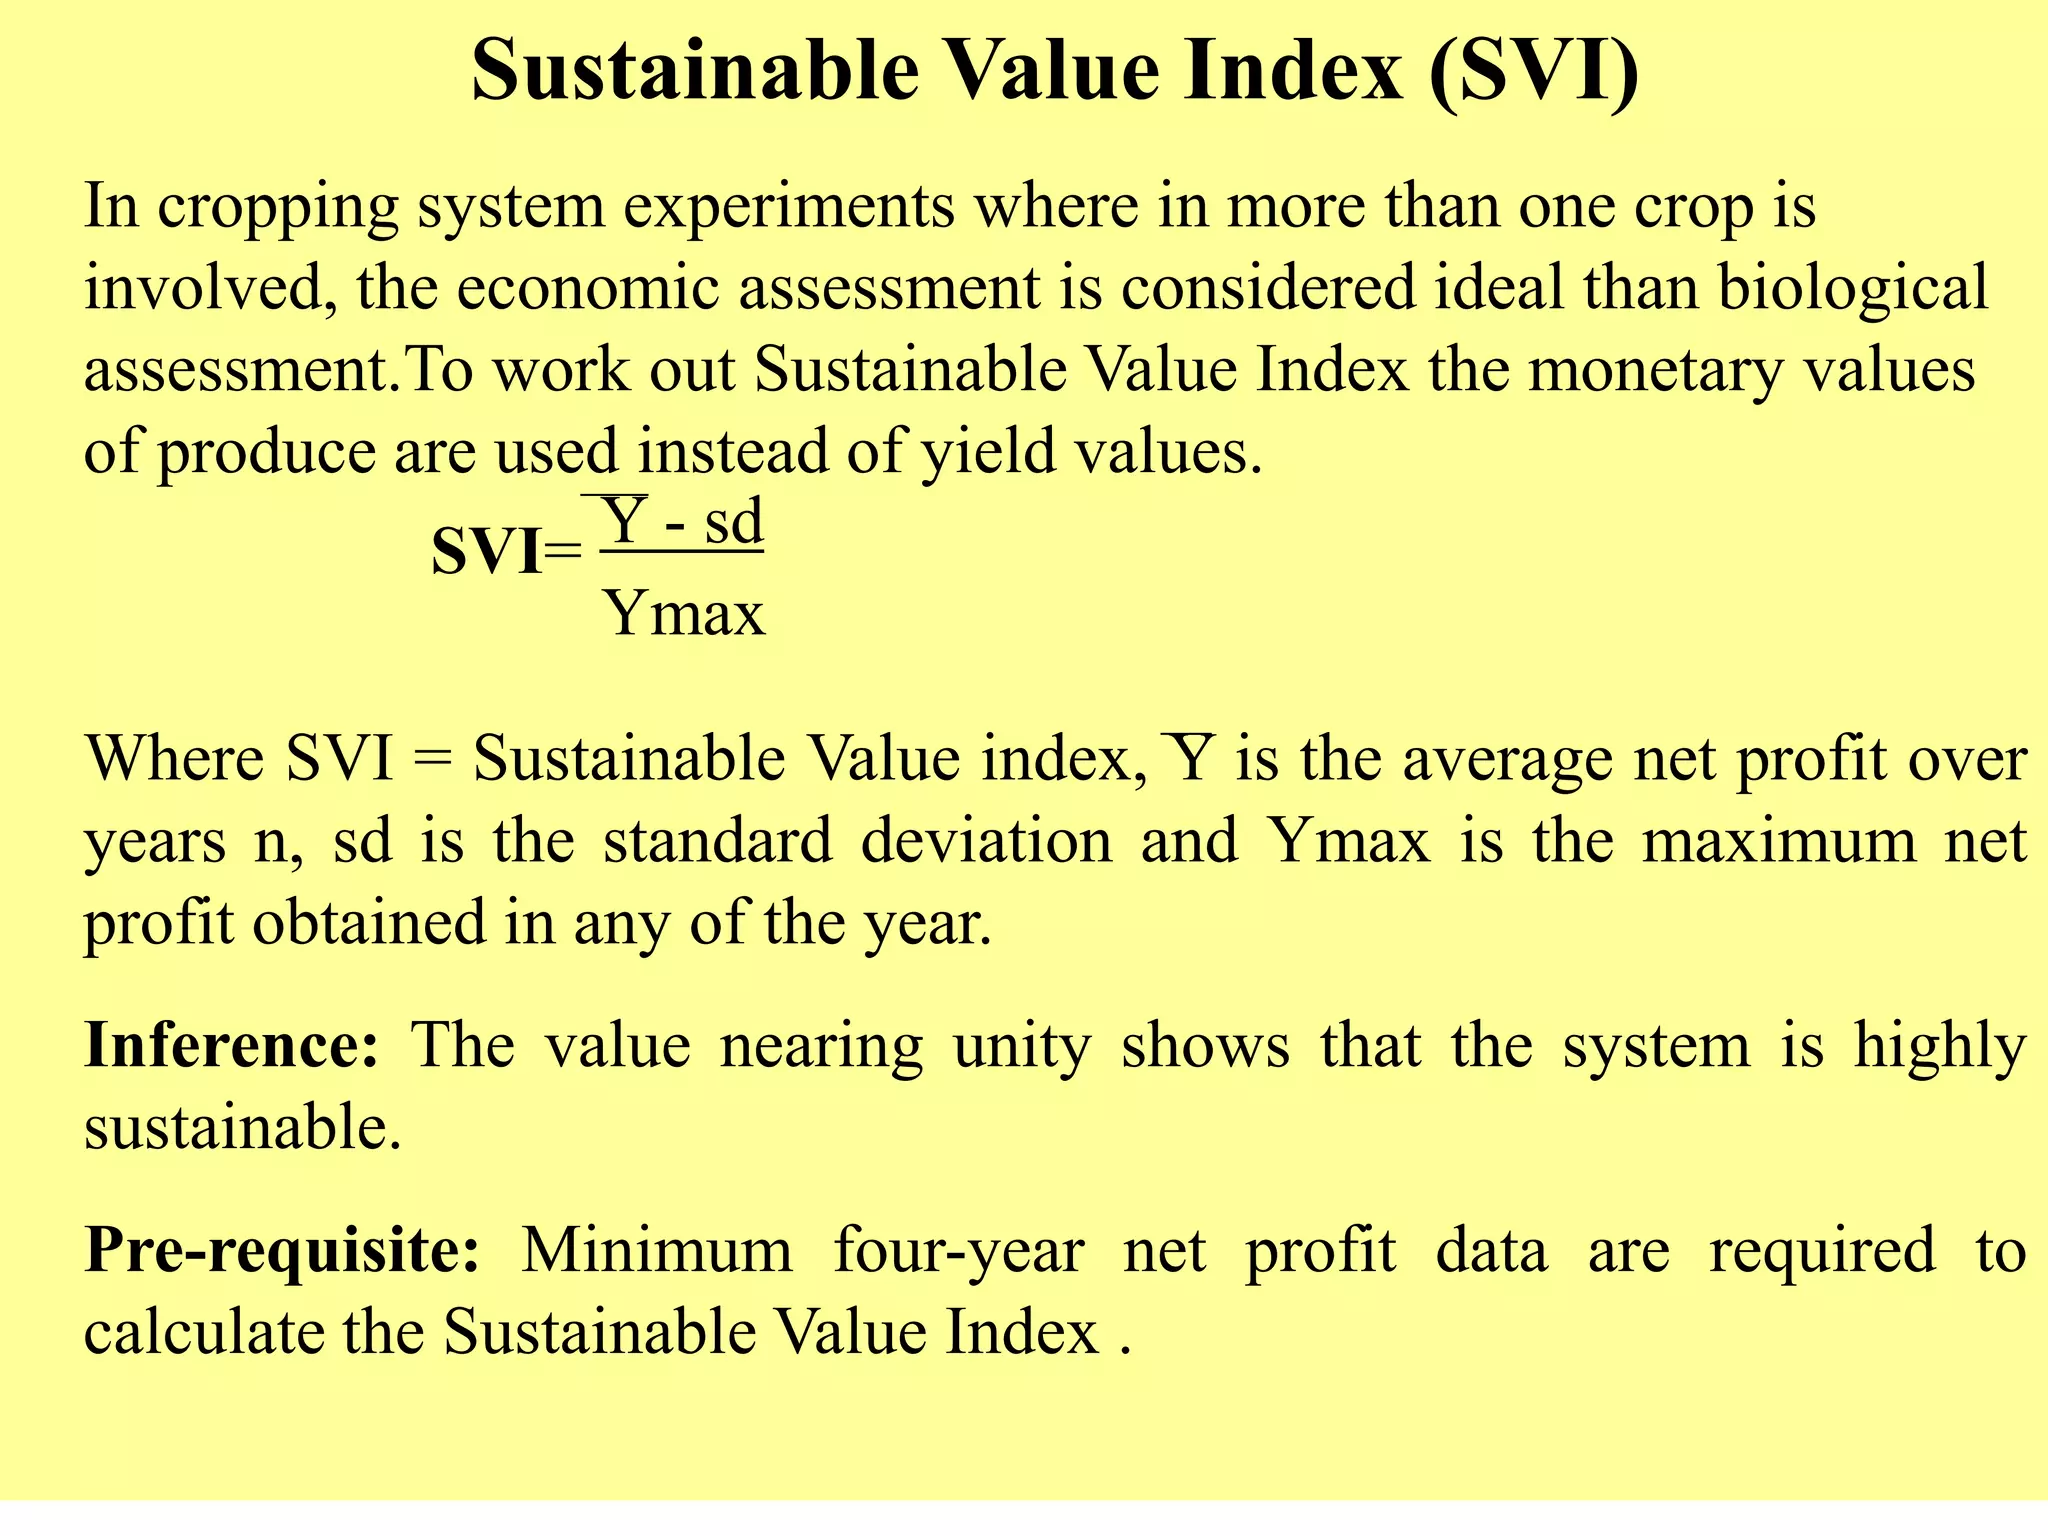
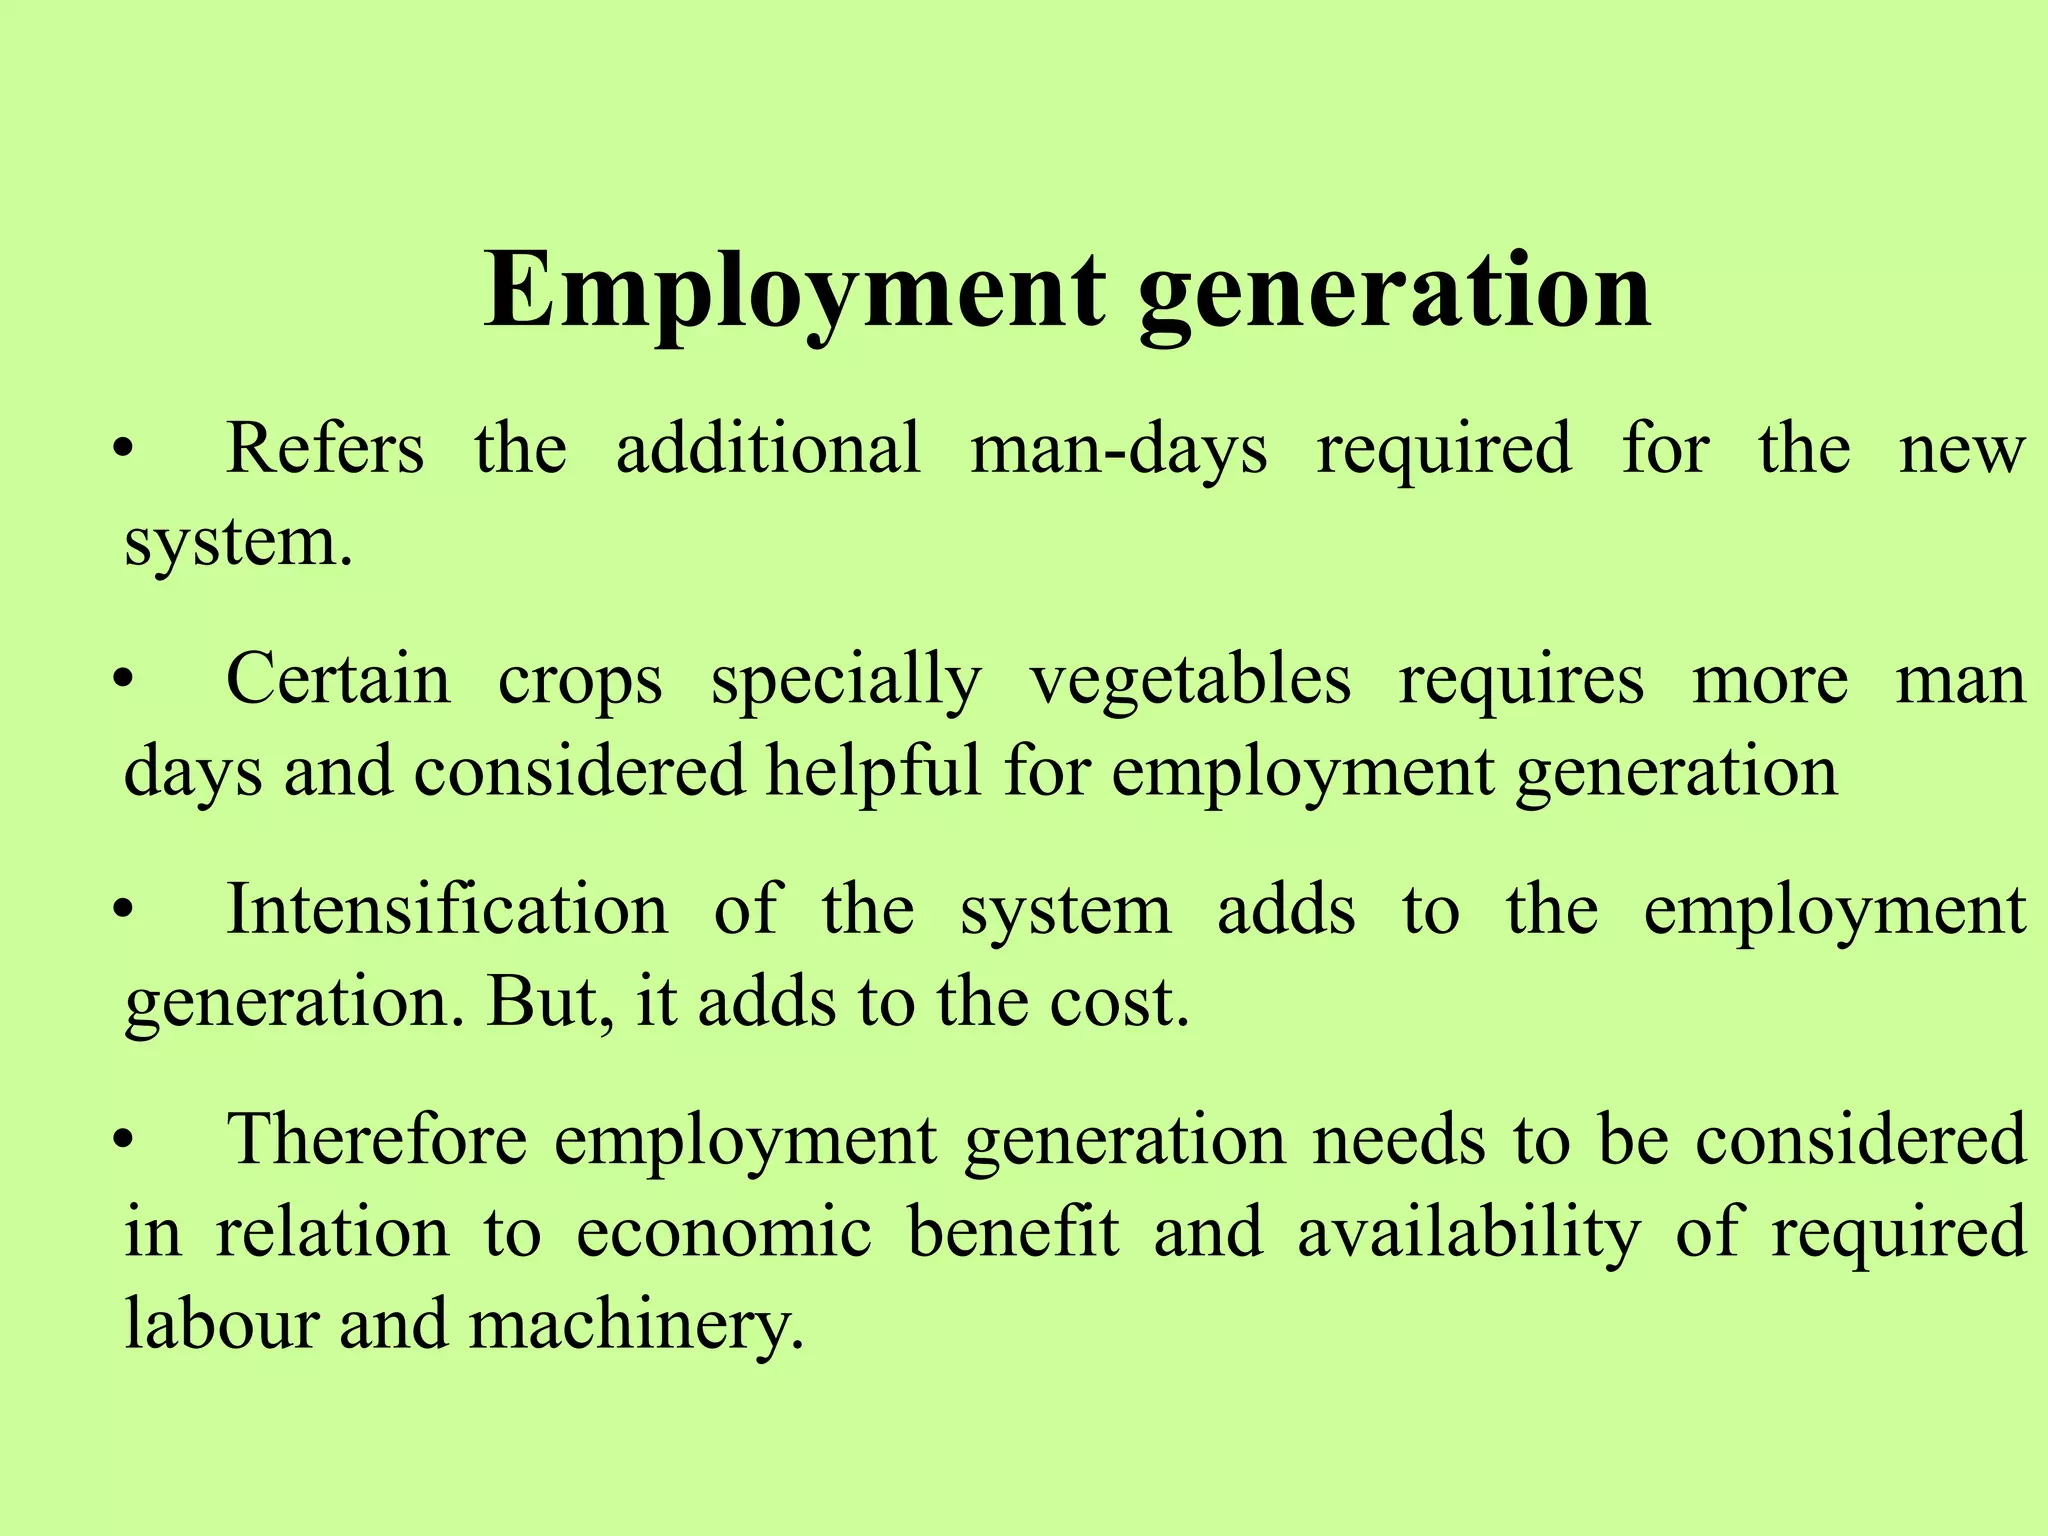
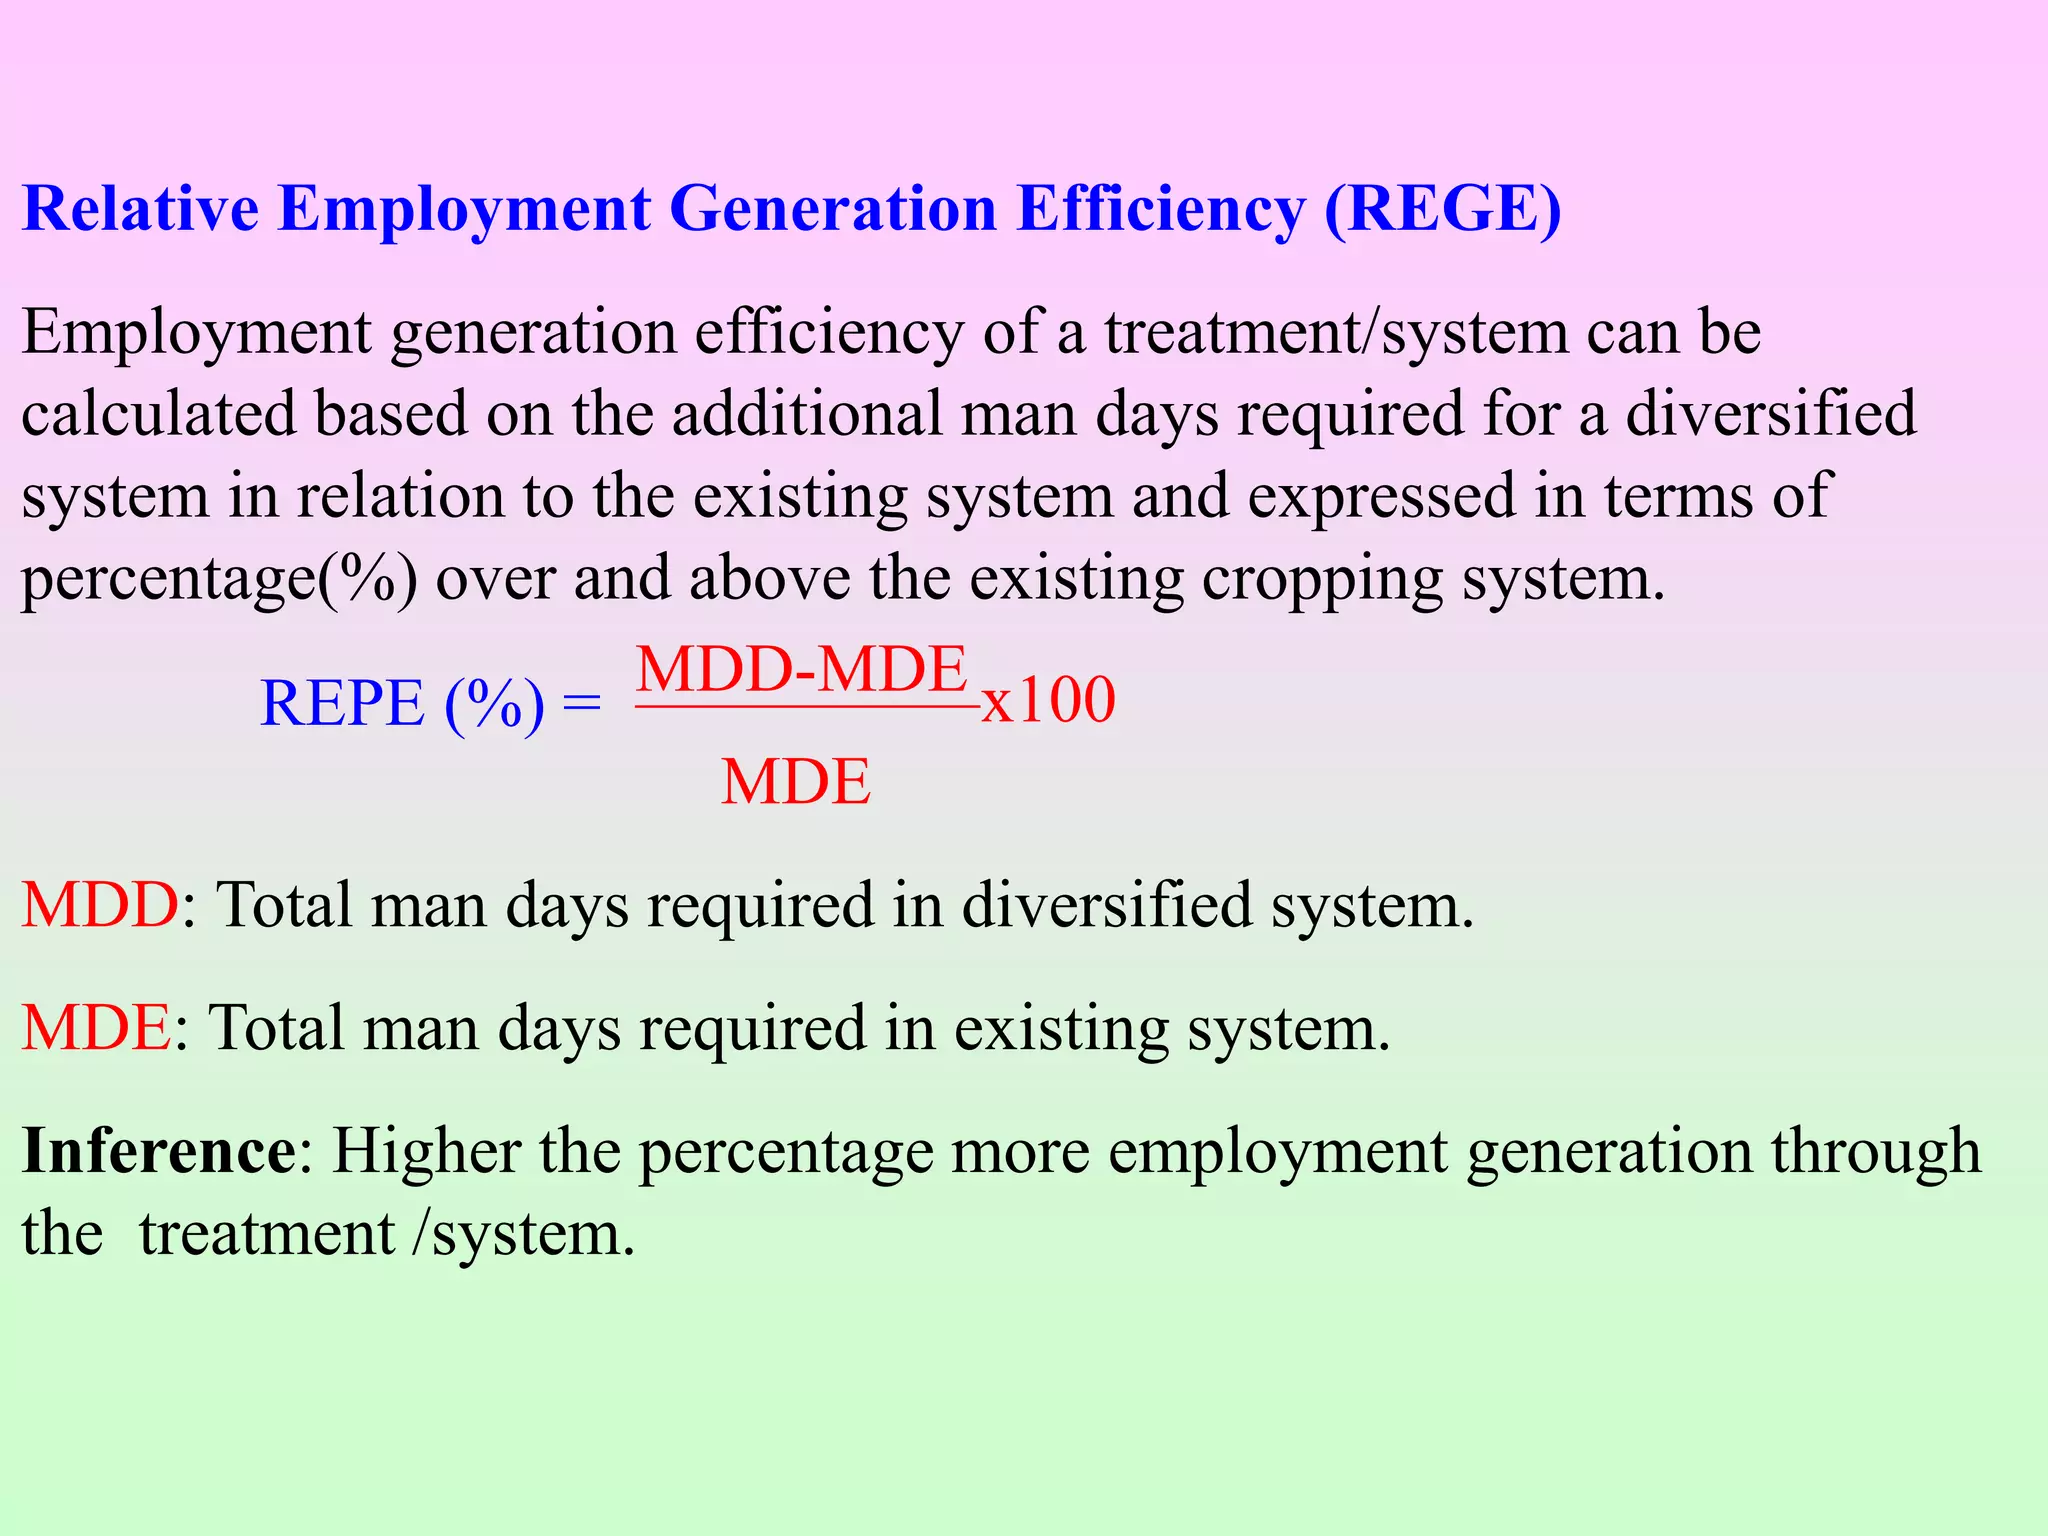
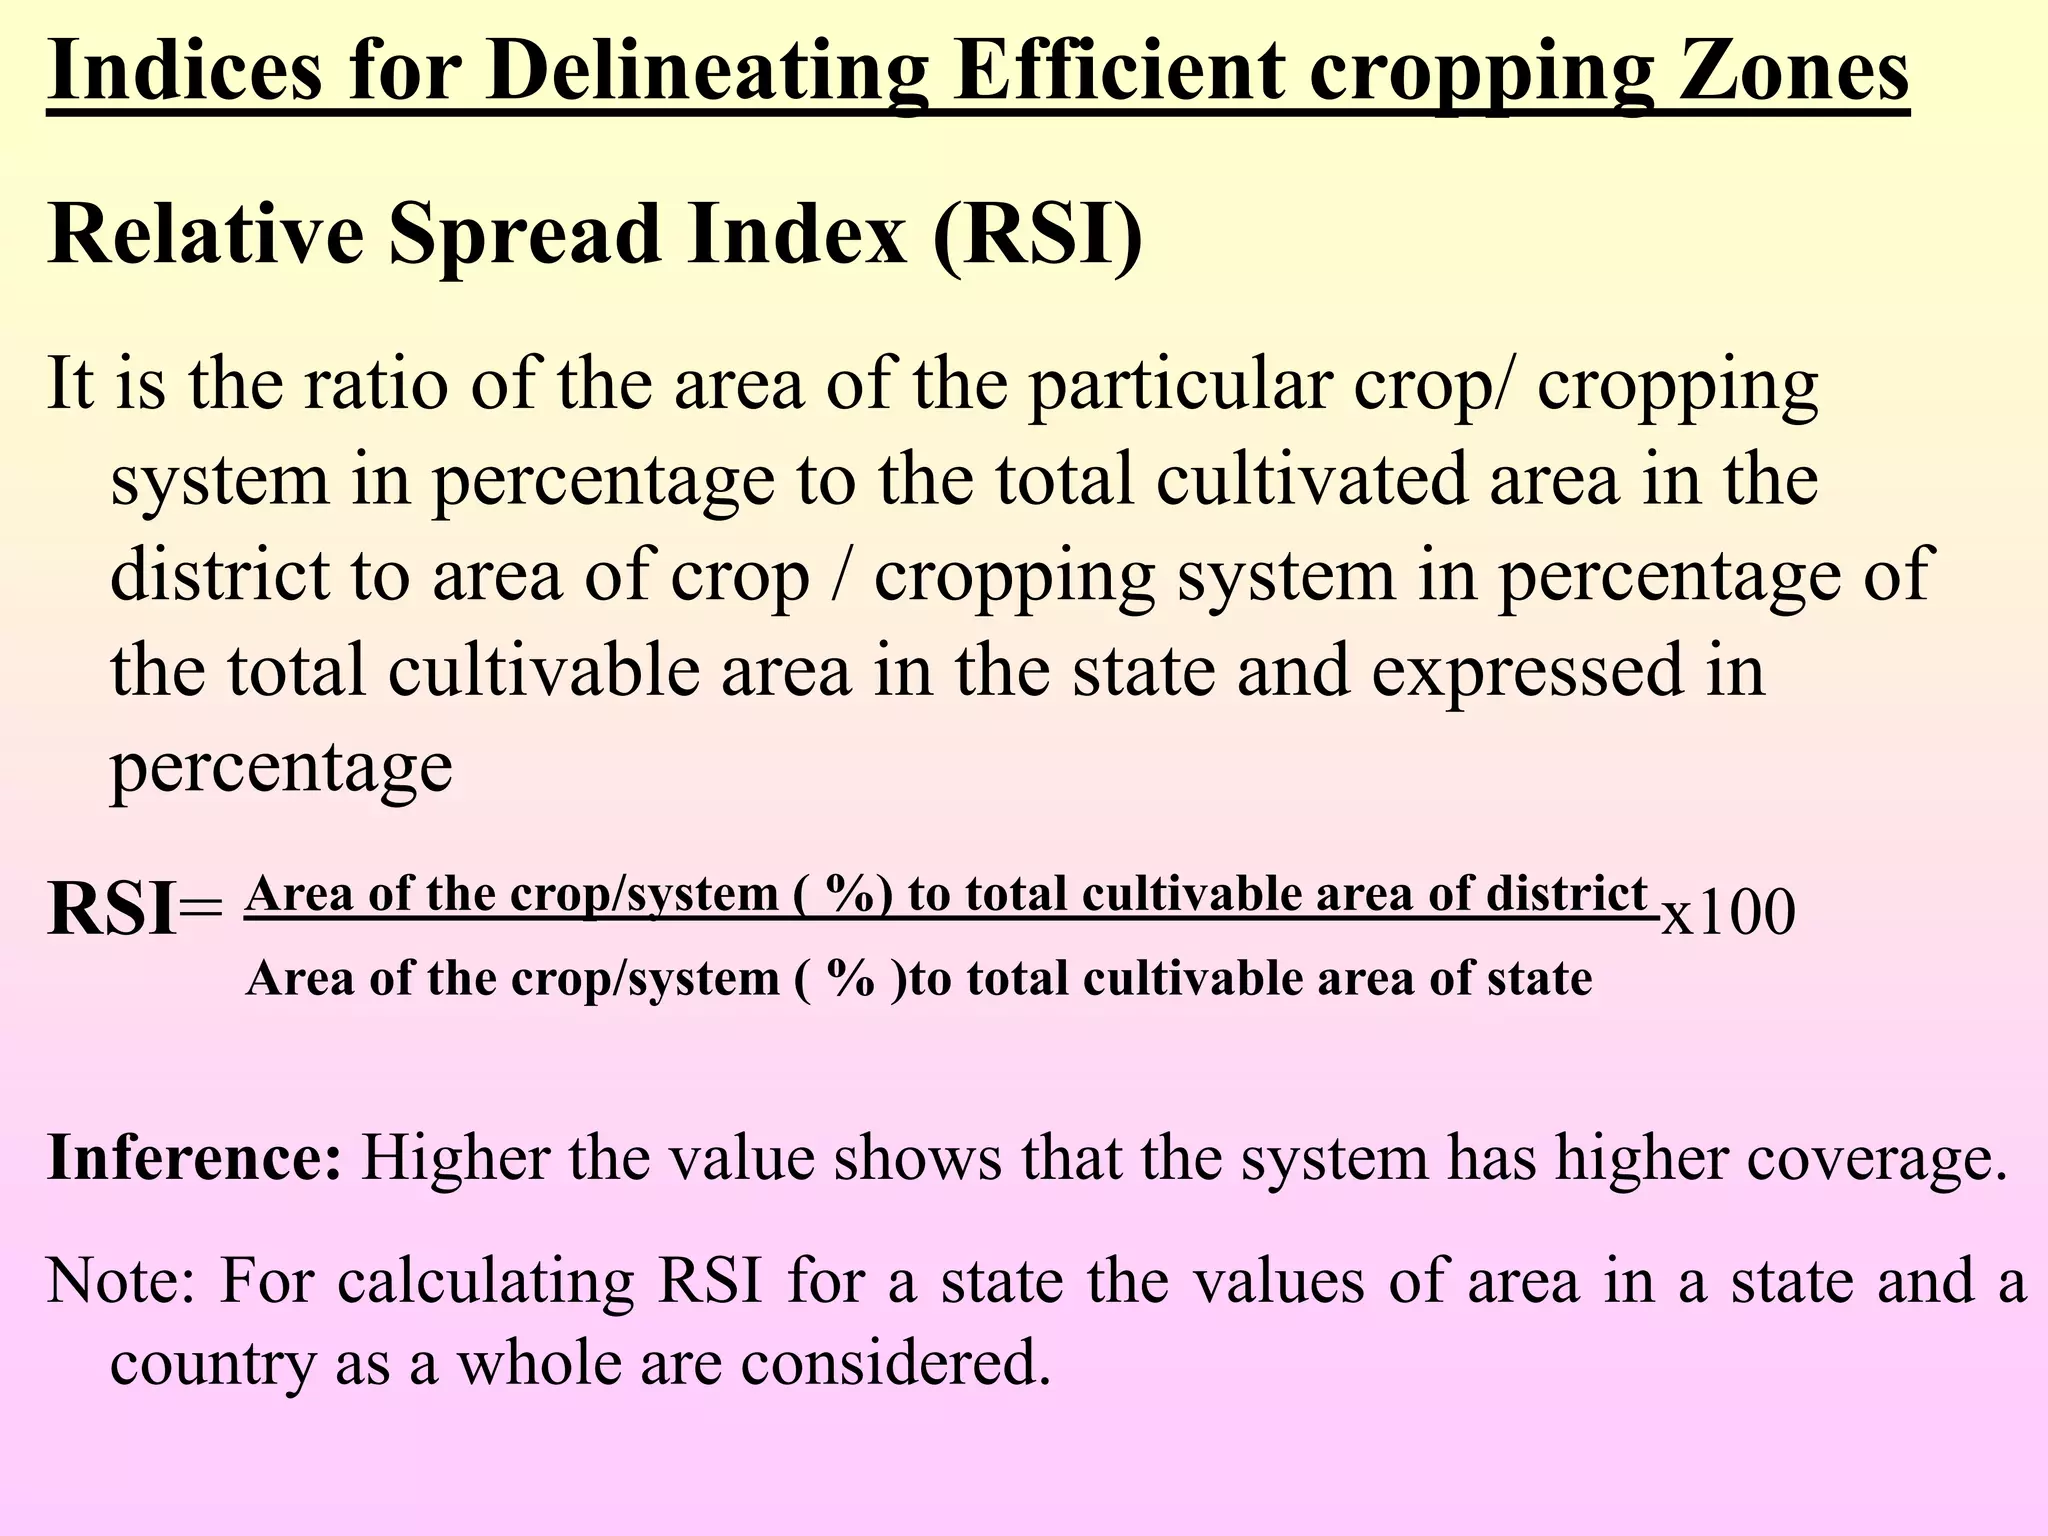
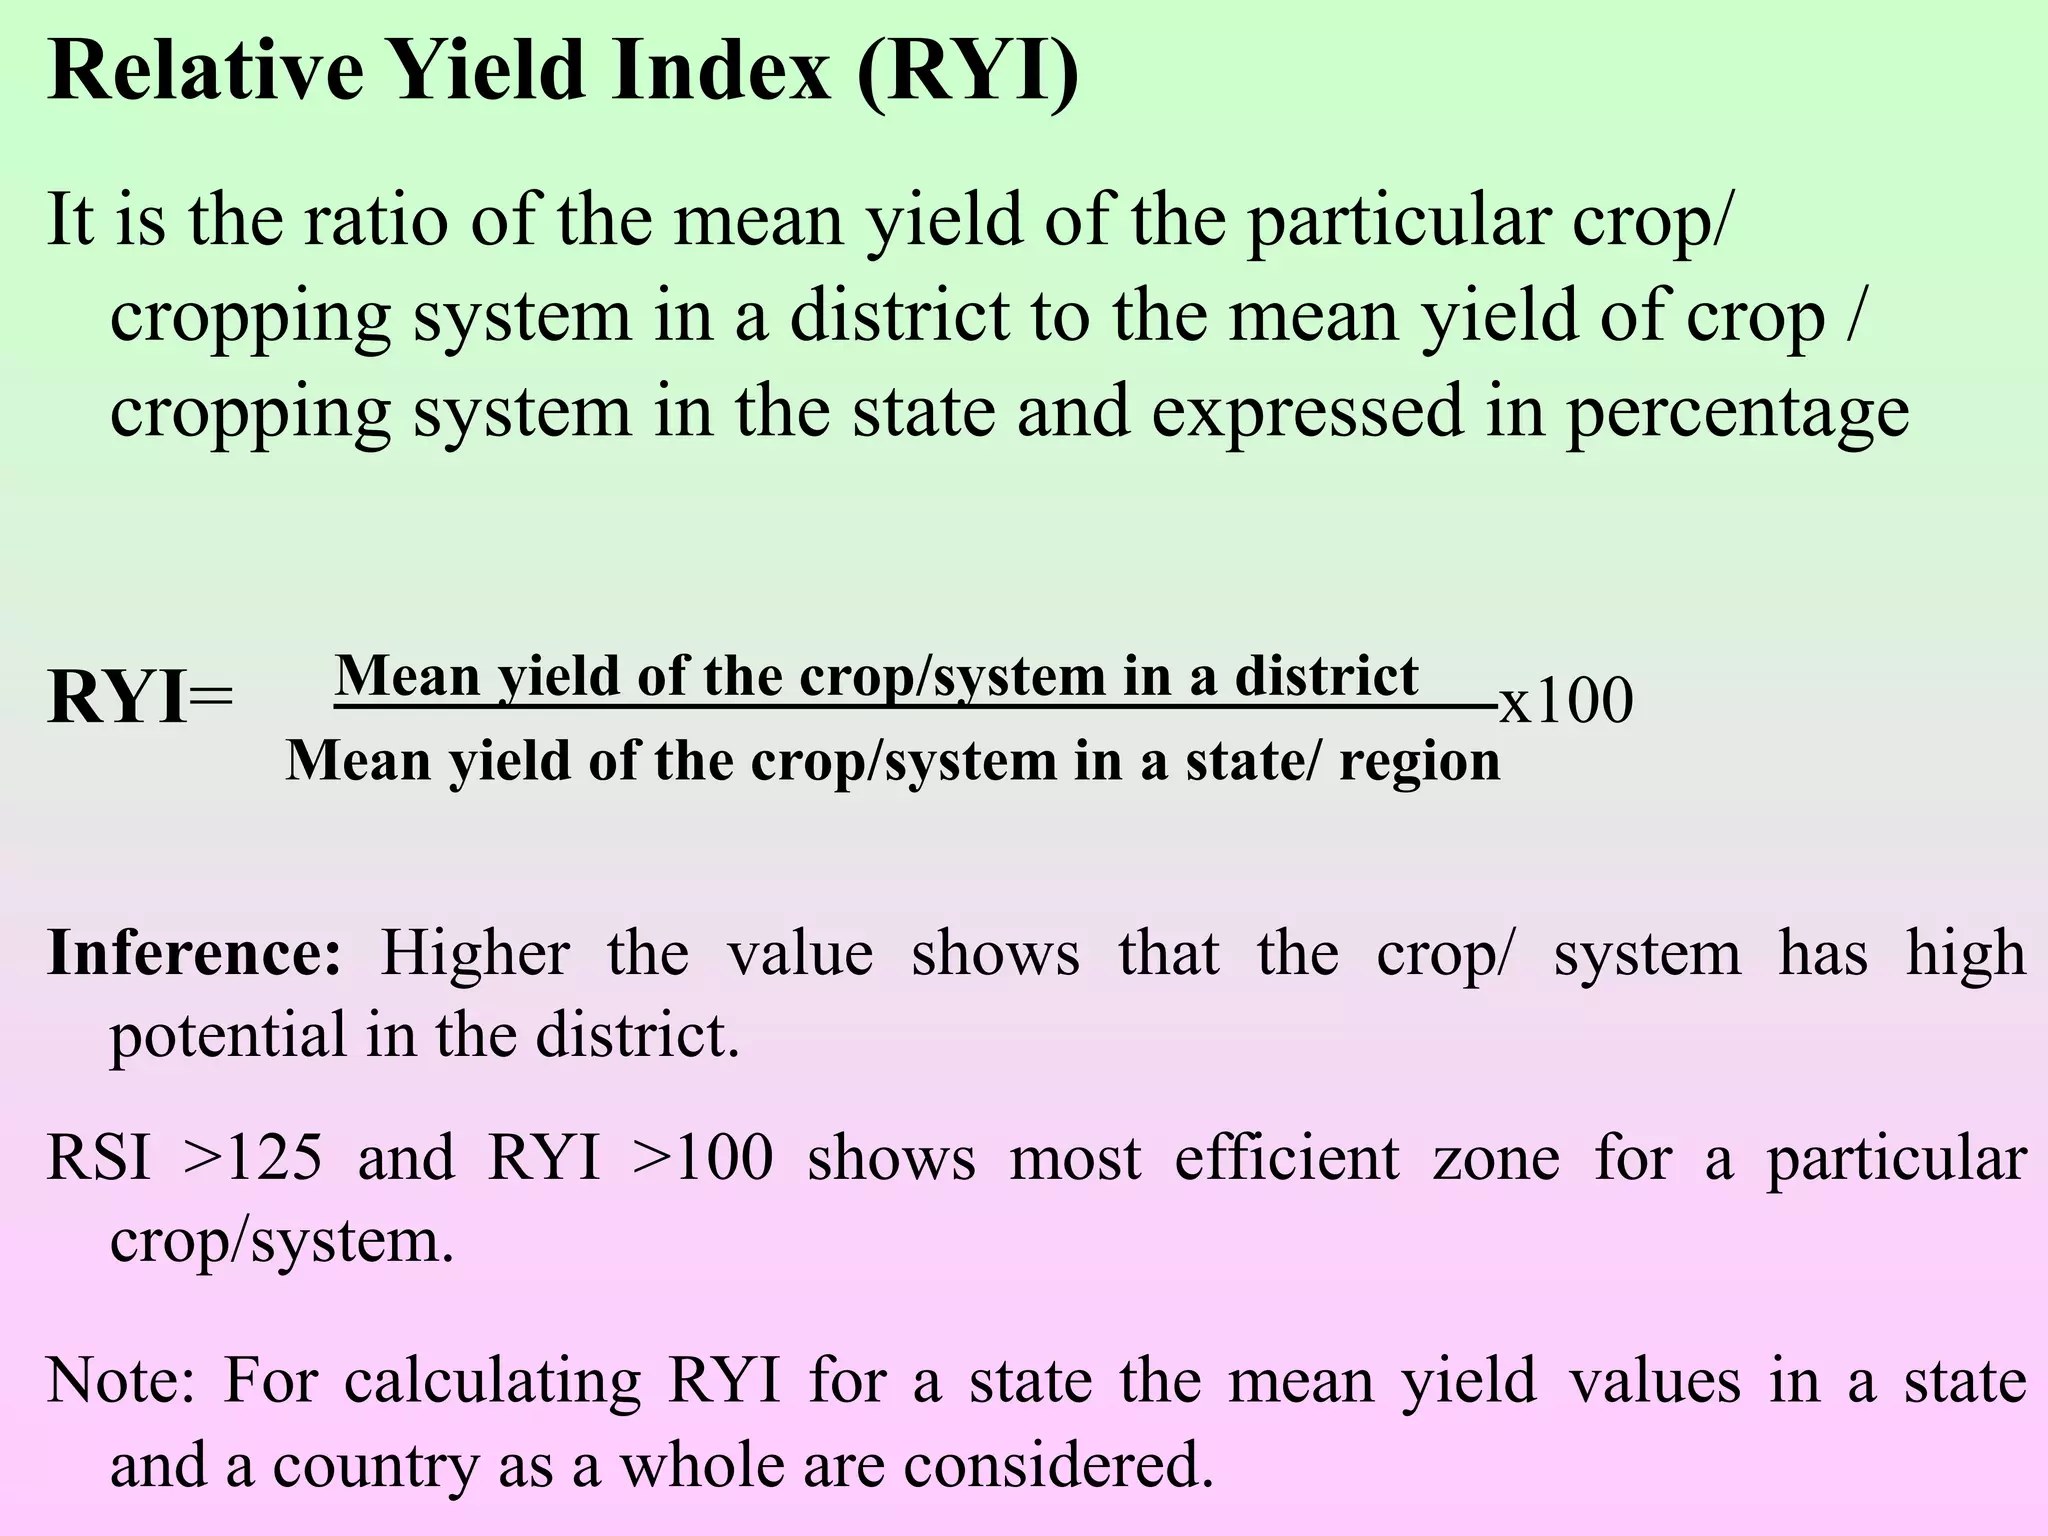
Assessment of Efficiencies in Crops and Cropping
Systems
B. Gangwar
Project Directorate for Farming Systems Research,
Modipuram, Meerut – 250 110 (U.P.)
Cropping Systems Research
Major emphasis since 1990
Perusal of research publications
Focus on production and net return
Many advances in CSR
Organic Farming
INDICATORS OF SYSTEM EFFICIENCY
• Productivity
• Production efficiency
• Land use efficiency
• Energy use and energy production
• Water use productivity
• Nutrient use productivity
• Profitability
• Economic efficiency
• B: C ratio
• Stability/sustainability
• Employment generation
• Soil fertility trend
• Natural weed and pest management
• Environment protection
The Refined Methodologies
Productivity
Crop yield : Crop yield/unit area generally reported as q/ha or t/ha
 Crop productivity(CP). It may be calculated on dividing the yield by
duration of crop.
CP=
Crop yield
Duration of crop
Inference:
A crop showing high crop productivity needs to be
preferred over the low productivity crop for inclusion
in a new system.
System Productivity
Denotes yield/unit area/ unit time. But, the yield here is the equivalent
yield in a single commodity terms. The time here is agricultural year
(365 days). Therefore, the equivalent yield is calculated and divided by
365 and expressed as kg/ha/day.
The equivalent yield should preferably be calculated in terms of kharif
crop (say paddy in rice based cropping system) using the following
formula
∑ Yi.Pi
REY = —―—―
P(p)
Where REY denotes Rice equivalent yield
Yi= yield of different crops
Pi = Price of respective crops
P (p) Price of paddy.
REY
SP = —―—―
365
Where SP denotes system productivity
REY denotes rice equivalent yield
Inference: Higher the productivity shows better the system
Total Factor Productivity:
Total factor productivity means productivity per
unit cost of all factors involved.
n
TFP= P/  (Ri.Ci)
i=1
Where,
P : Total biological production
Ri : Resource used
Ci : Cost of specific input
N : Number of input
Inference: Higher the values more efficiency
Relative Production Efficiency (RPE)
RPE = (EYD-EYE) X 100
EYE
Where EYD denotes the equivalent yield under
improved/diversified system while EYE denotes the existing
system yield.
Inference:
(+) tive figures shows the superiority of the new system over the
existing in percentage and considered desirable.
(-) tive figures shows inferiority over the existing system and not
desirable for any change.
Any positive figures of more than 20% are considered worth
recommending for extension use.
Land use efficiency (LUE)
LUE (%)= TND (i) X100
365
Where TND (i) denotes the total number of days field remained occupied
under different crops (i=1….n)
Inference: Higher the land use efficiency denotes the more use of
the land in a year.
With increase in intensity in cropping system, the land use
efficiency generally improves. However, LUE is not a good
indicator of system efficiency as higher the land use may not
necessarily result in higher output from the system.
It depends more on the contribution of individual crop. Therefore,
have a limitation.
Energy use and energy production
New considerations for judging the system efficiency.
Every input used and outputs obtained are converted in to the form of
energy(MJ).
The standard figures for different inputs as per Binning et al.
(1983) are available for energy analysis. Similarly, the
standard energy conversion figures are available with ICMR
on nutritive value of different crops (Gopalan et al, 1978).
These figures can be utilized for simple conversion of crop
produce into the energy terms (Table-1&2).
The energy aspects of the cropping systems are generally
expressed in MJ/ha.
Inference: A system produces higher output energy and
requires less input energy is considered desirable and
Table1: Energy conversion factors for inputs
Particulars Unit Energy equivalent(MJ)
Human labour (Adult) Man-hour 1.96
Diesel Litre 56.31
Chemical fertilizers
Nitrogen (N) Kg 60.60
Phosphorus (P) Kg 11.10
Potash (K) Kg 6.70
Plant protection (superior)
Granular chemical Kg 120
Liquid chemical ml 0.102
Source: Binning et al. (1983)
Table 2 Energy conservation factors for selected crops
Crop produce (grain) Unit Energy equivalent(MJ)
Rice Kg 14.70
Wheat Kg 15.70
Vegetable Pea Kg 3.91
Greengram Kg 14.03
Maize Kg 15.10
Mustard Kg 22.72
Pigeonpea Kg 14.07
Soybean Kg 18.14
Source: Gopalan et al. (1978)
Energy Efficiency(EE)
Cultural energy utilized through inputs and energy produced
as products are calculated and expressed in Mega Joules
(MJ).
Energy out put (MJ ha-1)
Energy input (MJ ha-1)
Inference: Higher the ratio better the system
EE=
Specific Energy (SE)
Specific energy of a treatment/system can be calculated in
terms of energy required to produce a kg of main product and
expressed in Mega Joules (MJ kg-1).
Energy input (MJ ha-1)
Grain yield (kg ha-1)
Inference: Lower the ratio better the treatment /system
Note: For a cropping system grain yield to be converted into
dominant crop equivalent.
SE=
Energy Productivity(EP)
Energy productivity describes the quantity of physical output
obtained per every unit of input and expressed as kg per
Mega Joules (kg MJ -1).
Out put (grain +by product)(kg ha-1)
Energy input (MJ ha-1)
Inference: Higher the ratio better the system/ treatment
EP=
Apparent water use productivity (AWUP)
The water is becoming a major concern all over the world.
The production even per drop of water is the recent concern
keeping in view the future needs and availability.
Mainly refers the yield / ha cm of water.
The apparent water use productivity (AWUP) may grossly be
calculated using the following formula as used by Gangwar et
al (2005.)
AWUP =
Equivalent yield of a system (Kg/ha)
Total quantity of water used in ha of land in cm
Inference: Higher the AWUP more efficient is the system.
The approach is more useful under declining irrigation
water conditions.
Profitability
Pre-requisites
 Crop wise cost of cultivation
 Sale price of produce (S)
 Gross return (S)
 Duration of crop (S)
Crop profitability (Rs/ha/day)= Net return/ha
No.of days field occupied
System profitability (Rs /ha/day)= Net return/ha/year
365
Inference: Crops and systems which gives higher profitability
are economically beneficial and advisable.
B.C. ratio
B.C. ratio = Gross return ---- Economist point of view
Cost of cultivation
B.C. ratio = Net return ------- Agronomist point of view
Cost of cultivation
Inference: Wider the ratio more the benefit/return on
investment.
Relative Economic Efficiency (REE)
REE (%) = DNR-ENR X 100
ENR
Where DNR denotes net return obtained under
improved/diversified system, while ENR refers to net
return in the existing system.
Inference:
Higher the economic efficiency –better the system
for large scale recommendation.
Stability/sustainability Index (SI)
SI= Y - sd
Ymax
Where SI = stability index, Y is the average yield over years n, sd is
the standard deviation and Y max is the maximum yield obtained in
any of the year.
Inference: The value nearing unity shows higher stability reflecting
that the system is highly sustainable.
Pre-requisite: Minimum four-year yield data are required to calculate
the stability index.
Sustainable Value Index (SVI)
In cropping system experiments where in more than one crop is
involved, the economic assessment is considered ideal than biological
assessment.To work out Sustainable Value Index the monetary values
of produce are used instead of yield values.
SVI= Y - sd
Ymax
Where SVI = Sustainable Value index, Y is the average net profit over
years n, sd is the standard deviation and Ymax is the maximum net
profit obtained in any of the year.
Inference: The value nearing unity shows that the system is highly
sustainable.
Pre-requisite: Minimum four-year net profit data are required to
calculate the Sustainable Value Index .
Employment generation
• Refers the additional man-days required for the new
system.
• Certain crops specially vegetables requires more man
days and considered helpful for employment generation
• Intensification of the system adds to the employment
generation. But, it adds to the cost.
• Therefore employment generation needs to be considered
in relation to economic benefit and availability of required
labour and machinery.
Relative Employment Generation Efficiency (REGE)
Employment generation efficiency of a treatment/system can be
calculated based on the additional man days required for a diversified
system in relation to the existing system and expressed in terms of
percentage(%) over and above the existing cropping system.
MDD-MDE x100
MDE
MDD: Total man days required in diversified system.
MDE: Total man days required in existing system.
Inference: Higher the percentage more employment generation through
the treatment /system.
REPE (%) =
Soil fertility trend
Soil fertility trend over the years is considered to be a good indicator
of system efficiency .
A system, which maintains or helps in build up of soil fertility with
use of recommended doses of nutrients is considered to be efficient
system compared to a system which causes imbalances and affects
the soil adversely.
Legumes plays positive role in soil fertility maintenance.
The initial and final soil fertility status over a minimum period of
four years can indicate the system efficiency in respect of soil health.
Natural Weed and Pest Management
 Weed population
 Changing monotomy and flora
 Reduction in weeds, pest and diseases
Example:
 Berseem instead of wheat once in three years during rabi
minimizes the build up of phalaris minor for next two years.
 Intercropping coriander with sugarcane prevents top borer attack
in sugarcane.
Indices for Delineating Efficient cropping Zones
Relative Spread Index (RSI)
It is the ratio of the area of the particular crop/ cropping
system in percentage to the total cultivated area in the
district to area of crop / cropping system in percentage of
the total cultivable area in the state and expressed in
percentage
RSI= Area of the crop/system ( %) to total cultivable area of district x100
Area of the crop/system ( % )to total cultivable area of state
Inference: Higher the value shows that the system has higher coverage.
Note: For calculating RSI for a state the values of area in a state and a
country as a whole are considered.
Relative Yield Index (RYI)
It is the ratio of the mean yield of the particular crop/
cropping system in a district to the mean yield of crop /
cropping system in the state and expressed in percentage
RYI= Mean yield of the crop/system in a district x100
Mean yield of the crop/system in a state/ region
Inference: Higher the value shows that the crop/ system has high
potential in the district.
RSI >125 and RYI >100 shows most efficient zone for a particular
crop/system.
Note: For calculating RYI for a state the mean yield values in a state
and a country as a whole are considered.
Conclusions
With the help of indices one can identify:
Most productive crops/ cropping systems .
 Resource efficient crops/ cropping systems.
 Optimize energy use efficiencies.
Quantify the comparative advantages of selected
crops/ cropping systems.
Delineate efficient/ most productive areas/ zones.
Statistical methods

Statistical methods

  • 1.
    Assessment of Efficienciesin Crops and Cropping Systems B. Gangwar Project Directorate for Farming Systems Research, Modipuram, Meerut – 250 110 (U.P.)
  • 2.
    Cropping Systems Research Majoremphasis since 1990 Perusal of research publications Focus on production and net return Many advances in CSR Organic Farming
  • 3.
    INDICATORS OF SYSTEMEFFICIENCY • Productivity • Production efficiency • Land use efficiency • Energy use and energy production • Water use productivity • Nutrient use productivity
  • 4.
    • Profitability • Economicefficiency • B: C ratio • Stability/sustainability • Employment generation • Soil fertility trend • Natural weed and pest management • Environment protection
  • 5.
  • 6.
    Productivity Crop yield :Crop yield/unit area generally reported as q/ha or t/ha  Crop productivity(CP). It may be calculated on dividing the yield by duration of crop. CP= Crop yield Duration of crop Inference: A crop showing high crop productivity needs to be preferred over the low productivity crop for inclusion in a new system.
  • 7.
    System Productivity Denotes yield/unitarea/ unit time. But, the yield here is the equivalent yield in a single commodity terms. The time here is agricultural year (365 days). Therefore, the equivalent yield is calculated and divided by 365 and expressed as kg/ha/day. The equivalent yield should preferably be calculated in terms of kharif crop (say paddy in rice based cropping system) using the following formula ∑ Yi.Pi REY = —―—― P(p) Where REY denotes Rice equivalent yield Yi= yield of different crops Pi = Price of respective crops P (p) Price of paddy.
  • 8.
    REY SP = —―—― 365 WhereSP denotes system productivity REY denotes rice equivalent yield Inference: Higher the productivity shows better the system
  • 9.
    Total Factor Productivity: Totalfactor productivity means productivity per unit cost of all factors involved. n TFP= P/  (Ri.Ci) i=1 Where, P : Total biological production Ri : Resource used Ci : Cost of specific input N : Number of input Inference: Higher the values more efficiency
  • 10.
    Relative Production Efficiency(RPE) RPE = (EYD-EYE) X 100 EYE Where EYD denotes the equivalent yield under improved/diversified system while EYE denotes the existing system yield. Inference: (+) tive figures shows the superiority of the new system over the existing in percentage and considered desirable. (-) tive figures shows inferiority over the existing system and not desirable for any change. Any positive figures of more than 20% are considered worth recommending for extension use.
  • 11.
    Land use efficiency(LUE) LUE (%)= TND (i) X100 365 Where TND (i) denotes the total number of days field remained occupied under different crops (i=1….n) Inference: Higher the land use efficiency denotes the more use of the land in a year. With increase in intensity in cropping system, the land use efficiency generally improves. However, LUE is not a good indicator of system efficiency as higher the land use may not necessarily result in higher output from the system. It depends more on the contribution of individual crop. Therefore, have a limitation.
  • 12.
    Energy use andenergy production New considerations for judging the system efficiency. Every input used and outputs obtained are converted in to the form of energy(MJ). The standard figures for different inputs as per Binning et al. (1983) are available for energy analysis. Similarly, the standard energy conversion figures are available with ICMR on nutritive value of different crops (Gopalan et al, 1978). These figures can be utilized for simple conversion of crop produce into the energy terms (Table-1&2). The energy aspects of the cropping systems are generally expressed in MJ/ha. Inference: A system produces higher output energy and requires less input energy is considered desirable and
  • 13.
    Table1: Energy conversionfactors for inputs Particulars Unit Energy equivalent(MJ) Human labour (Adult) Man-hour 1.96 Diesel Litre 56.31 Chemical fertilizers Nitrogen (N) Kg 60.60 Phosphorus (P) Kg 11.10 Potash (K) Kg 6.70 Plant protection (superior) Granular chemical Kg 120 Liquid chemical ml 0.102 Source: Binning et al. (1983)
  • 14.
    Table 2 Energyconservation factors for selected crops Crop produce (grain) Unit Energy equivalent(MJ) Rice Kg 14.70 Wheat Kg 15.70 Vegetable Pea Kg 3.91 Greengram Kg 14.03 Maize Kg 15.10 Mustard Kg 22.72 Pigeonpea Kg 14.07 Soybean Kg 18.14 Source: Gopalan et al. (1978)
  • 15.
    Energy Efficiency(EE) Cultural energyutilized through inputs and energy produced as products are calculated and expressed in Mega Joules (MJ). Energy out put (MJ ha-1) Energy input (MJ ha-1) Inference: Higher the ratio better the system EE=
  • 16.
    Specific Energy (SE) Specificenergy of a treatment/system can be calculated in terms of energy required to produce a kg of main product and expressed in Mega Joules (MJ kg-1). Energy input (MJ ha-1) Grain yield (kg ha-1) Inference: Lower the ratio better the treatment /system Note: For a cropping system grain yield to be converted into dominant crop equivalent. SE=
  • 17.
    Energy Productivity(EP) Energy productivitydescribes the quantity of physical output obtained per every unit of input and expressed as kg per Mega Joules (kg MJ -1). Out put (grain +by product)(kg ha-1) Energy input (MJ ha-1) Inference: Higher the ratio better the system/ treatment EP=
  • 18.
    Apparent water useproductivity (AWUP) The water is becoming a major concern all over the world. The production even per drop of water is the recent concern keeping in view the future needs and availability. Mainly refers the yield / ha cm of water. The apparent water use productivity (AWUP) may grossly be calculated using the following formula as used by Gangwar et al (2005.) AWUP = Equivalent yield of a system (Kg/ha) Total quantity of water used in ha of land in cm Inference: Higher the AWUP more efficient is the system. The approach is more useful under declining irrigation water conditions.
  • 19.
    Profitability Pre-requisites  Crop wisecost of cultivation  Sale price of produce (S)  Gross return (S)  Duration of crop (S) Crop profitability (Rs/ha/day)= Net return/ha No.of days field occupied System profitability (Rs /ha/day)= Net return/ha/year 365 Inference: Crops and systems which gives higher profitability are economically beneficial and advisable.
  • 20.
    B.C. ratio B.C. ratio= Gross return ---- Economist point of view Cost of cultivation B.C. ratio = Net return ------- Agronomist point of view Cost of cultivation Inference: Wider the ratio more the benefit/return on investment.
  • 21.
    Relative Economic Efficiency(REE) REE (%) = DNR-ENR X 100 ENR Where DNR denotes net return obtained under improved/diversified system, while ENR refers to net return in the existing system. Inference: Higher the economic efficiency –better the system for large scale recommendation.
  • 22.
    Stability/sustainability Index (SI) SI=Y - sd Ymax Where SI = stability index, Y is the average yield over years n, sd is the standard deviation and Y max is the maximum yield obtained in any of the year. Inference: The value nearing unity shows higher stability reflecting that the system is highly sustainable. Pre-requisite: Minimum four-year yield data are required to calculate the stability index.
  • 23.
    Sustainable Value Index(SVI) In cropping system experiments where in more than one crop is involved, the economic assessment is considered ideal than biological assessment.To work out Sustainable Value Index the monetary values of produce are used instead of yield values. SVI= Y - sd Ymax Where SVI = Sustainable Value index, Y is the average net profit over years n, sd is the standard deviation and Ymax is the maximum net profit obtained in any of the year. Inference: The value nearing unity shows that the system is highly sustainable. Pre-requisite: Minimum four-year net profit data are required to calculate the Sustainable Value Index .
  • 24.
    Employment generation • Refersthe additional man-days required for the new system. • Certain crops specially vegetables requires more man days and considered helpful for employment generation • Intensification of the system adds to the employment generation. But, it adds to the cost. • Therefore employment generation needs to be considered in relation to economic benefit and availability of required labour and machinery.
  • 25.
    Relative Employment GenerationEfficiency (REGE) Employment generation efficiency of a treatment/system can be calculated based on the additional man days required for a diversified system in relation to the existing system and expressed in terms of percentage(%) over and above the existing cropping system. MDD-MDE x100 MDE MDD: Total man days required in diversified system. MDE: Total man days required in existing system. Inference: Higher the percentage more employment generation through the treatment /system. REPE (%) =
  • 26.
    Soil fertility trend Soilfertility trend over the years is considered to be a good indicator of system efficiency . A system, which maintains or helps in build up of soil fertility with use of recommended doses of nutrients is considered to be efficient system compared to a system which causes imbalances and affects the soil adversely. Legumes plays positive role in soil fertility maintenance. The initial and final soil fertility status over a minimum period of four years can indicate the system efficiency in respect of soil health.
  • 27.
    Natural Weed andPest Management  Weed population  Changing monotomy and flora  Reduction in weeds, pest and diseases Example:  Berseem instead of wheat once in three years during rabi minimizes the build up of phalaris minor for next two years.  Intercropping coriander with sugarcane prevents top borer attack in sugarcane.
  • 28.
    Indices for DelineatingEfficient cropping Zones Relative Spread Index (RSI) It is the ratio of the area of the particular crop/ cropping system in percentage to the total cultivated area in the district to area of crop / cropping system in percentage of the total cultivable area in the state and expressed in percentage RSI= Area of the crop/system ( %) to total cultivable area of district x100 Area of the crop/system ( % )to total cultivable area of state Inference: Higher the value shows that the system has higher coverage. Note: For calculating RSI for a state the values of area in a state and a country as a whole are considered.
  • 29.
    Relative Yield Index(RYI) It is the ratio of the mean yield of the particular crop/ cropping system in a district to the mean yield of crop / cropping system in the state and expressed in percentage RYI= Mean yield of the crop/system in a district x100 Mean yield of the crop/system in a state/ region Inference: Higher the value shows that the crop/ system has high potential in the district. RSI >125 and RYI >100 shows most efficient zone for a particular crop/system. Note: For calculating RYI for a state the mean yield values in a state and a country as a whole are considered.
  • 30.
    Conclusions With the helpof indices one can identify: Most productive crops/ cropping systems .  Resource efficient crops/ cropping systems.  Optimize energy use efficiencies. Quantify the comparative advantages of selected crops/ cropping systems. Delineate efficient/ most productive areas/ zones.