HPAU, Palampur,
Himachal Pradesh
Farming System Approach For Food
Security And Sustained Rural Economy


                    Speaker - Sandeep Singh
Introduction
 INDIAN agriculture has challenge of providing national as well as
    household food and nutritional security to its teeming millions

      in a scenario of plateauing genetic potential in all major
     crops.
      declining productivity in vast tracts of rainfed/ dryland areas
        constituting approximately 44.2% of net cultivated area.


 Wide-spread occurrence of ill-effects of green revolution
technologies      in all intensively cultivated areas is threatening the
sustainability of the important agricultural production systems and
national food security.


.
The human population of India has increased to 1210.2
million at a growth rate of 1.76 per cent in 2011 and is
estimated to increase further to 1530 million by 2030.

On the other hand our national food grain production for past
3-4 years is hovering around 234 million tonnes.


There are projections that demand for food grains would
increase from 234 million tonnes to 345 million tonnes in
2030.

The average size of the landholding has declined to 1.21 ha
during 2009-10 from 2.30 ha in 1970-71.
Declining size of landholdings without any alternative
income augmenting opportunity is resulting in fall of
farm income and causing agrarian distress.


To meet the multiple objectives of poverty reduction,
food security, competitiveness and sustainability,
several researchers have recommended the farming
systems approach to research and development.
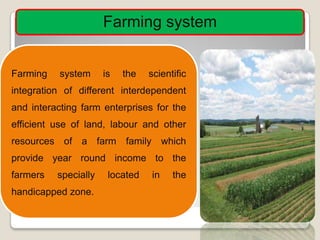
Farming system


Farming    system     is   the   scientific
integration of different interdependent
and interacting farm enterprises for the
efficient use of land, labour and other
resources of a farm family which
provide year round income to the
farmers   specially    located   in    the
handicapped zone.
What is it


Farming system approach envisages the
integration of agroforestry, horticulture, dairy,
sheep and goat rearing, fishery, poultry, pigeon,
biogas, mushroom, sericulture and by-product
utilization of crops with the main goal of
increasing the income and standard of living of
small and marginal farmers.
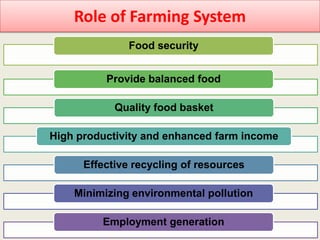
Role of Farming System
               Food security


          Provide balanced food

            Quality food basket

High productivity and enhanced farm income

      Effective recycling of resources

    Minimizing environmental pollution

         Employment generation
Role of Farming System
  Food security:
 Food security is defined as the balanced food supply and
  effective demand for food.

 Ensuring food security to the individual wards off the gender-
  based intra-household discrimination.

 Thus food security needs to be redefined as “livelihood
  security for the household and all members within, which
  ensures both physical and economic asses to balanced diet,
  safe drinking water, environmental sanitation, primary
  education and basic health care.
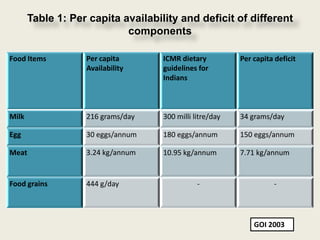
Table 1: Per capita availability and deficit of different
                            components

Food Items         Per capita       ICMR dietary          Per capita deficit
                   Availability     guidelines for
                                    Indians


Milk               216 grams/day    300 milli litre/day   34 grams/day

Egg                30 eggs/annum    180 eggs/annum        150 eggs/annum

Meat               3.24 kg/annum    10.95 kg/annum        7.71 kg/annum


Food grains        444 g/day                   -                     -


                                                              GOI 2003
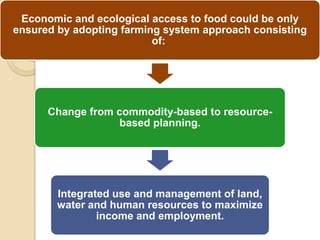
Economic and ecological access to food could be only
ensured by adopting farming system approach consisting
                          of:


      Change from commodity-based to resource-
                   based planning.


        Integrated use and management of land,
        water and human resources to maximize
                income and employment.
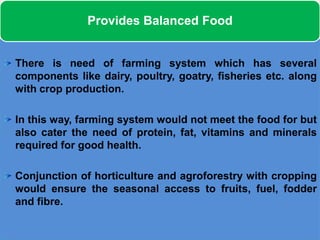
Provides Balanced Food


There is need of farming system which has several
components like dairy, poultry, goatry, fisheries etc. along
with crop production.

In this way, farming system would not meet the food for but
also cater the need of protein, fat, vitamins and minerals
required for good health.

Conjunction of horticulture and agroforestry with cropping
would ensure the seasonal access to fruits, fuel, fodder
and fibre.
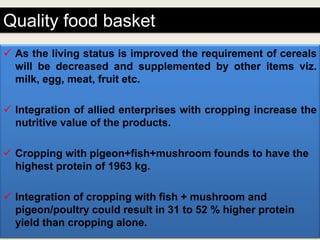
Quality food basket
 As the living status is improved the requirement of cereals
  will be decreased and supplemented by other items viz.
  milk, egg, meat, fruit etc.

 Integration of allied enterprises with cropping increase the
  nutritive value of the products.

 Cropping with pigeon+fish+mushroom founds to have the
  highest protein of 1963 kg.

 Integration of cropping with fish + mushroom and
  pigeon/poultry could result in 31 to 52 % higher protein
  yield than cropping alone.
Higher productivity and enhanced farm income


• Integration of fish in rice system decreasing the rice
  grain yield due to presence of fish trenches occupying
  10% of the rice area, however, additional income
  increased.

• The profit can be increased more when fish, vegetable
  system and livestock include in rice – rice farming
  system.
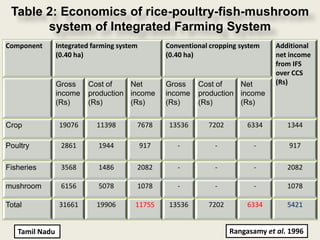
Table 2: Economics of rice-poultry-fish-mushroom
       system of Integrated Farming System
Component       Integrated farming system         Conventional cropping system    Additional
                (0.40 ha)                         (0.40 ha)                       net income
                                                                                  from IFS
                                                                                  over CCS
                Gross    Cost of    Net           Gross    Cost of    Net         (Rs)
                income   production income        income   production income
                (Rs)     (Rs)       (Rs)          (Rs)     (Rs)       (Rs)


Crop             19076      11398       7678       13536      7202        6334       1344

Poultry          2861        1944           917      -          -           -        917

Fisheries        3568        1486       2082         -          -           -        2082

mushroom         6156        5078       1078         -          -           -        1078

Total            31661      19906       11755      13536      7202        6334       5421


   Tamil Nadu                                                        Rangasamy et al. 1996
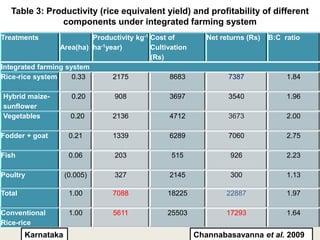
Table 3: Productivity (rice equivalent yield) and profitability of different
               components under integrated farming system
Treatments                Productivity kg-1 Cost of          Net returns (Rs)   B:C ratio
                 Area(ha) ha-1year)         Cultivation
                                            (Rs)
Integrated farming system
Rice-rice system     0.33       2175              8683             7387              1.84

Hybrid maize-         0.20       908             3697              3540              1.96
sunflower
Vegetables           0.20        2136            4712              3673              2.00

Fodder + goat        0.21        1339            6289              7060              2.75

Fish                 0.06        203              515               926              2.23

Poultry             (0.005)      327             2145               300              1.13

Total                1.00        7088            18225            22887              1.97

Conventional         1.00        5611            25503            17293              1.64
Rice-rice
        Karnataka                                         Channabasavanna et al. 2009
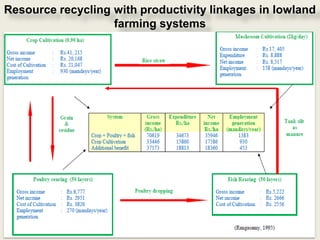
Effective recycling of resources


The effective recycling of farm resources is possible by
adoption of farming system research.


Crop by-product is utilized as fodder for animals, and
animal by-product i.e. milk, and dung may be utilized for
increasing income and soil fertility, respectively.
Resource recycling with productivity linkages in lowland
                   farming systems
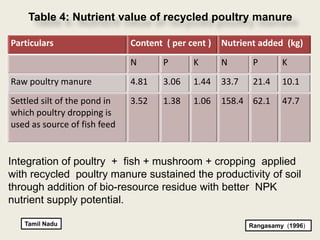
Table 4: Nutrient value of recycled poultry manure

Particulars                   Content ( per cent )   Nutrient added (kg)
                              N       P      K       N       P       K
Raw poultry manure            4.81    3.06   1.44    33.7    21.4    10.1
Settled silt of the pond in   3.52    1.38   1.06    158.4 62.1      47.7
which poultry dropping is
used as source of fish feed


Integration of poultry + fish + mushroom + cropping applied
with recycled poultry manure sustained the productivity of soil
through addition of bio-resource residue with better NPK
nutrient supply potential.

   Tamil Nadu                                               Rangasamy (1996)
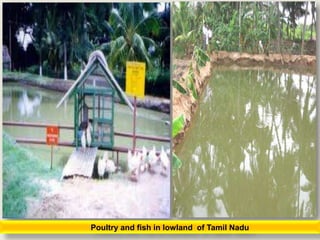
Poultry and fish in lowland of Tamil Nadu
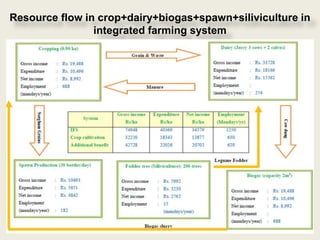
Resource flow in crop+dairy+biogas+spawn+siliviculture in
                integrated farming system
Minimize environmental pollution
      • In Punjab, Haryana and western Utter Pradesh, burning
        of rice residue is common practice, which increased the
        concentration of green house gases in atmosphere, in
        addition to huge amount of nutrient loss.


      • Such situation could be avoided by introduction of some
        more enterprises like animal husbandry on the farm.


      • Rice straw may be used as animal feed.
Employment generation
• Since crop based agriculture is highly season
  specific and time bond, the intensity of labour
  requirement increases during sowing and
  harvesting time of crops.

• For rest of the time farmers sitting idle if they do
  not have off-farm activities. This leisure time
  could be utilized effectively by adoption of
  farming system, which keeps the whole family
  busy throughout the year.
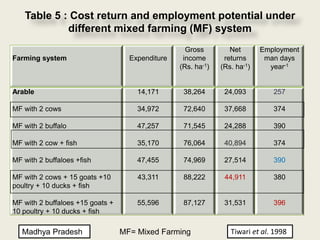
Table 5 : Cost return and employment potential under
            different mixed farming (MF) system
                                                    Gross         Net       Employment
Farming system                      Expenditure    income       returns      man days
                                                  (Rs. ha-1)   (Rs. ha-1)     year-1


Arable                                14,171       38,264       24,093         257

MF with 2 cows                        34,972       72,640       37,668         374

MF with 2 buffalo                     47,257       71,545       24,288         390

MF with 2 cow + fish                  35,170       76,064       40,894         374

MF with 2 buffaloes +fish             47,455       74,969       27,514         390

MF with 2 cows + 15 goats +10         43,311       88,222       44,911         380
poultry + 10 ducks + fish

MF with 2 buffaloes +15 goats +       55,596       87,127       31,531         396
10 poultry + 10 ducks + fish

   Madhya Pradesh                 MF= Mixed Farming               Tiwari et al. 1998
Farming System Research
Farming System Concept was developed in 1970.


It is designed to understand farmer priorities, strategies and resource
allocation decisions.

Used in conjunction with on-farm research to identify and adopt
technologies useful to location specific problems of farmers.

Farming systems research and development approach associated with
small farmers and focuses on their conditions and aspirations.

Its goal to develop sustainable land use system which will optimize
resource use and increase income and employment for farm families.
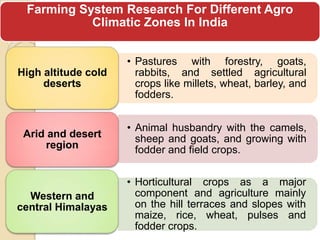
Farming System Research For Different Agro
           Climatic Zones In India


                     • Pastures with forestry, goats,
High altitude cold     rabbits, and settled agricultural
     deserts           crops like millets, wheat, barley, and
                       fodders.


                     • Animal husbandry with the camels,
 Arid and desert       sheep and goats, and growing with
     region            fodder and field crops.


                     • Horticultural crops as a major
  Western and          component and agriculture mainly
central Himalayas      on the hill terraces and slopes with
                       maize, rice, wheat, pulses and
                       fodder crops.
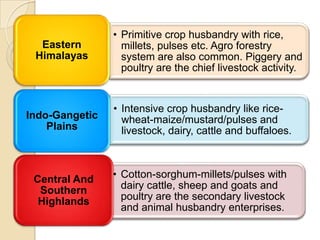
• Primitive crop husbandry with rice,
  Eastern         millets, pulses etc. Agro forestry
 Himalayas        system are also common. Piggery and
                  poultry are the chief livestock activity.


                • Intensive crop husbandry like rice-
Indo-Gangetic     wheat-maize/mustard/pulses and
    Plains        livestock, dairy, cattle and buffaloes.


 Central And    • Cotton-sorghum-millets/pulses with
  Southern        dairy cattle, sheep and goats and
  Highlands       poultry are the secondary livestock
                  and animal husbandry enterprises.
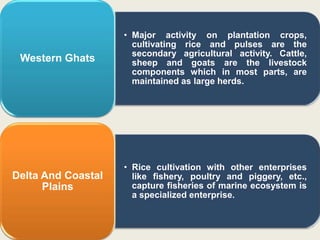
• Major activity on plantation crops,
                      cultivating rice and pulses are the
                      secondary agricultural activity. Cattle,
 Western Ghats        sheep and goats are the livestock
                      components which in most parts, are
                      maintained as large herds.


                    • Rice cultivation with other enterprises
Delta And Coastal     like fishery, poultry and piggery, etc.,
      Plains          capture fisheries of marine ecosystem is
                      a specialized enterprise.
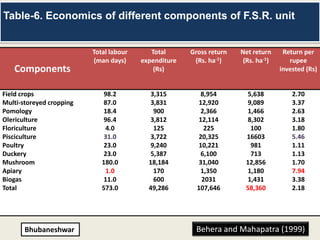
Table-6. Economics of different components of F.S.R. unit


                          Total labour      Total      Gross return   Net return     Return per
                          (man days)     expenditure    (Rs. ha-1)     (Rs. ha-1)      rupee
   Components                                (Rs)                                   invested (Rs)


Field crops                   98.2         3,315          8,954        5,638            2.70
Multi-storeyed cropping       87.0         3,831          12,920       9,089            3.37
Pomology                      18.4          900           2,366        1,466            2.63
Olericulture                  96.4         3,812          12,114       8,302            3.18
Floriculture                  4.0           125             225         100             1.80
Pisciculture                  31.0         3,722          20,325       16603            5.46
Poultry                       23.0         9,240          10,221        981             1.11
Duckery                       23.0         5,387          6,100         713             1.13
Mushroom                     180.0         18,184         31,040       12,856           1.70
Apiary                        1.0           170           1,350        1,180            7.94
Biogas                        11.0          600            2031        1,431            3.38
Total                        573.0         49,286        107,646       58,360           2.18


       Bhubaneshwar                                     Behera and Mahapatra (1999)
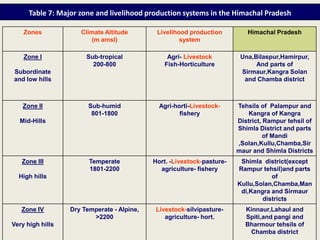
Table 7: Major zone and livelihood production systems in the Himachal Pradesh

    Zones            Climate Altitude        Livelihood production         Himachal Pradesh
                        (m amsl)                     system

    Zone I             Sub-tropical             Agri- Livestock          Una,Bilaspur,Hamirpur,
                         200-800               Fish-Horticulture              And parts of
Subordinate                                                              Sirmaur,Kangra Solan
and low hills                                                             and Chamba district


   Zone II              Sub-humid             Agri-horti-Livestock-     Tehsils of Palampur and
                         801-1800                    fishery                Kangra of Kangra
  Mid-Hills                                                             District, Rampur tehsil of
                                                                        Shimla District and parts
                                                                                  of Mandi
                                                                        ,Solan,Kullu,Chamba,Sir
                                                                        maur and Shimla Districts
   Zone III             Temperate           Hort. -Livestock-pasture-    Shimla district(except
                        1801-2200             agriculture- fishery      Rampur tehsil)and parts
  High hills                                                                       of
                                                                        Kullu,Solan,Chamba,Man
                                                                         di,Kangra and Sirmaur
                                                                                districts
   Zone IV        Dry Temperate - Alpine,    Livestock-silvipasture-       Kinnaur,Lahaul and
                         >2200                  agriculture- hort.         Spiti,and pangi and
Very high hills                                                            Bharmour tehsils of
                                                                            Chamba district
Integrated farming system

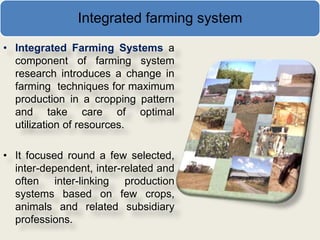
• Integrated Farming Systems a
  component of farming system
  research introduces a change in
  farming techniques for maximum
  production in a cropping pattern
  and take care of optimal
  utilization of resources.
• It focused round a few selected,
  inter-dependent, inter-related and
  often inter-linking production
  systems based on few crops,
  animals and related subsidiary
  professions.
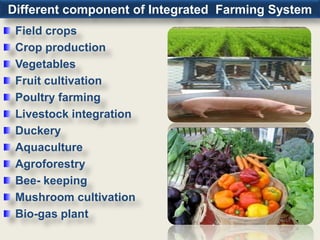
Different component of Integrated Farming System
 Field crops
 Crop production
 Vegetables
 Fruit cultivation
 Poultry farming
 Livestock integration
 Duckery
 Aquaculture
 Agroforestry
 Bee- keeping
 Mushroom cultivation
 Bio-gas plant
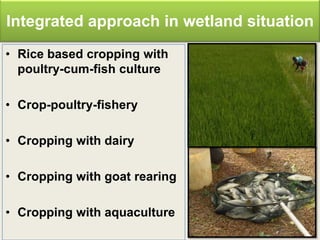
Integrated approach in wetland situation
• Rice based cropping with
  poultry-cum-fish culture

• Crop-poultry-fishery

• Cropping with dairy

• Cropping with goat rearing

• Cropping with aquaculture
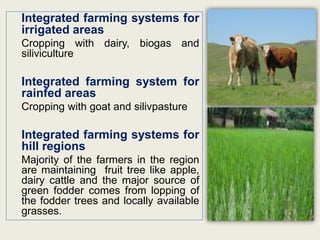
Integrated farming systems for
irrigated areas
Cropping with dairy, biogas and
siliviculture

Integrated farming system for
rainfed areas
Cropping with goat and silivpasture

Integrated farming systems for
hill regions
Majority of the farmers in the region
are maintaining fruit tree like apple,
dairy cattle and the major source of
green fodder comes from lopping of
the fodder trees and locally available
grasses.
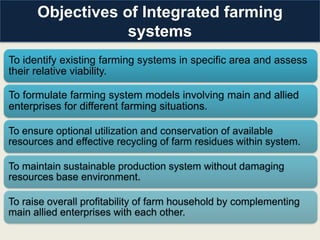
Objectives of Integrated farming
                  systems
To identify existing farming systems in specific area and assess
their relative viability.

To formulate farming system models involving main and allied
enterprises for different farming situations.
To ensure optional utilization and conservation of available
resources and effective recycling of farm residues within system.
To maintain sustainable production system without damaging
resources base environment.

To raise overall profitability of farm household by complementing
main allied enterprises with each other.
Analysis of existing farming systems in terms of resource use
efficiency, production and productivity, income, employment
and sustainability across different agro-climatic zones.

Evaluation and identification of farming system through
participatory approach that ensures threshold level of income
for the livelihood security.

Developing appropriate institutional and market linkage
including value addition for enhancing sustainability.


Imparting training and capacity building of various
stakeholders on IFS.
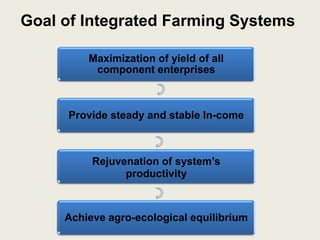
Goal of Integrated Farming Systems

         Maximization of yield of all
          component enterprises


     Provide steady and stable In-come


          Rejuvenation of system’s
                productivity


     Achieve agro-ecological equilibrium
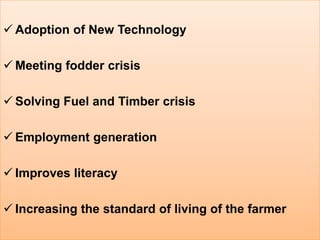
Advantages of Integrated Farming
              System
• Increased Productivity

• Profitability

• Sustainability

• Balanced Food

• Environmental safety

• Recycling of resources

• Income round the Year
 Adoption of New Technology

 Meeting fodder crisis

 Solving Fuel and Timber crisis

 Employment generation

 Improves literacy

 Increasing the standard of living of the farmer
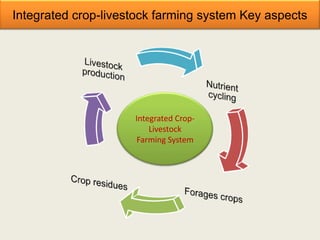
Integrated crop-livestock farming system Key aspects


                     Integrated Crop-
                         Livestock
                      Farming System
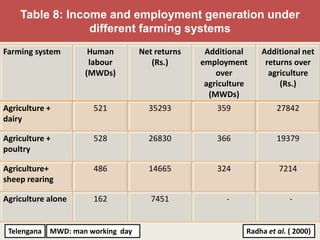
Table 8: Income and employment generation under
                 different farming systems
Farming system        Human         Net returns    Additional    Additional net
                      labour           (Rs.)      employment      returns over
                     (MWDs)                           over         agriculture
                                                   agriculture        (Rs.)
                                                    (MWDs)
Agriculture +          521            35293           359             27842
dairy

Agriculture +          528            26830           366             19379
poultry

Agriculture+           486            14665           324              7214
sheep rearing

Agriculture alone      162             7451             -                 -


 Telengana   MWD: man working day                            Radha et al. ( 2000)
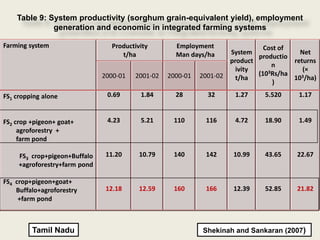
Table 9: System productivity (sorghum grain-equivalent yield), employment
              generation and economic in integrated farming systems

Farming system                   Productivity        Employment                Cost of
                                    t/ha             Man days/ha     System              Net
                                                                             productio
                                                                     product           returns
                                                                                 n
                                                                       ivity              (×
                               2000-01   2001-02   2000-01   2001-02         (103Rs/ha   3/ha)
                                                                       t/ha            10
                                                                                  )
FS1 cropping alone              0.69      1.84       28        32      1.27    5.520     1.17


FS2 crop +pigeon+ goat+         4.23      5.21      110       116      4.72    18.90     1.49
     agroforestry +
     farm pond

     FS3 crop+pigeon+Buffalo    11.20     10.79     140       142     10.99    43.65    22.67
     +agroforestry+farm pond

FS4 crop+pigeon+goat+
    Buffalo+agroforestry        12.18     12.59     160       166     12.39    52.85    21.82
     +farm pond


         Tamil Nadu                                          Shekinah and Sankaran (2007)
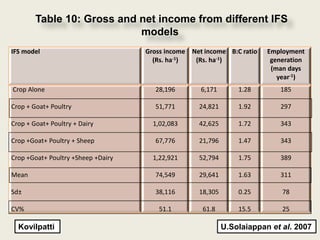
Table 10: Gross and net income from different IFS
                            models
IFS model                           Gross income Net income B:C ratio   Employment
                                      (Rs. ha-1)  (Rs. ha-1)             generation
                                                                         (man days
                                                                           year-1)
Crop Alone                            28,196        6,171       1.28       185

Crop + Goat+ Poultry                  51,771       24,821       1.92       297

Crop + Goat+ Poultry + Dairy          1,02,083     42,625       1.72       343

Crop +Goat+ Poultry + Sheep           67,776       21,796       1.47       343

Crop +Goat+ Poultry +Sheep +Dairy     1,22,921     52,794       1.75       389

Mean                                  74,549       29,641       1.63       311

Sd±                                   38,116       18,305       0.25        78

CV%                                     51.1        61.8        15.5        25

  Kovilpatti                                                U.Solaiappan et al. 2007
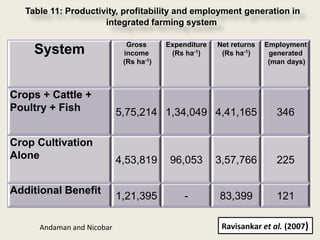
Table 11: Productivity, profitability and employment generation in
                      integrated farming system

                              Gross      Expenditure   Net returns   Employment
     System                  income       (Rs ha-1)     (Rs ha-1)     generated
                             (Rs ha-1)                                (man days)


Crops + Cattle +
Poultry + Fish              5,75,214 1,34,049 4,41,165                  346

Crop Cultivation
Alone                       4,53,819      96,053       3,57,766         225

Additional Benefit
                            1,21,395          -        83,399           121

      Andaman and Nicobar                               Ravisankar et al. (2007)
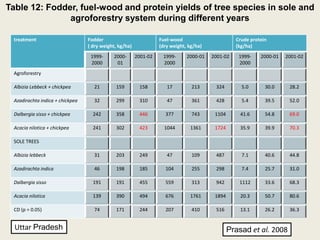
Table 12: Fodder, fuel-wood and protein yields of tree species in sole and
               agroforestry system during different years

 treatment                       Fodder                           Fuel-wood                       Crude protein
                                 ( dry weight, kg/ha)             (dry weight, kg/ha)             (kg/ha)
                                  1999-     2000-       2001-02    1999-      2000-01   2001-02    1999-    2000-01   2001-02
                                  2000       01                    2000                            2000
 Agroforestry

 Albizia Lebbeck + chickpea        21        159         158         17         213      324        5.0       30.0     28.2

 Azadirachta indica + chickpea     32        299         310         47         361      428        5.4       39.5     52.0

 Dalbergia sisso + chickpea        242       358         446        377         743      1104       41.6      54.8     69.0

 Acacia nilotica + chickpea        241       302         423        1044       1361      1724       35.9      39.9     70.3

 SOLE TREES

 Albizia lebbeck                   31        203         249         47         109      487        7.1       40.6     44.8

 Azadirachta indica                46        198         185        104         255      298        7.4       25.7     31.0

 Dalbergia sisso                   191       191         455        559         313      942       1112       33.6     68.3

 Acacia nilotica                   139       390         494        676        1761      1894       20.3      50.7     80.6

 CD (p = 0.05)                     74        171         244        207         410      516        13.1      26.2     36.3


  Uttar Pradesh                                                                                 Prasad et al. 2008
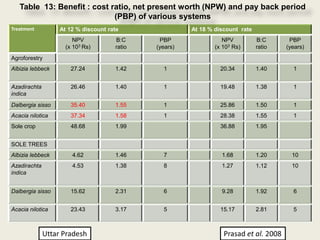
Table 13: Benefit : cost ratio, net present worth (NPW) and pay back period
                             (PBP) of various systems
Treatment          At 12 % discount rate                At 18 % discount rate
                        NPV           B:C      PBP                 NPV          B:C      PBP
                     (x 103 Rs)       ratio   (years)           (x 103 Rs)      ratio   (years)
Agroforestry
Albizia lebbeck        27.24          1.42      1                 20.34         1.40      1


Azadirachta            26.46          1.40      1                 19.48         1.38      1
indica
Dalbergia sisso        35.40          1.55      1                 25.86         1.50      1
Acacia nilotica        37.34          1.58      1                 28.38         1.55      1
Sole crop              48.68          1.99                        36.88         1.95


SOLE TREES
Albizia lebbeck        4.62           1.46      7                 1.68          1.20      10
Azadirachta            4.53           1.38      8                 1.27          1.12      10
indica


Dalbergia sisso        15.62          2.31      6                 9.28          1.92      6


Acacia nilotica        23.43          3.17      5                 15.17         2.81      5


              Uttar Pradesh                                        Prasad et al. 2008
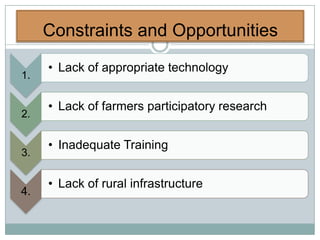
Constraints and Opportunities
     • Lack of appropriate technology
1.

     • Lack of farmers participatory research
2.

     • Inadequate Training
3.

     • Lack of rural infrastructure
4.
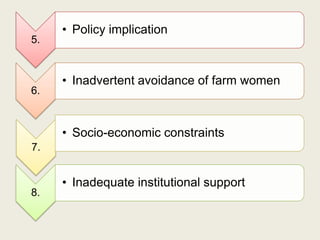
• Policy implication
5.


     • Inadvertent avoidance of farm women
6.


     • Socio-economic constraints
7.


     • Inadequate institutional support
8.
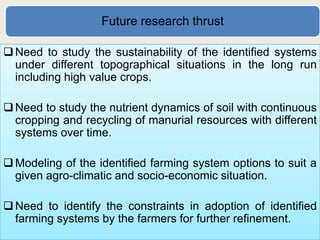
Future research thrust

 Need to study the sustainability of the identified systems
  under different topographical situations in the long run
  including high value crops.

 Need to study the nutrient dynamics of soil with continuous
  cropping and recycling of manurial resources with different
  systems over time.

 Modeling of the identified farming system options to suit a
  given agro-climatic and socio-economic situation.

 Need to identify the constraints in adoption of identified
  farming systems by the farmers for further refinement.
Conclusion


Efficient utilization of scarce and costly resources is the need of the hour to
make crop production a viable proposition in the present day competitive
scenario.


Following the concept of Integrated farming systems through supplementation
of allied agro-enterprises by recycling the waste of one enterprise in another is
a right step in this direction.


It provides alternate and sustainable avocation to marginal and sub-marginal
farmers. Fruit, mushroom, apiary, animal production and poultry have been
more viable with them.
The crop residues and biomass available in plenty in the crop
production system need to be properly managed to harness full
benefits.


Improving the integrated approach not only enhances farm
income but also overcomes environmental pollution.


A better planning and utilization of the available resources will
usher in bright prospects for the farm economy as a whole.
Farming System Approach