Downloaded 386 times


![39
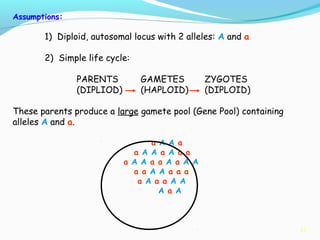
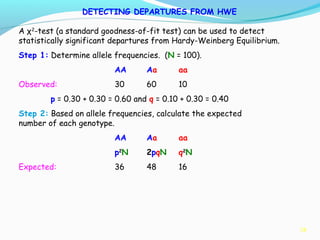
AA Aa aa
Observed: 30 60 10
Expected: 36 48 16
Step 3: Calculate χ2
test statistic.
χ2
= Σ [(O-E)2
/E]
= (30-36)2
/36 + (60-48)2
/48 + (10-16)2
/16 = 6.25
Step 4: Compare this result to critical value from the χ2
statistical
table. This test has 1 degree of freedom, so the critical value for α =
0.05 is 3.84.
6.25 > 3.84, so this is a significant departure from HWE!
DETECTING DEPARTURES FROM HWE](https://image.slidesharecdn.com/b-150110045618-conversion-gate01/85/B-sc-agri-i-pog-unit-4-population-genetics-39-320.jpg)
![40
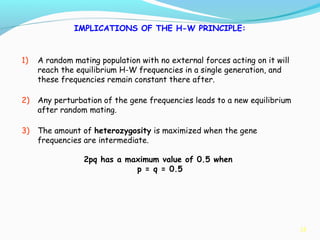
IMPLICATIONS OF A STATISTICAL DEPARTURE FROM HWE
If the null hypothesis is true (i.e., we are in H-W equilibrium), we
would expect a sample of this size to show this much (or more) of a
departure from expectations (purely by chance sampling) less than
5 percent of the time.
One or more of the assumptions of the H-W principle are not
satisfied in this population.
Further research will be necessary to establish which assumption is
violated. [Excess of heterozygotes could be due to overdominant
selection, for example].
NOTE: A failure to detect a departure from H-W equilibrium does
not guarantee that the population satisfies all of the assumptions
of the model. The departure may simply not be statistically
detectable.
See Box 6.5 in F&H for more on X2
tests.](https://image.slidesharecdn.com/b-150110045618-conversion-gate01/85/B-sc-agri-i-pog-unit-4-population-genetics-40-320.jpg)
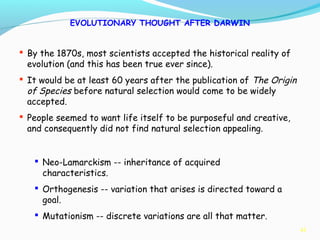

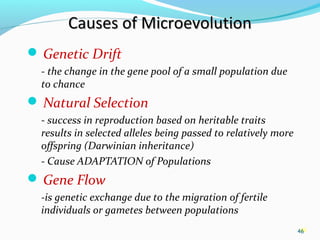

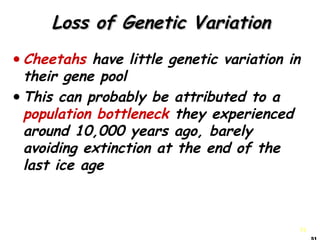

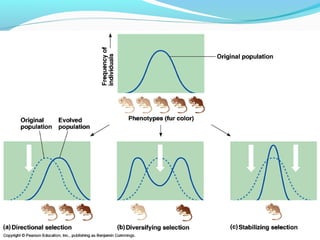
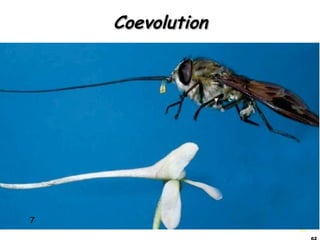


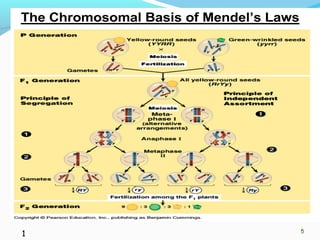
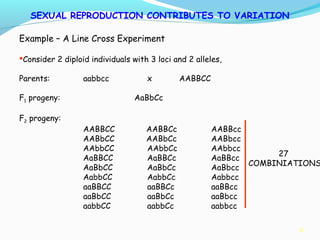
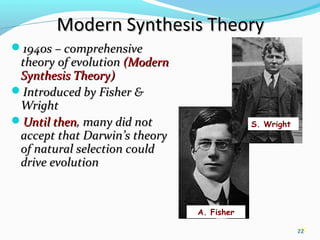
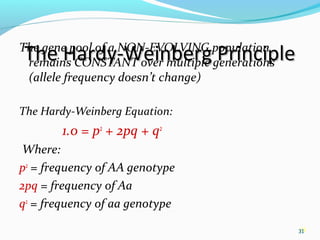
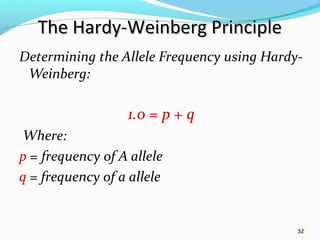
This document provides an overview of population genetics and principles of evolution. It discusses how genetic variation is maintained in populations through mechanisms such as sexual reproduction, genetic drift, mutation and natural selection. A key concept is that evolution occurs through changes in allele frequencies in populations over generations. The document also covers Mendelian inheritance, Darwinian evolution, the Hardy-Weinberg principle of genetic equilibrium, and factors that can lead to deviations from equilibrium, driving microevolutionary changes within populations.