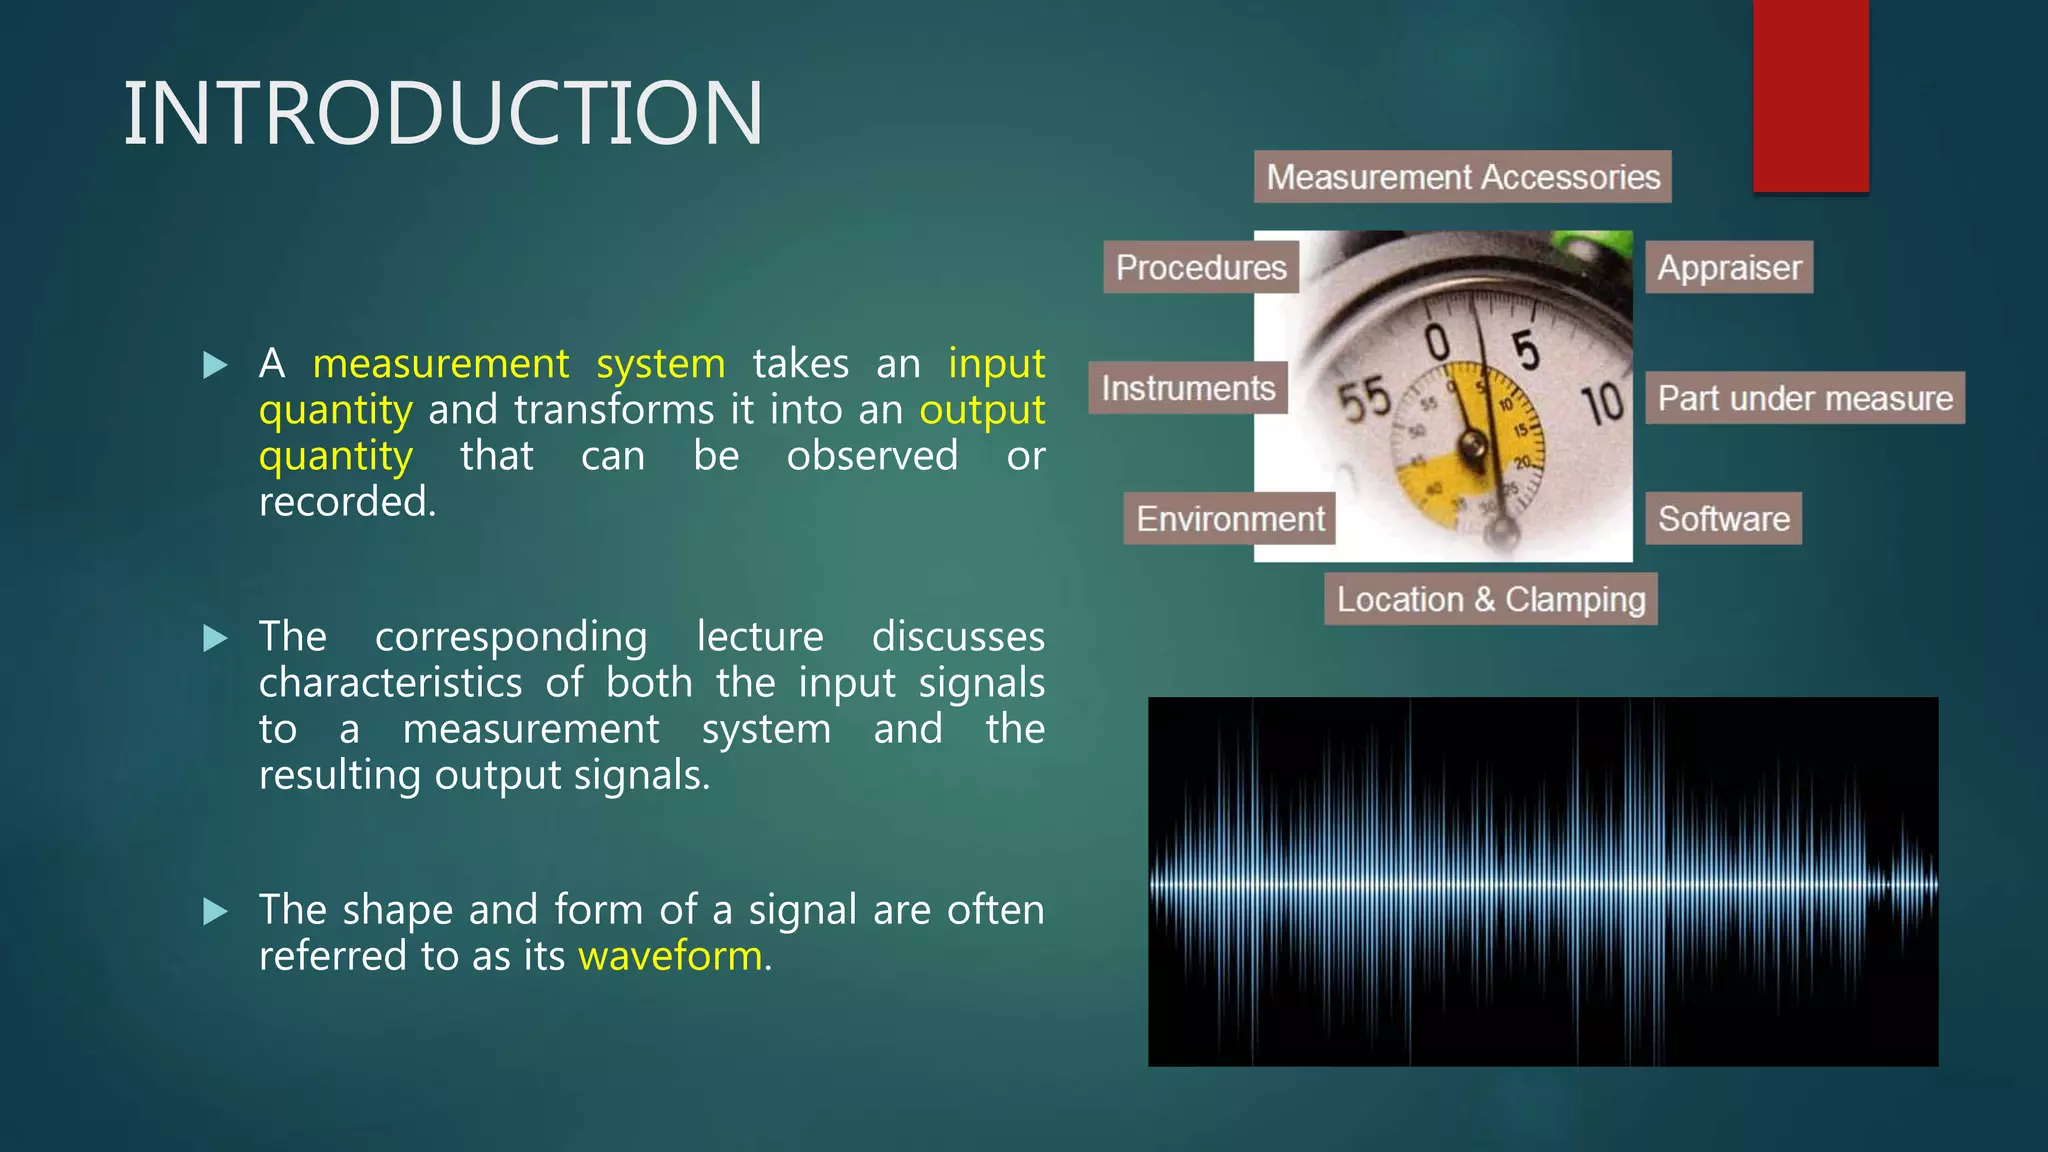
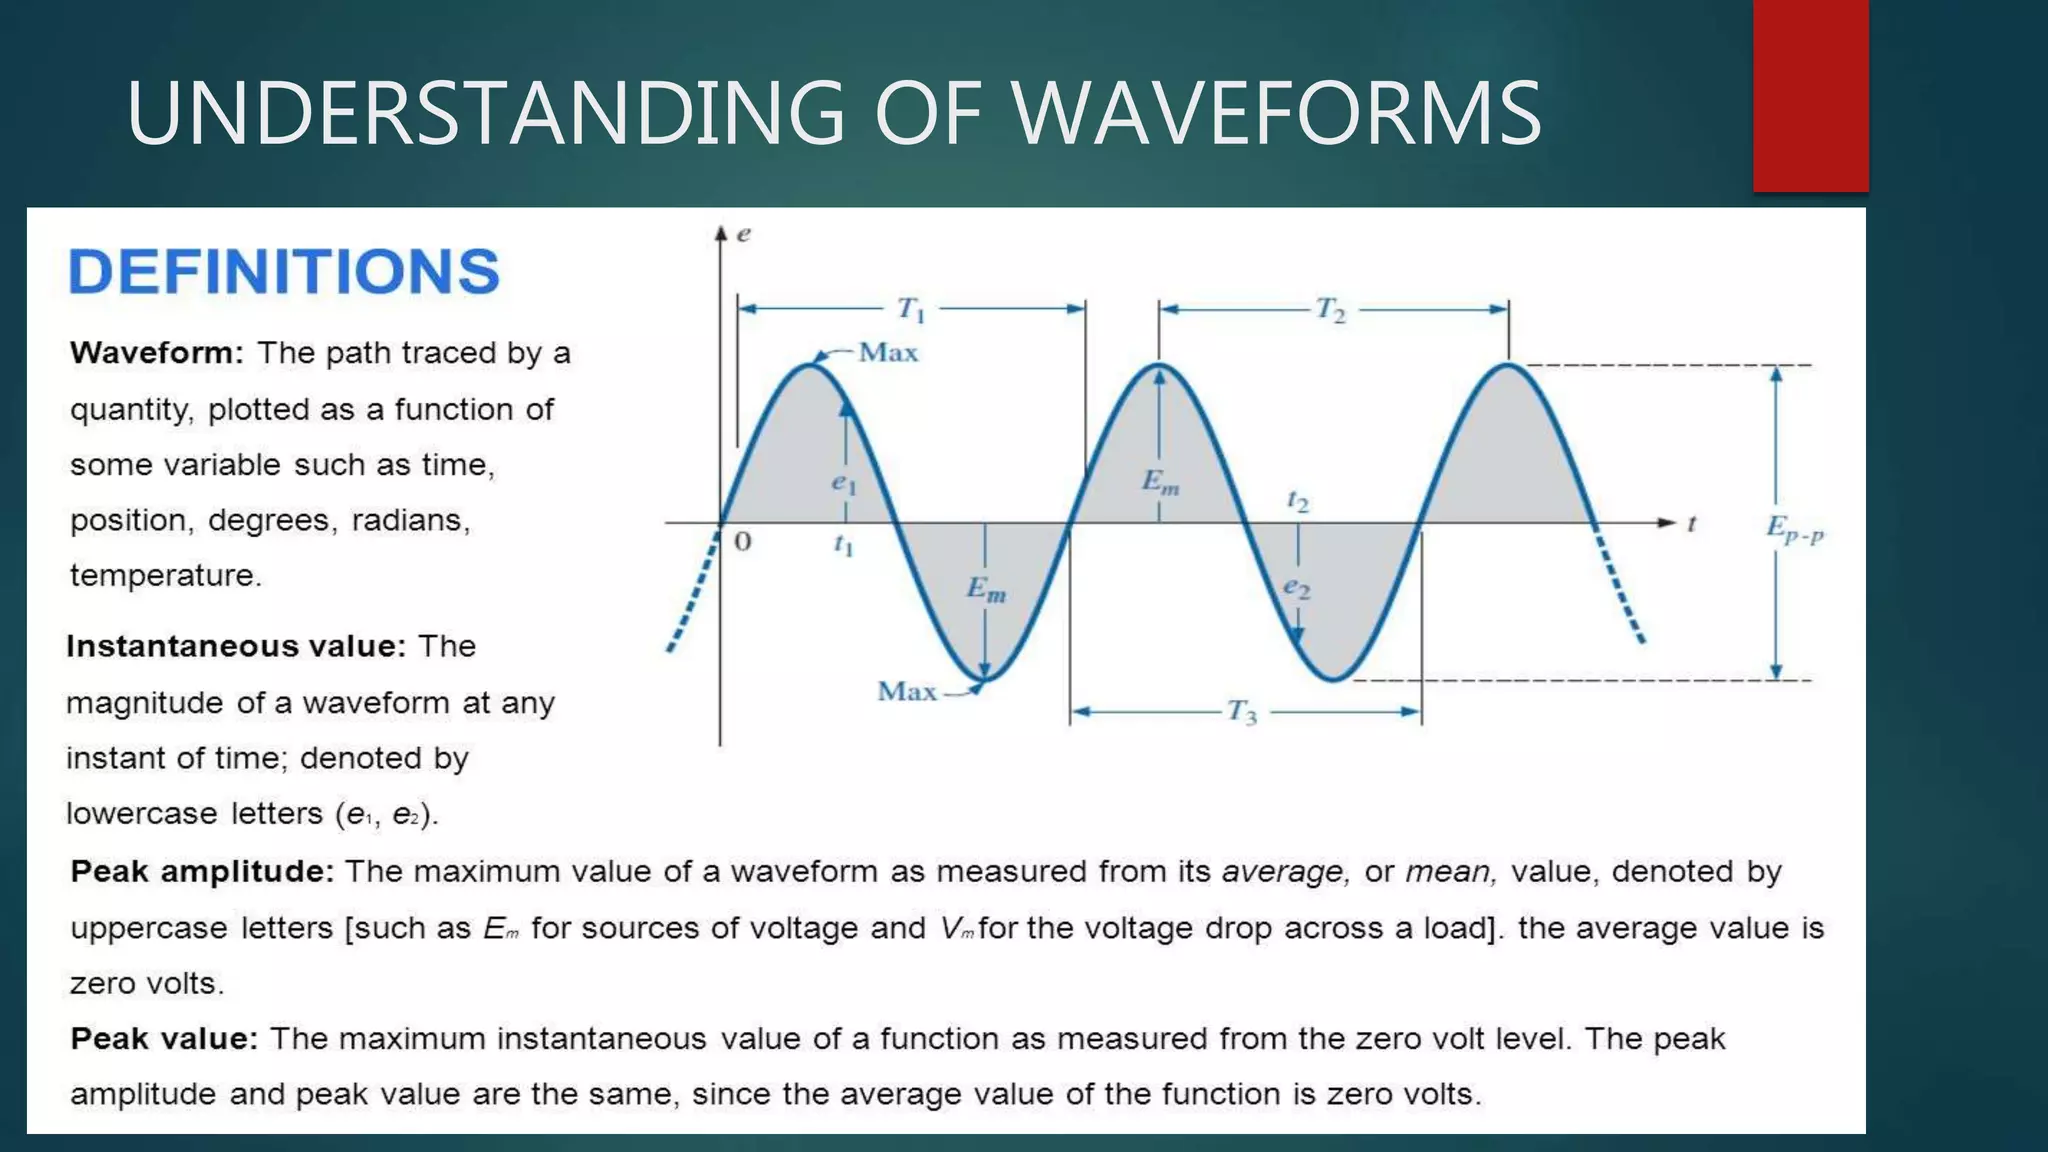
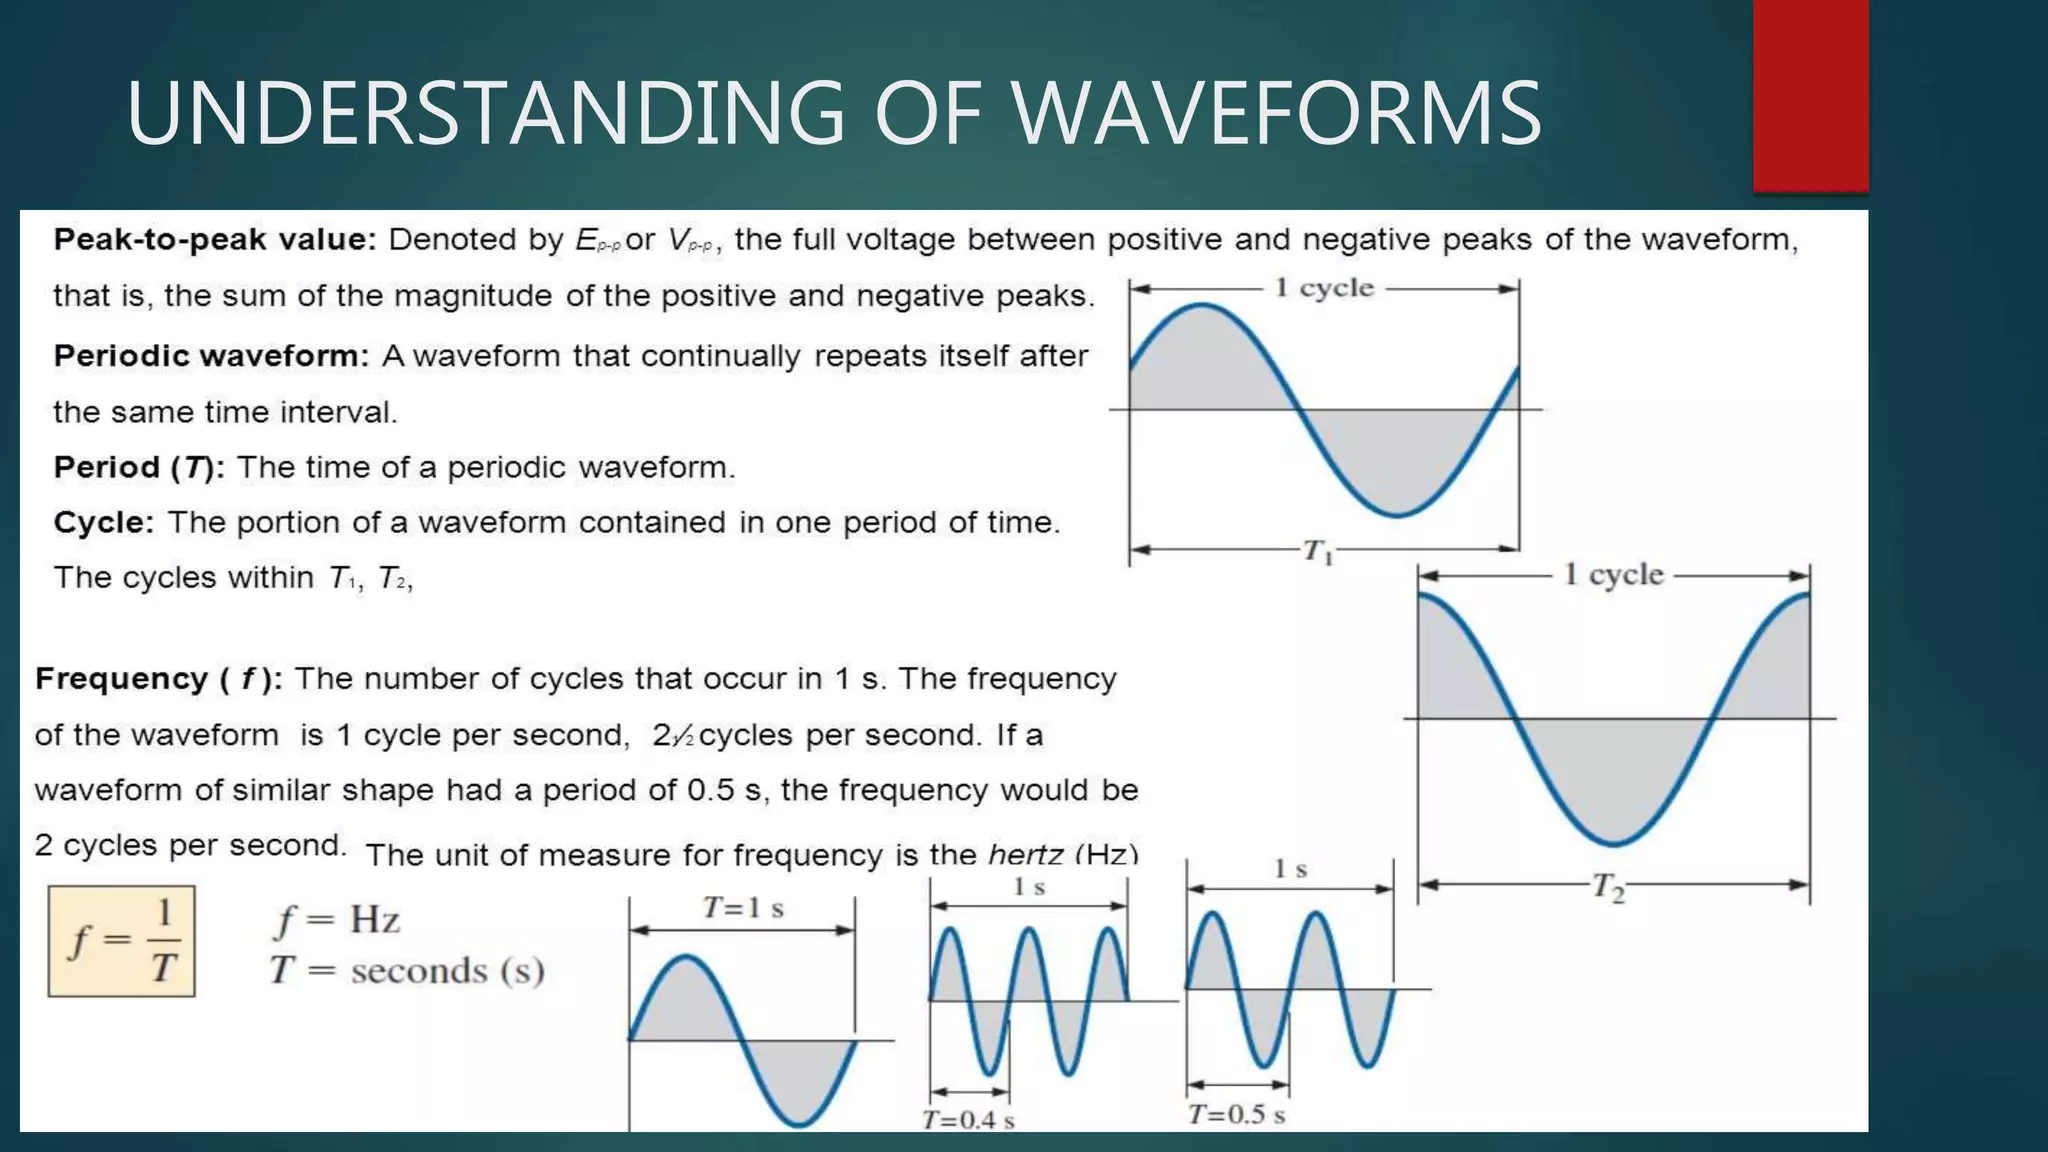
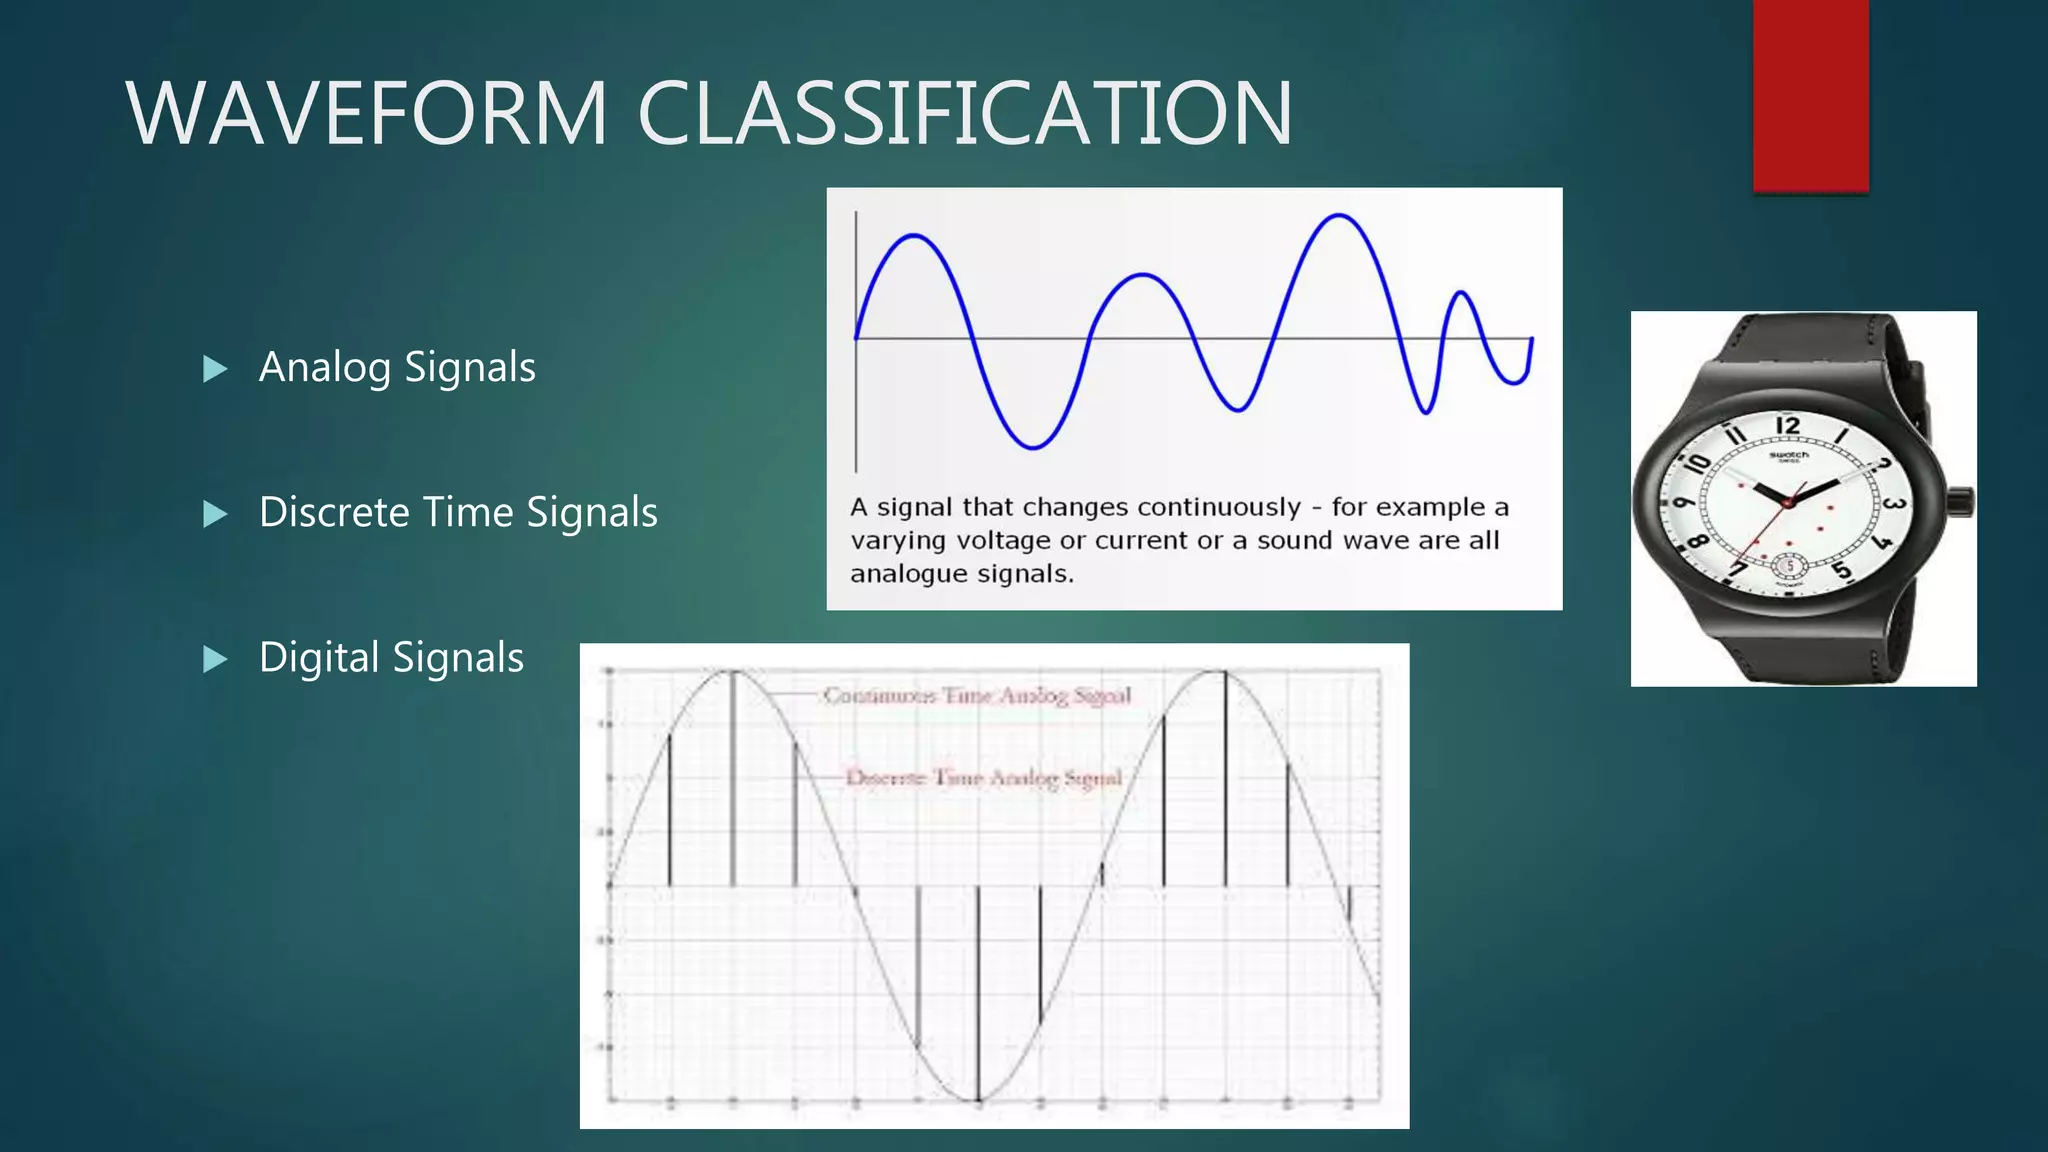
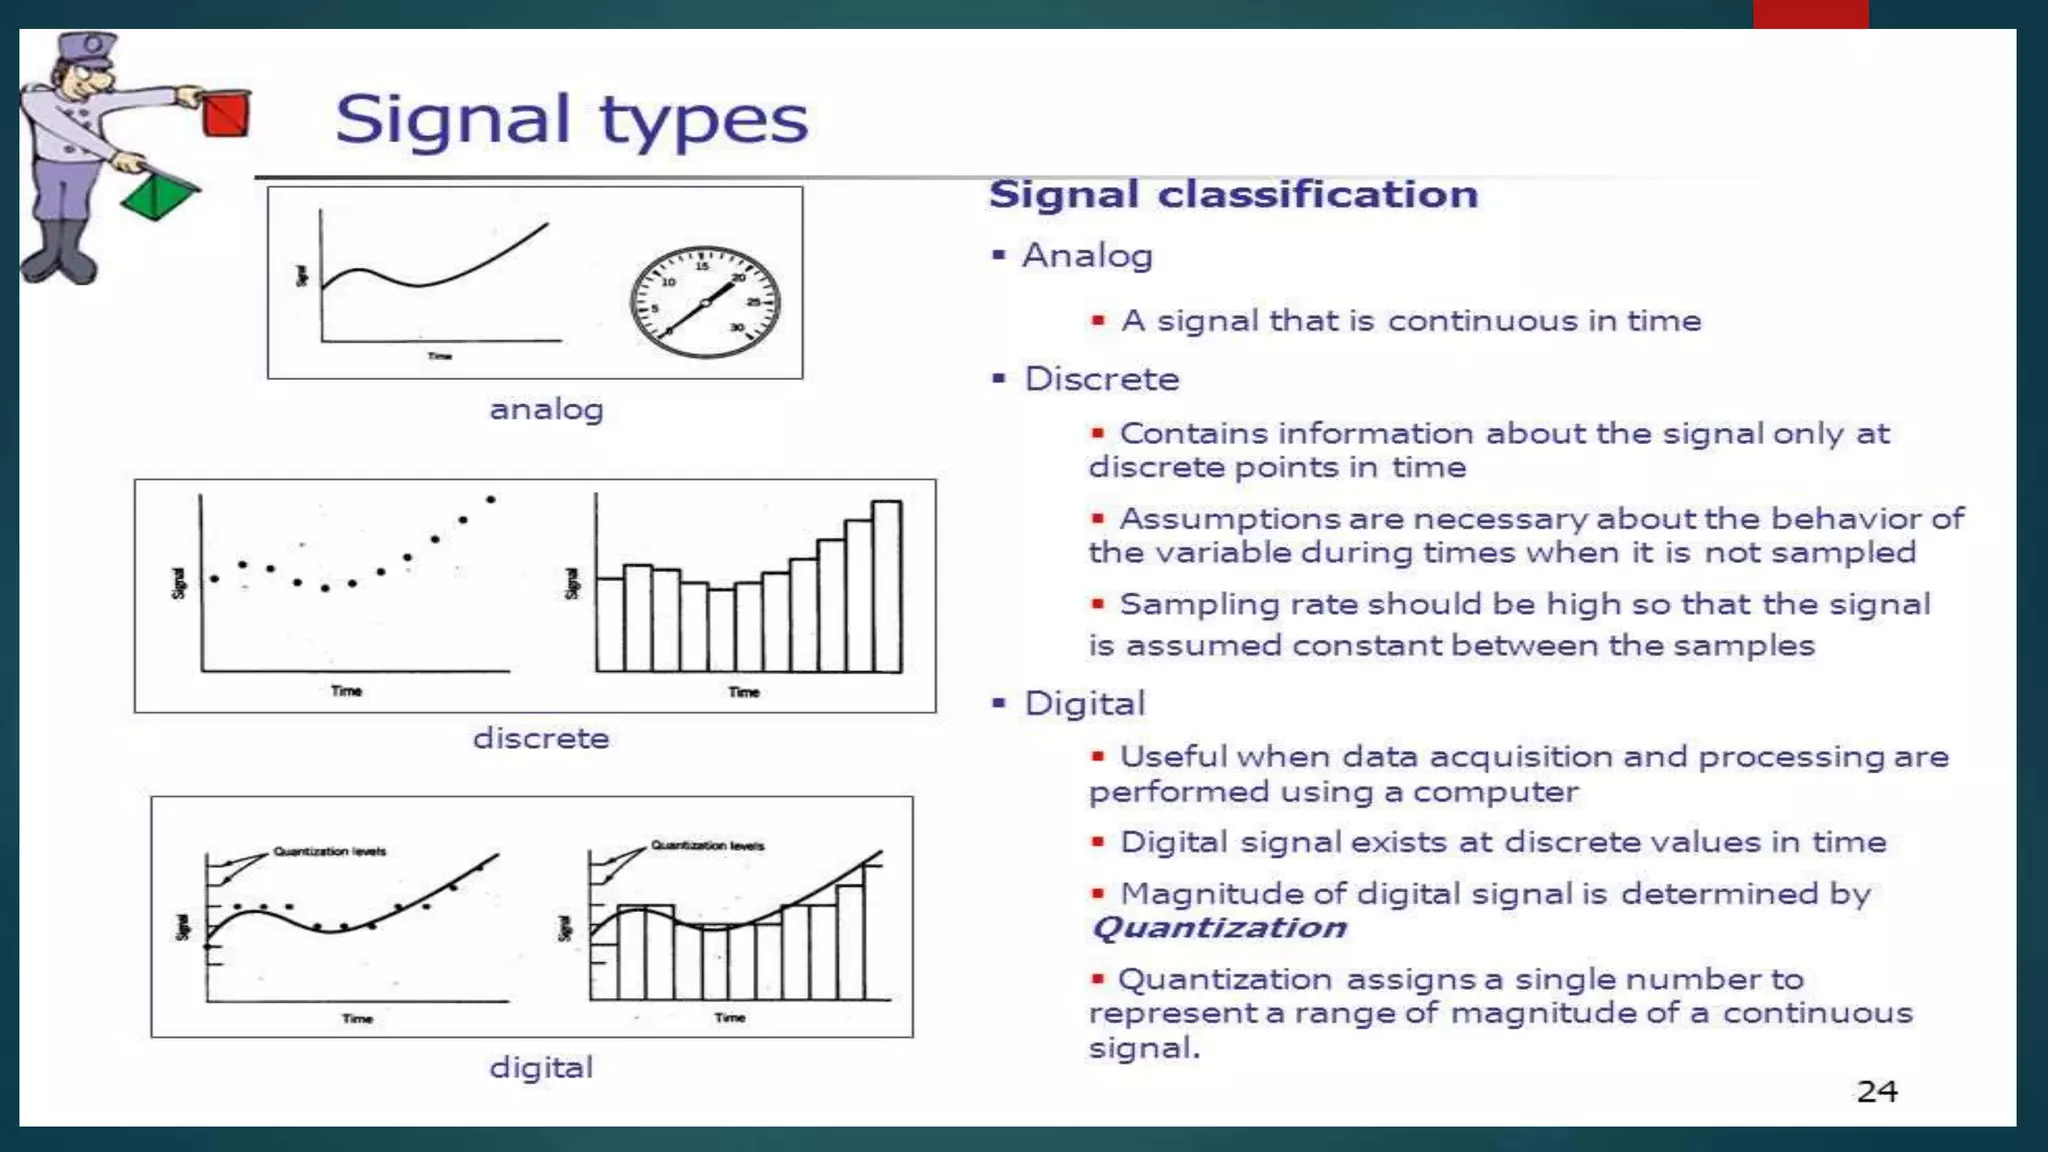
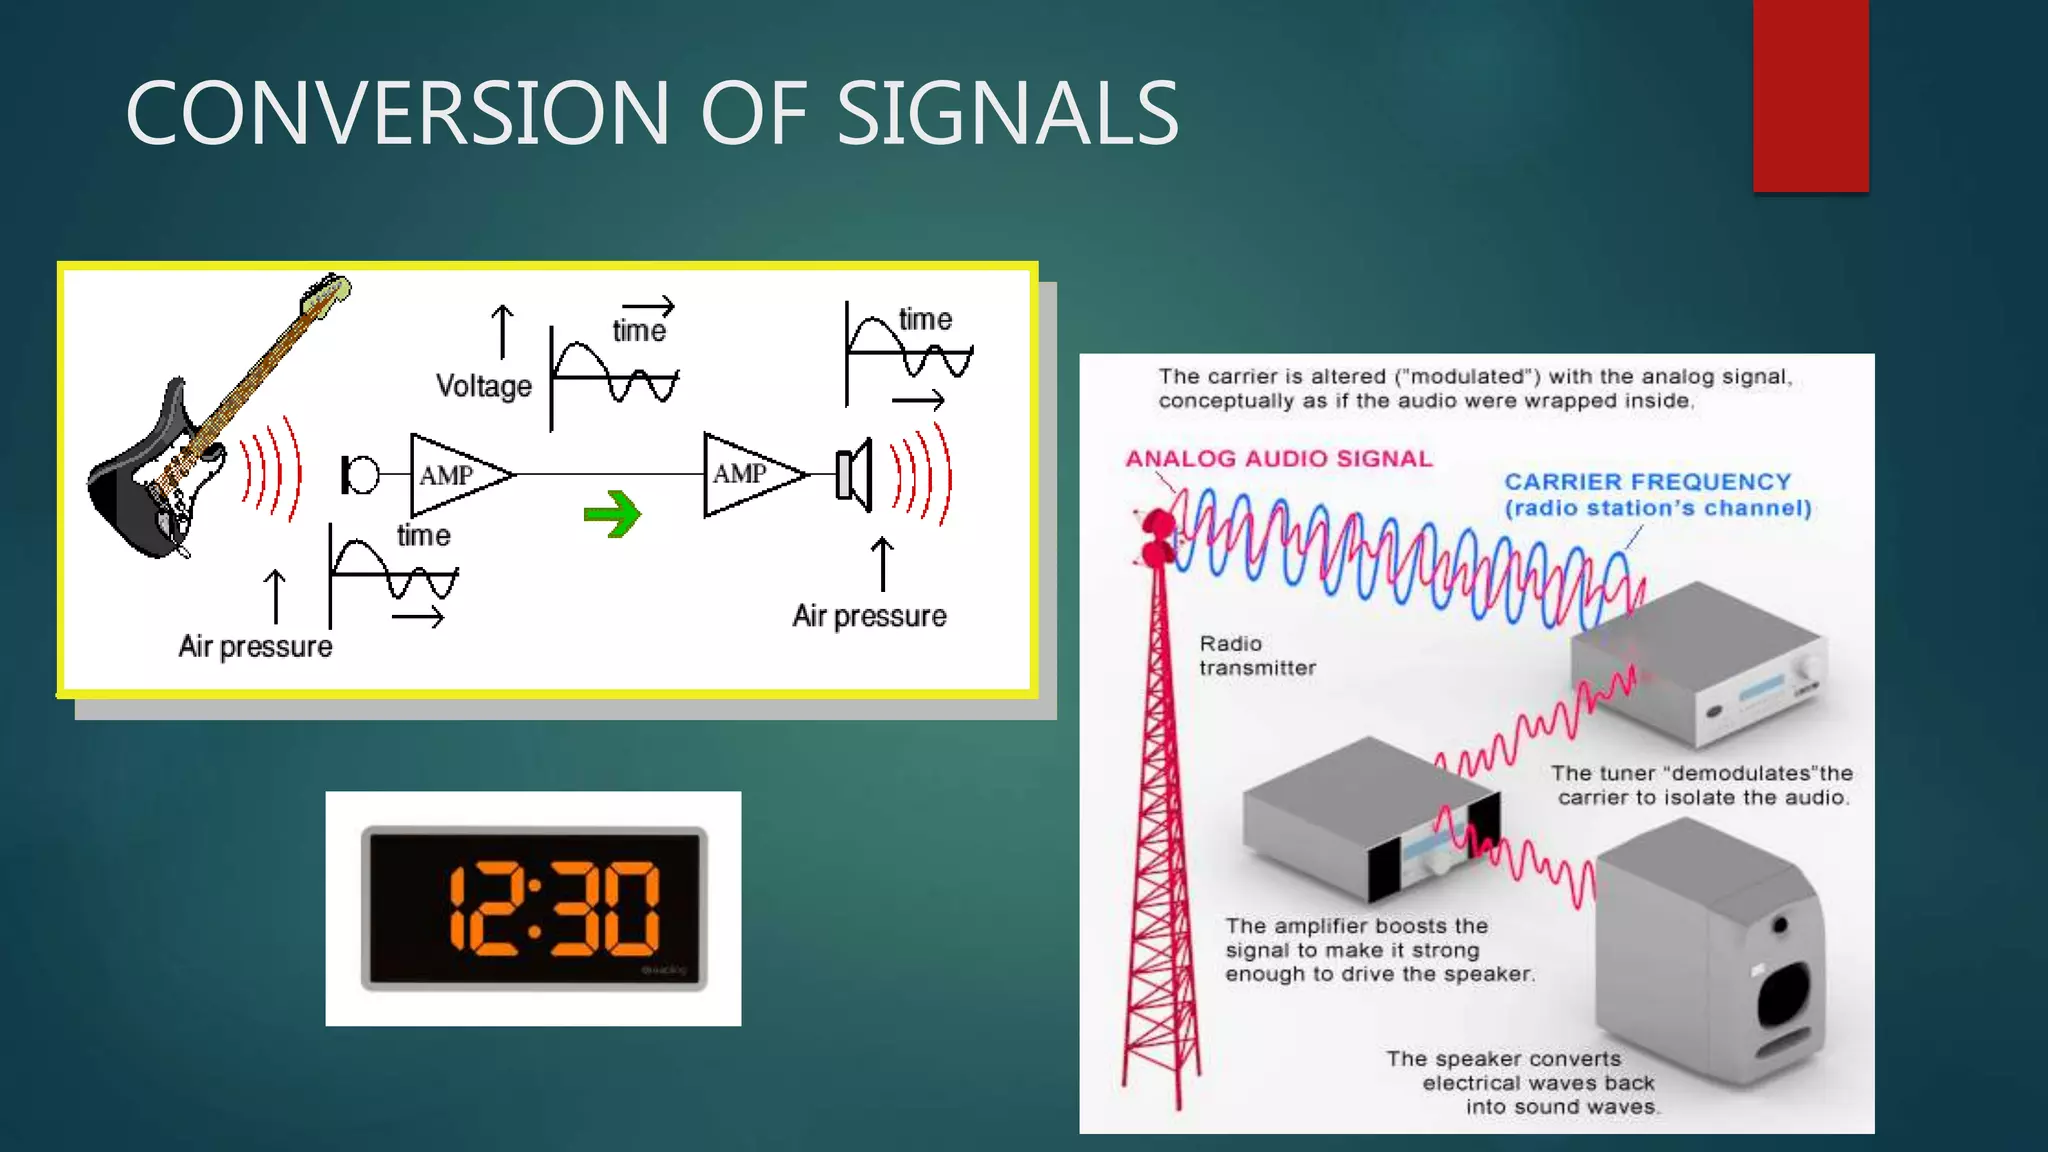
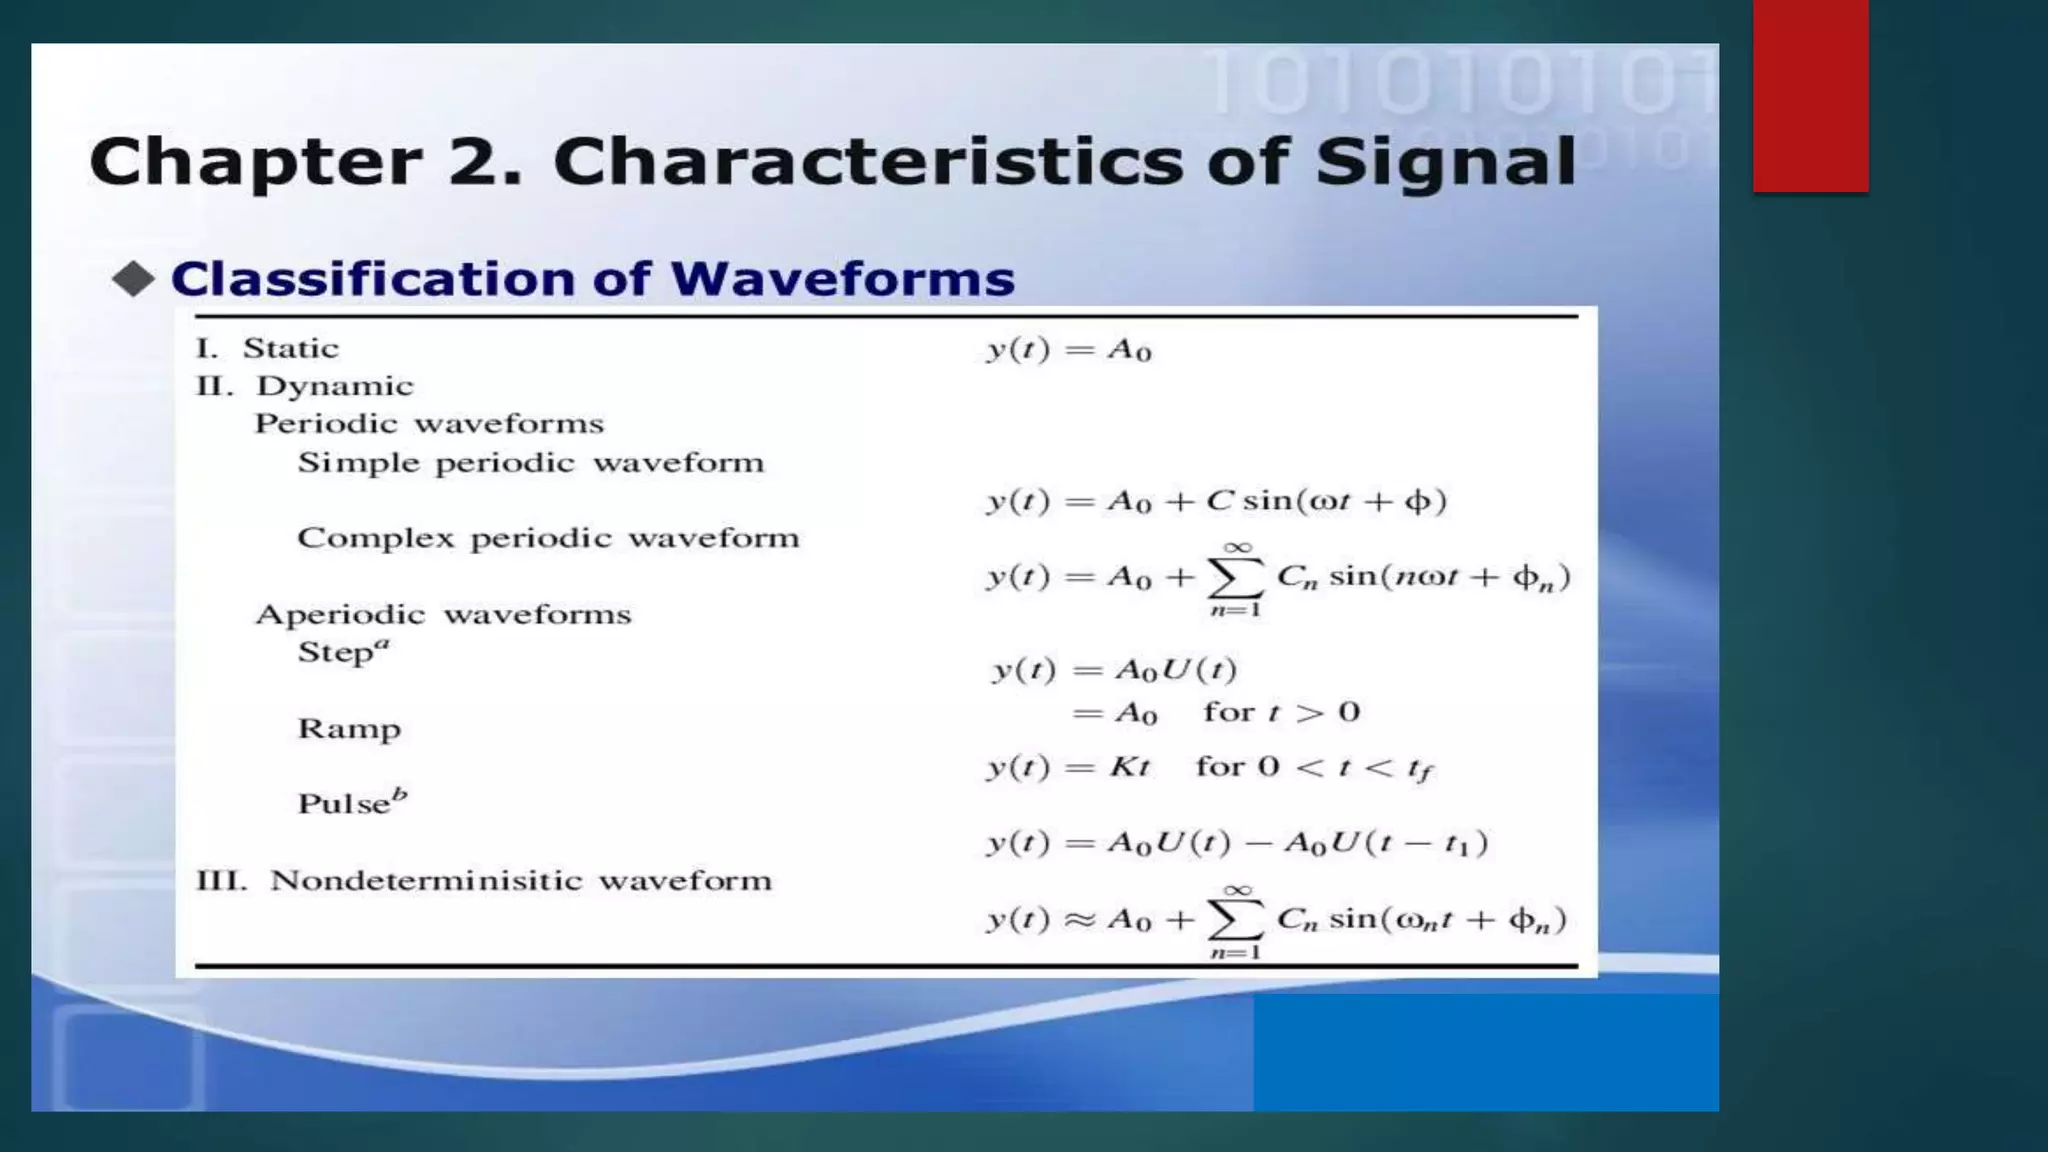
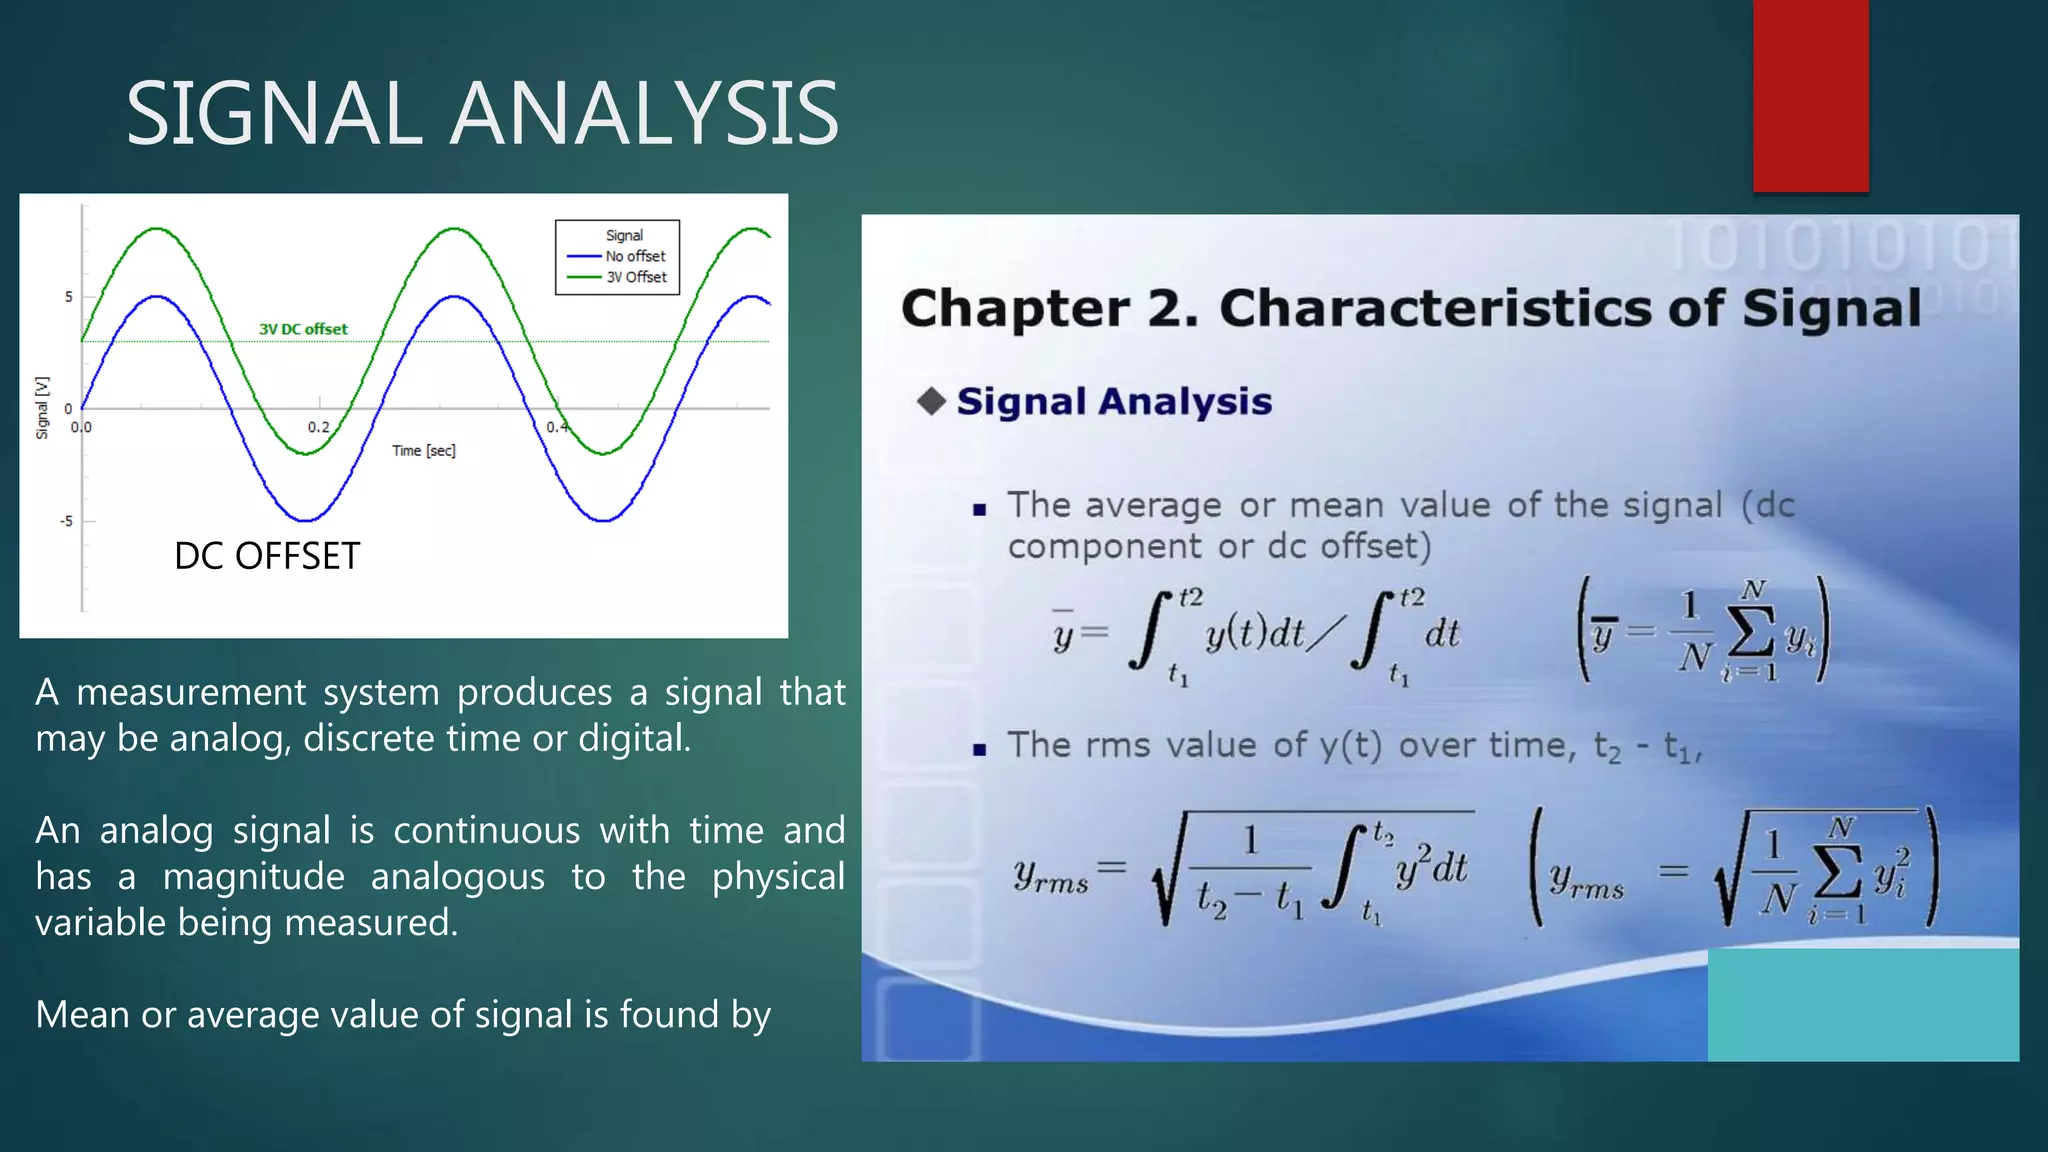
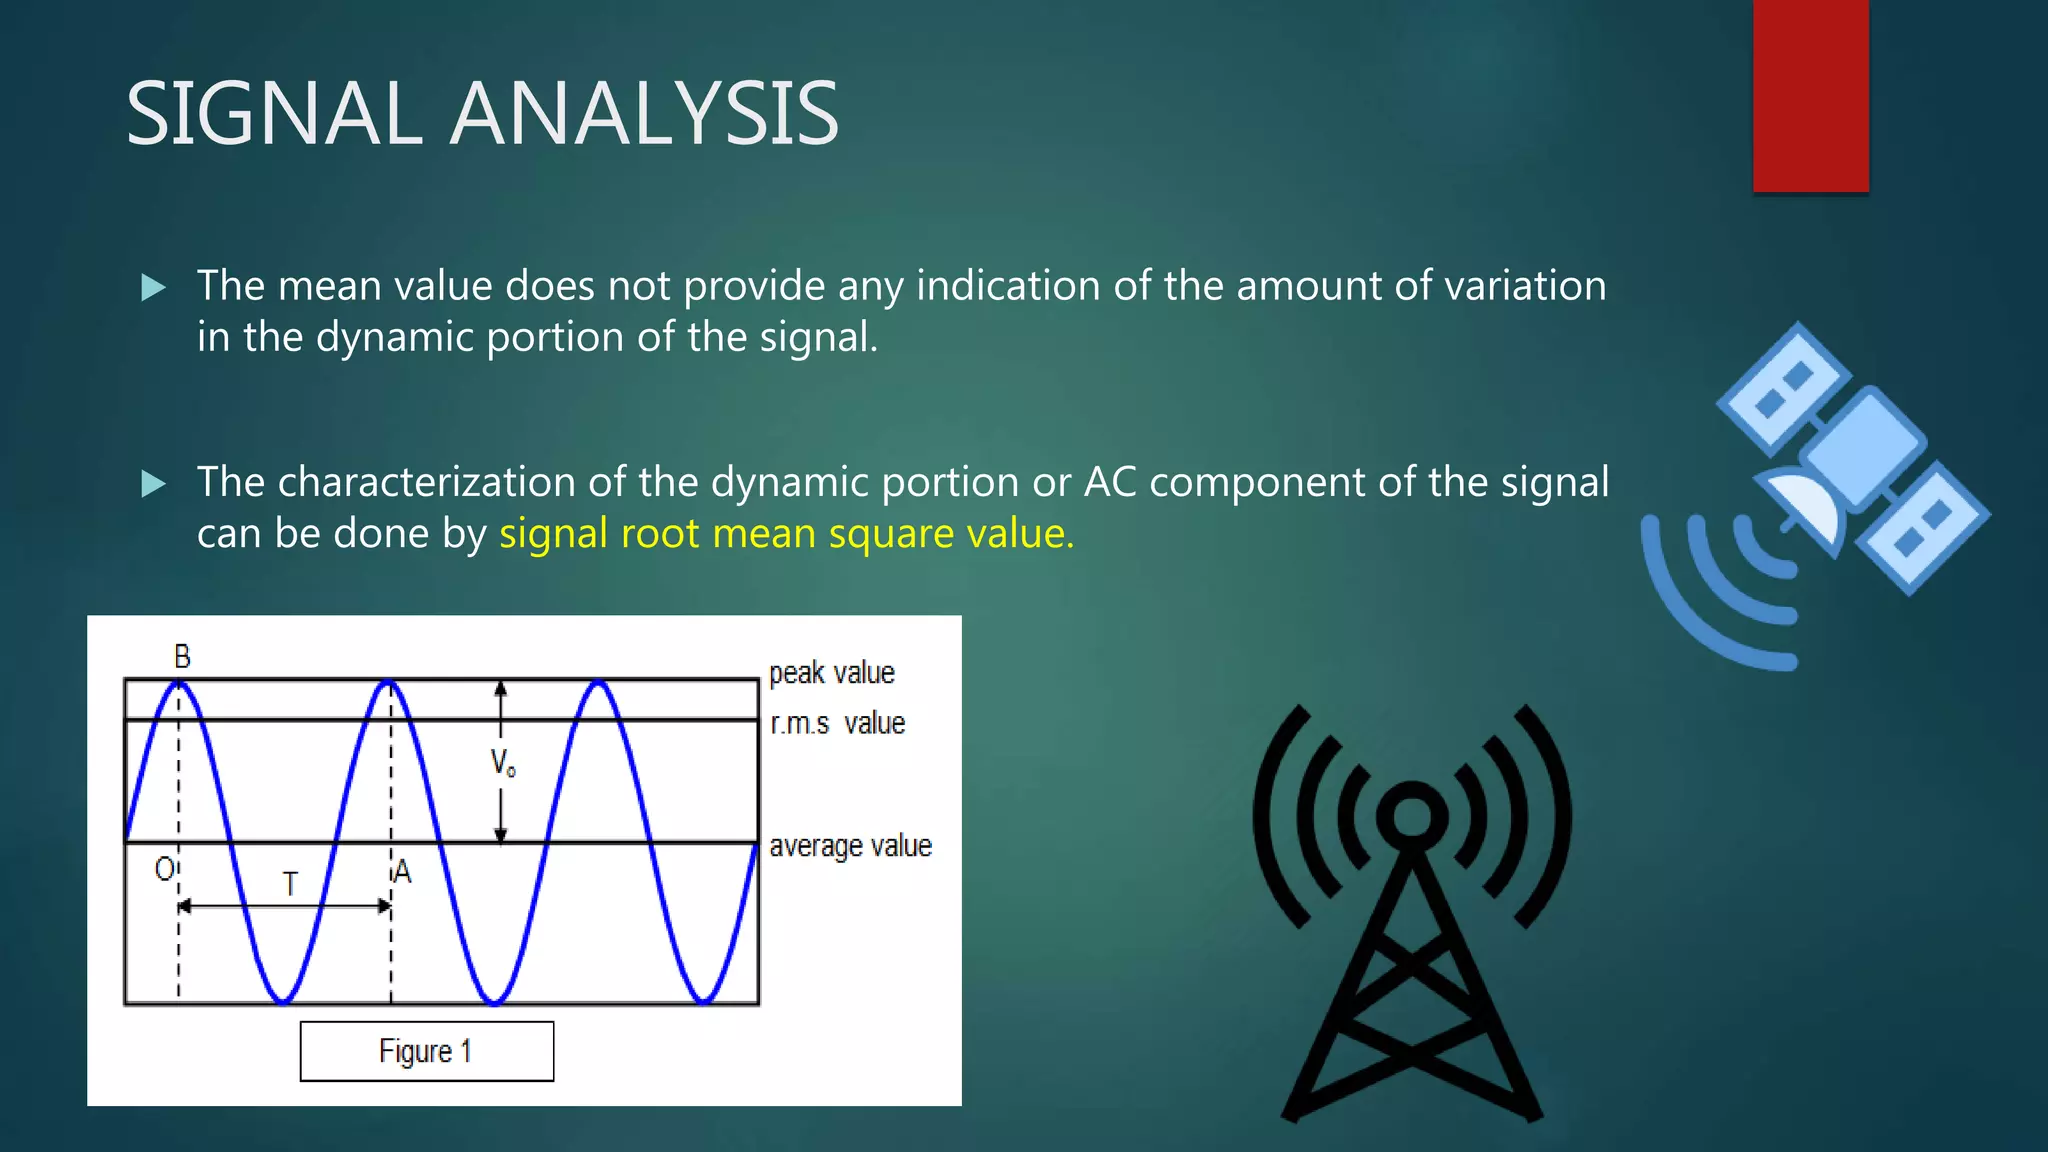
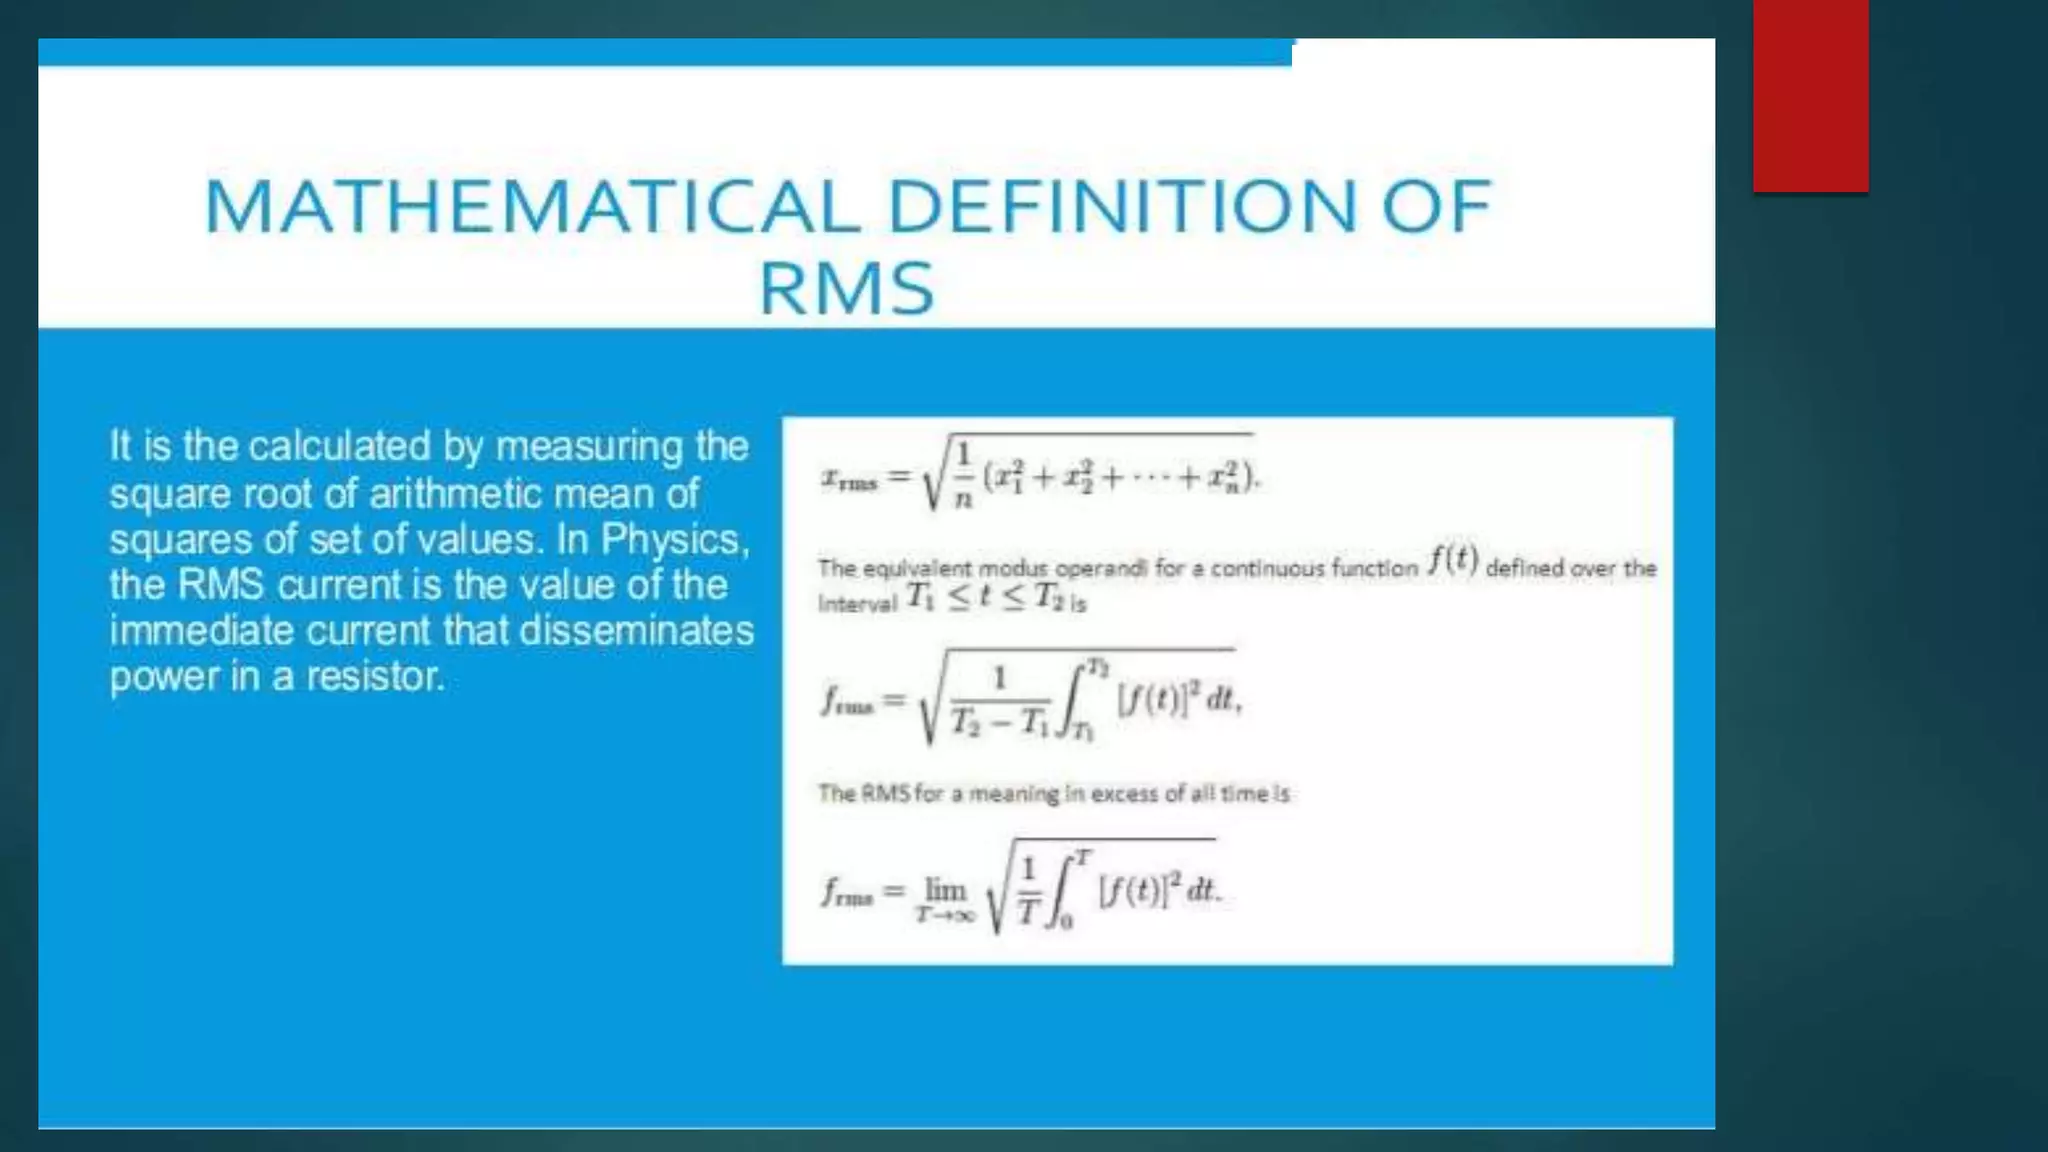
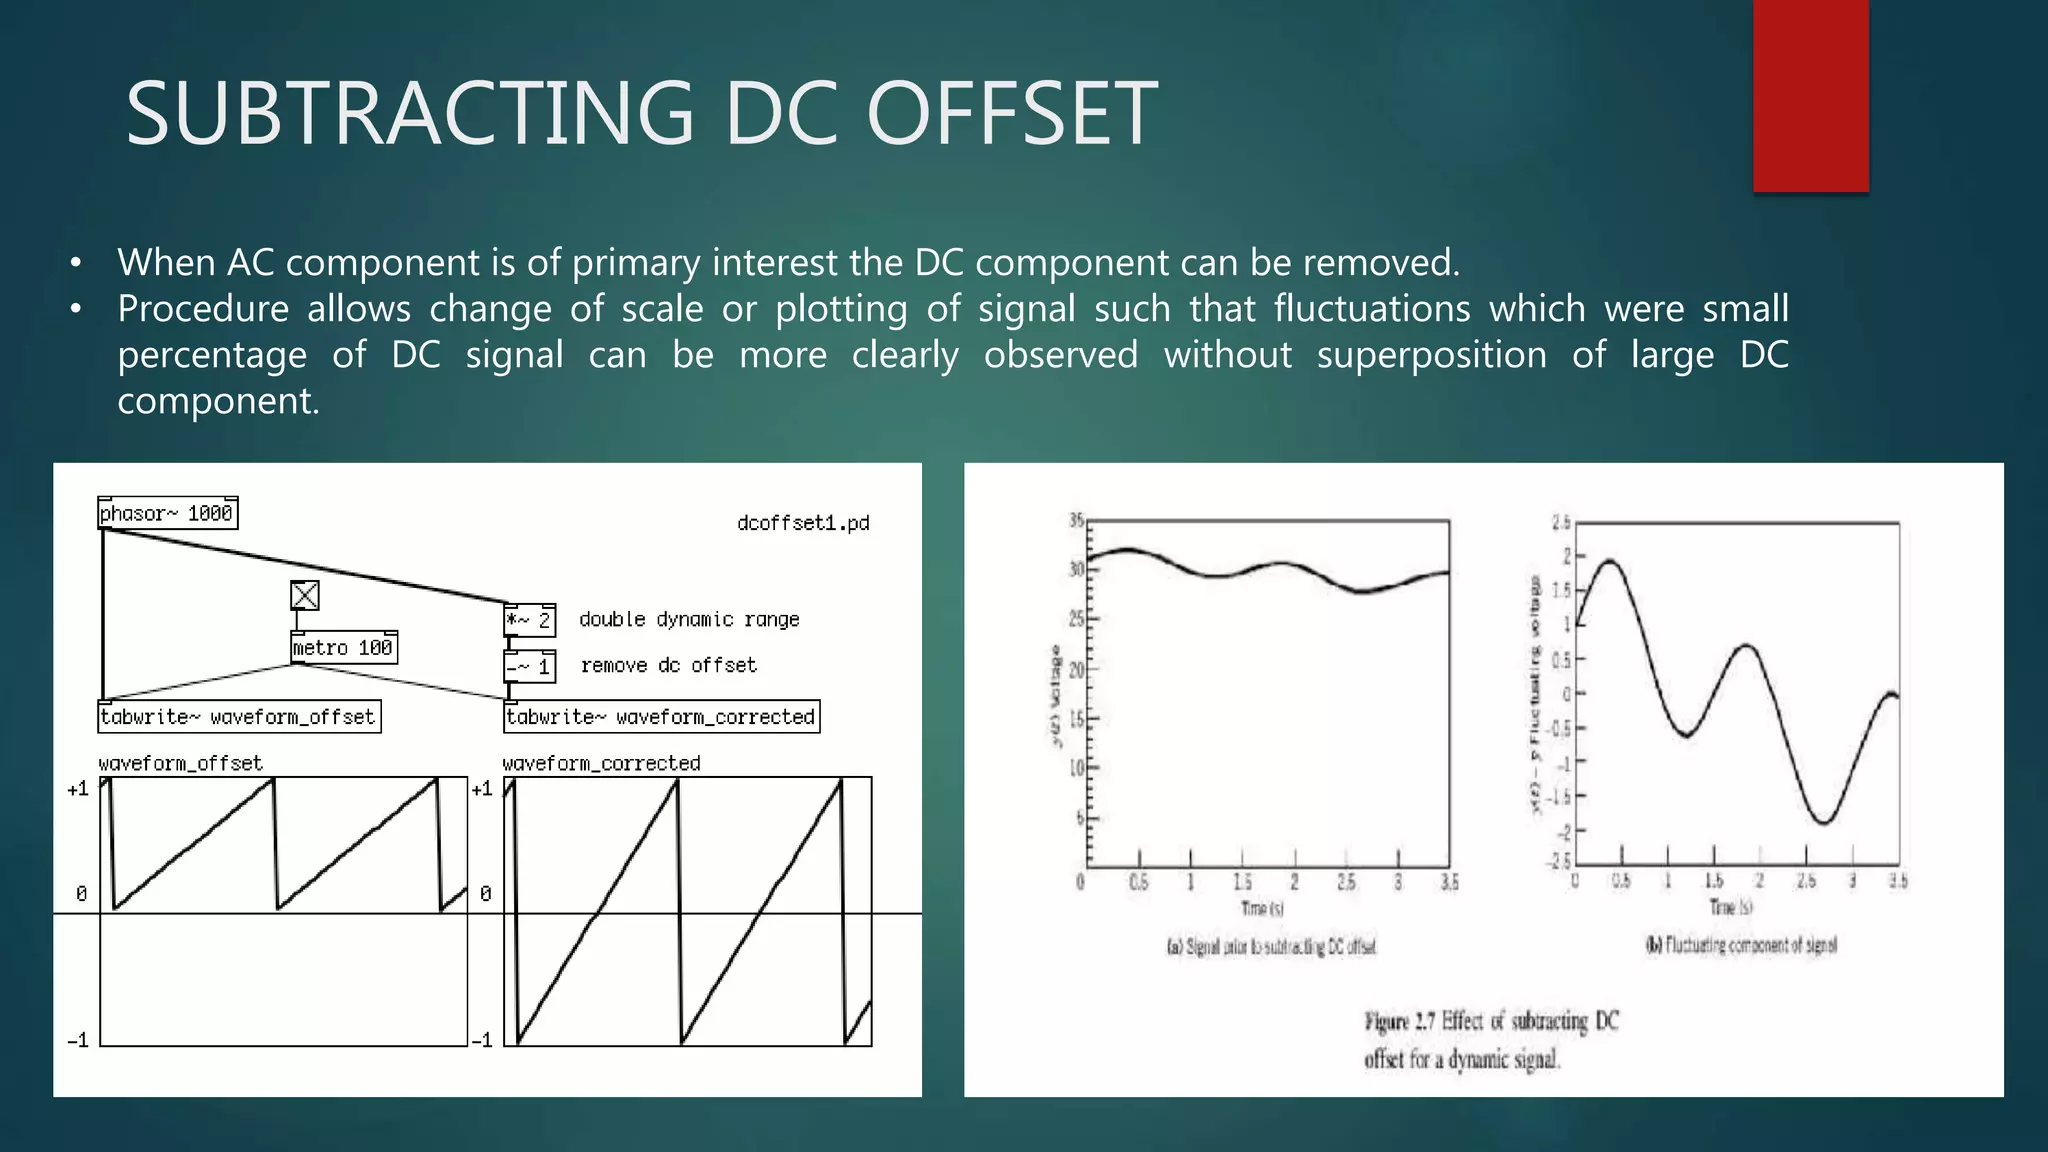
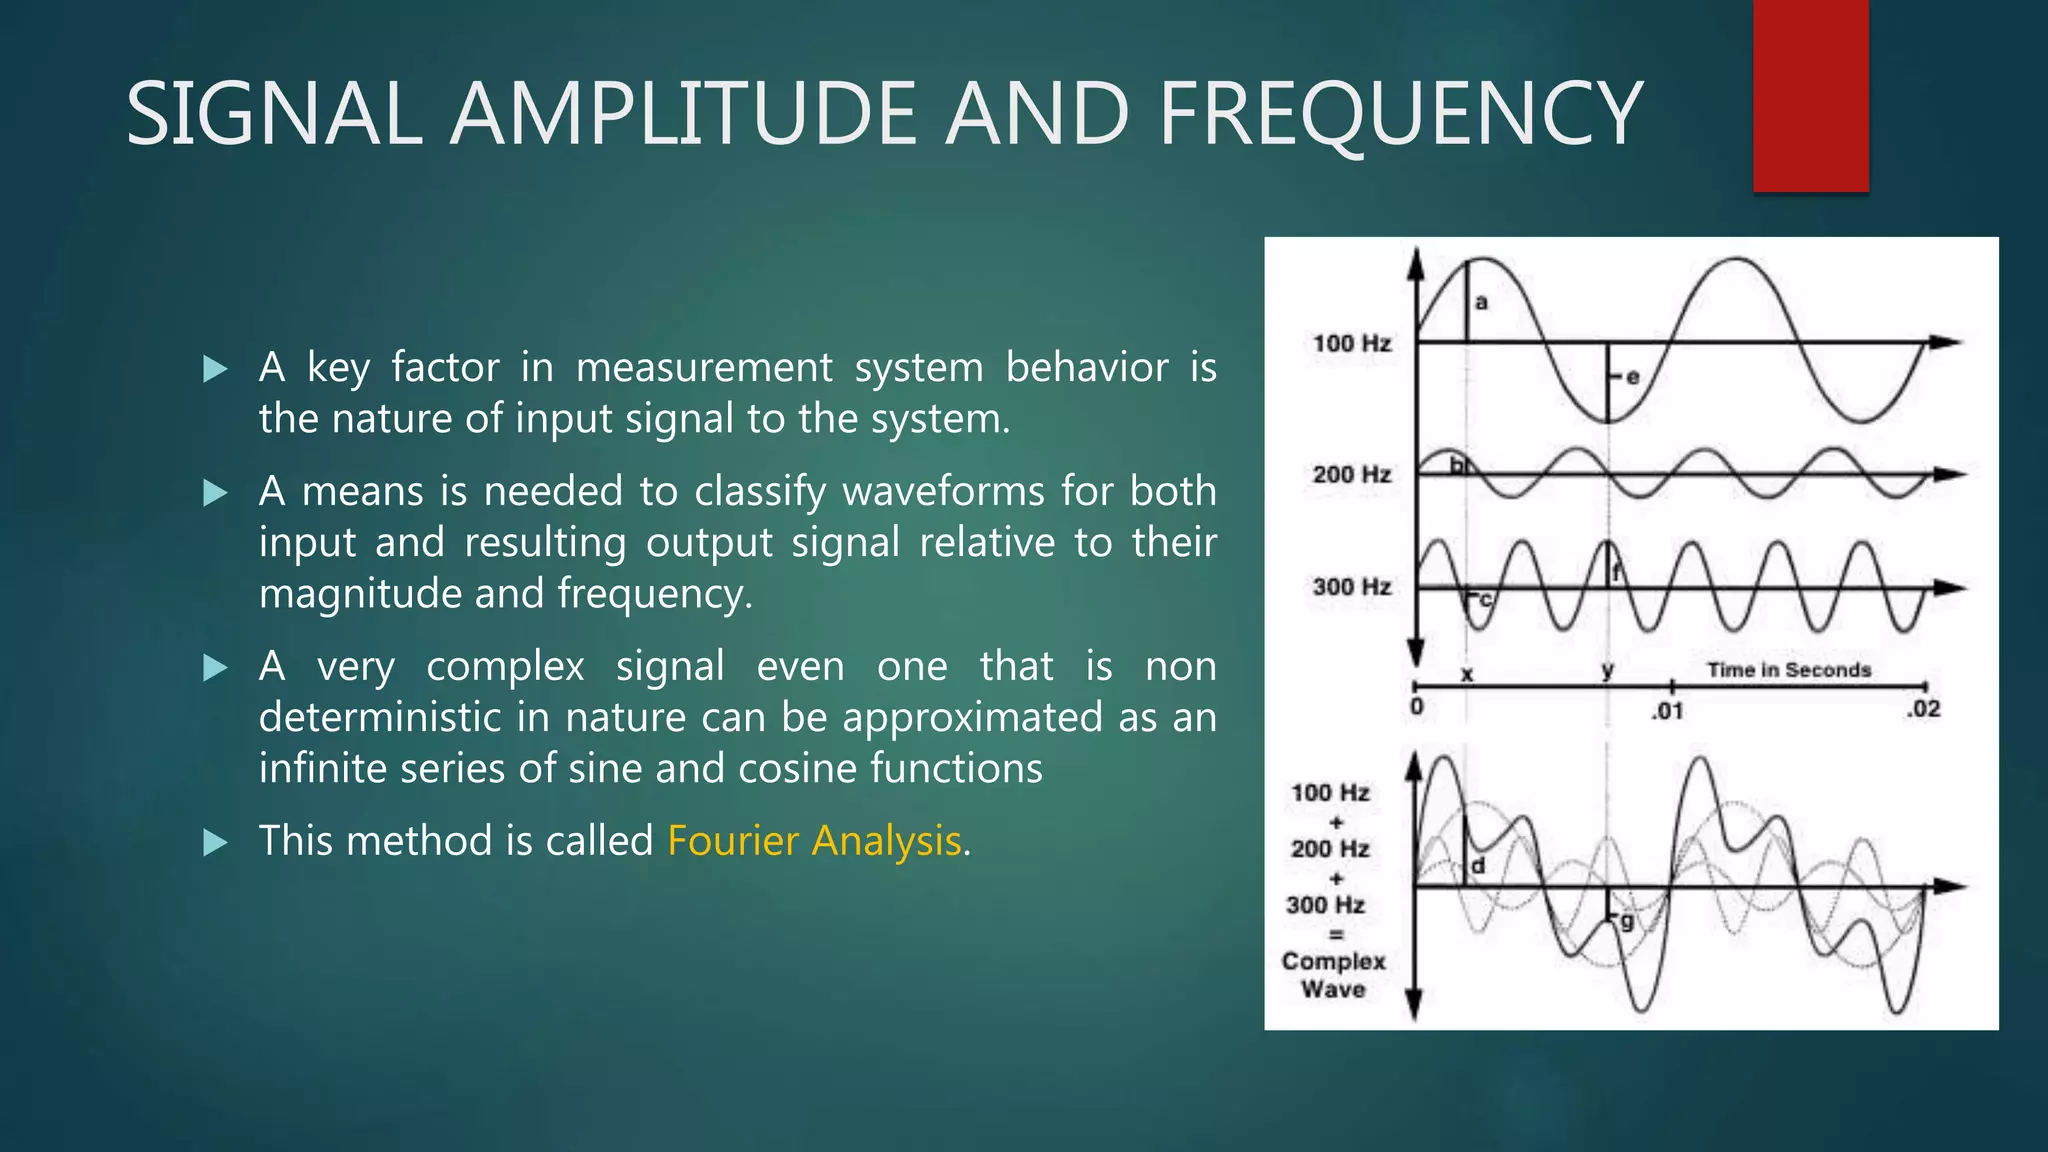
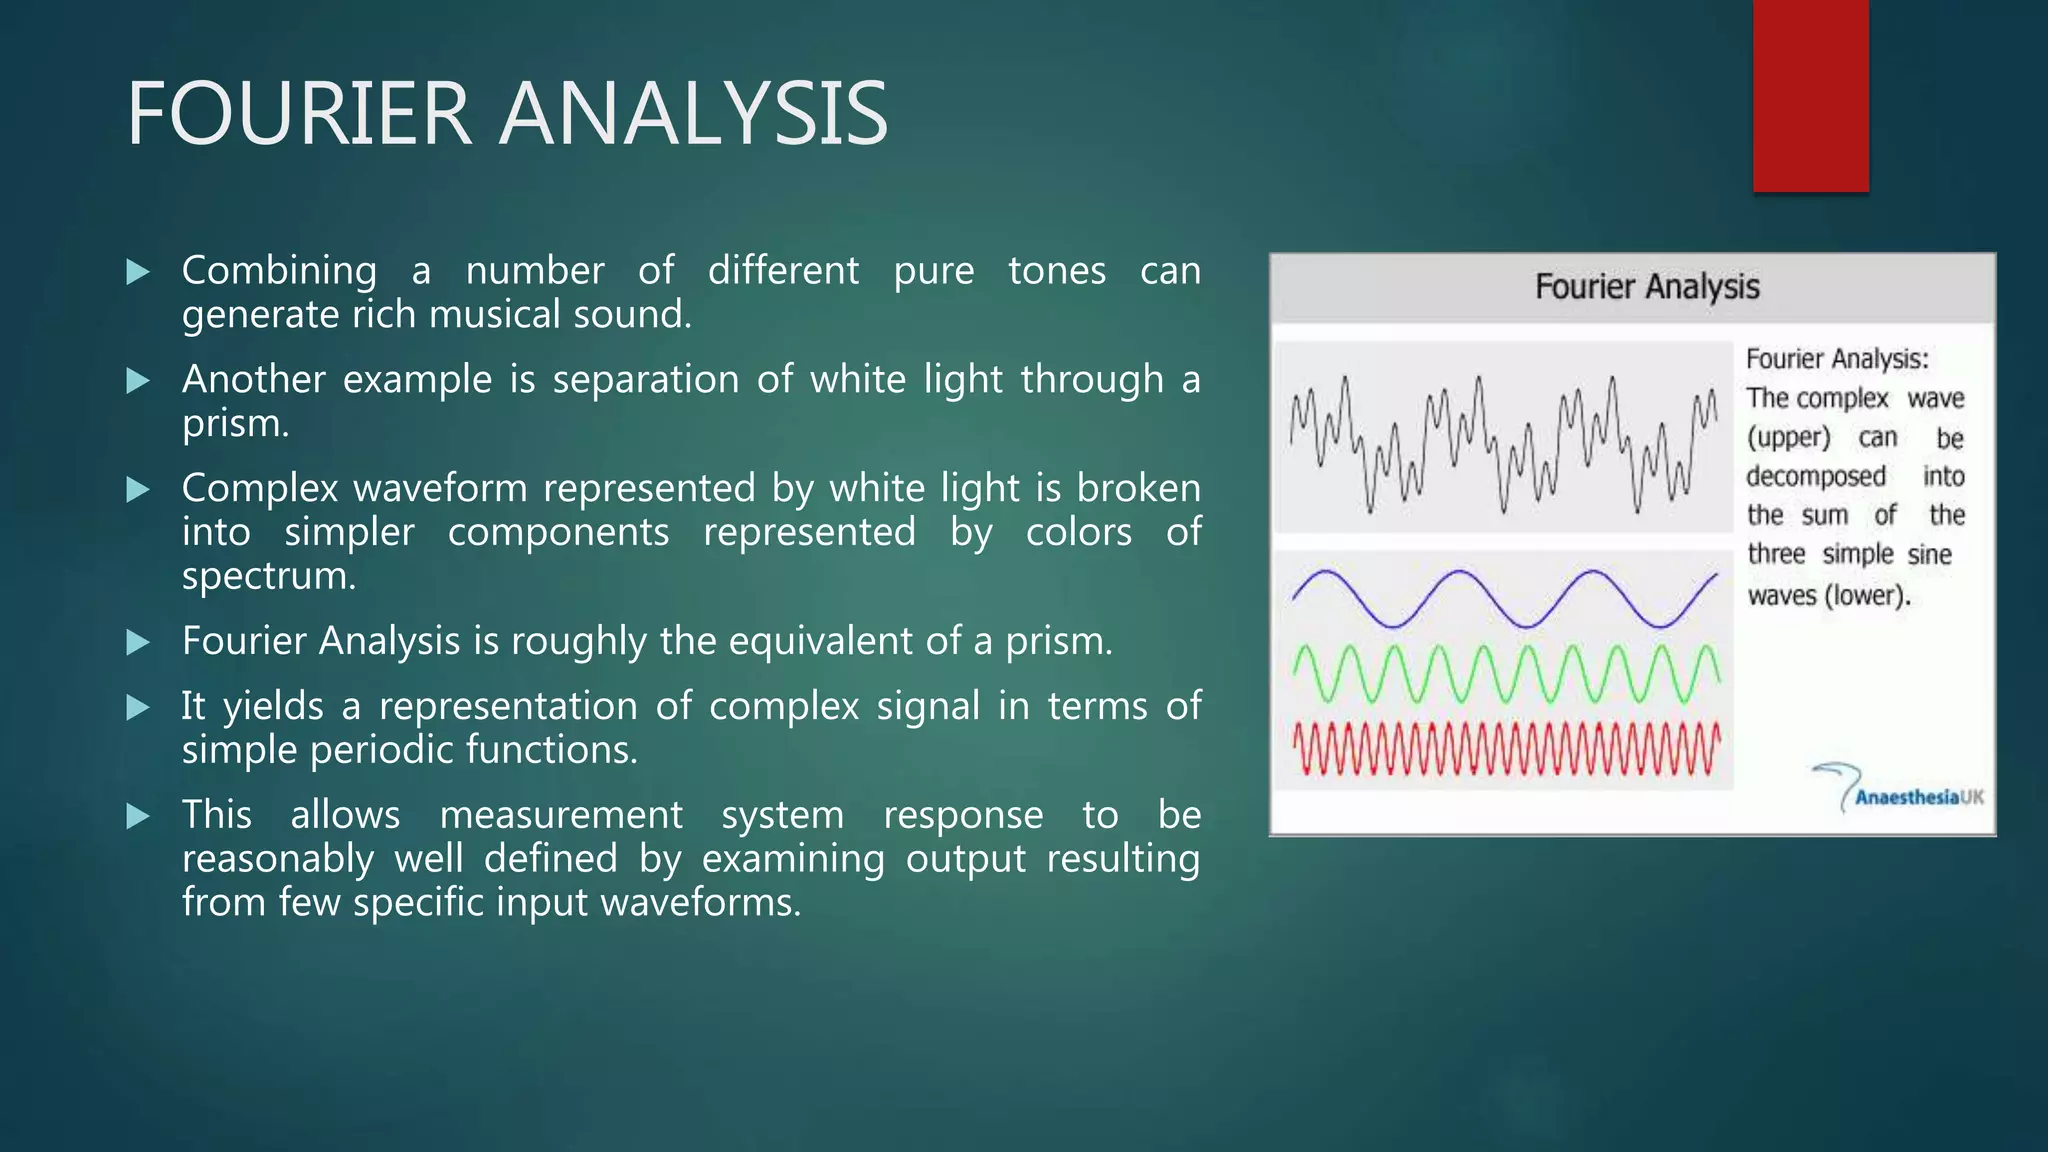
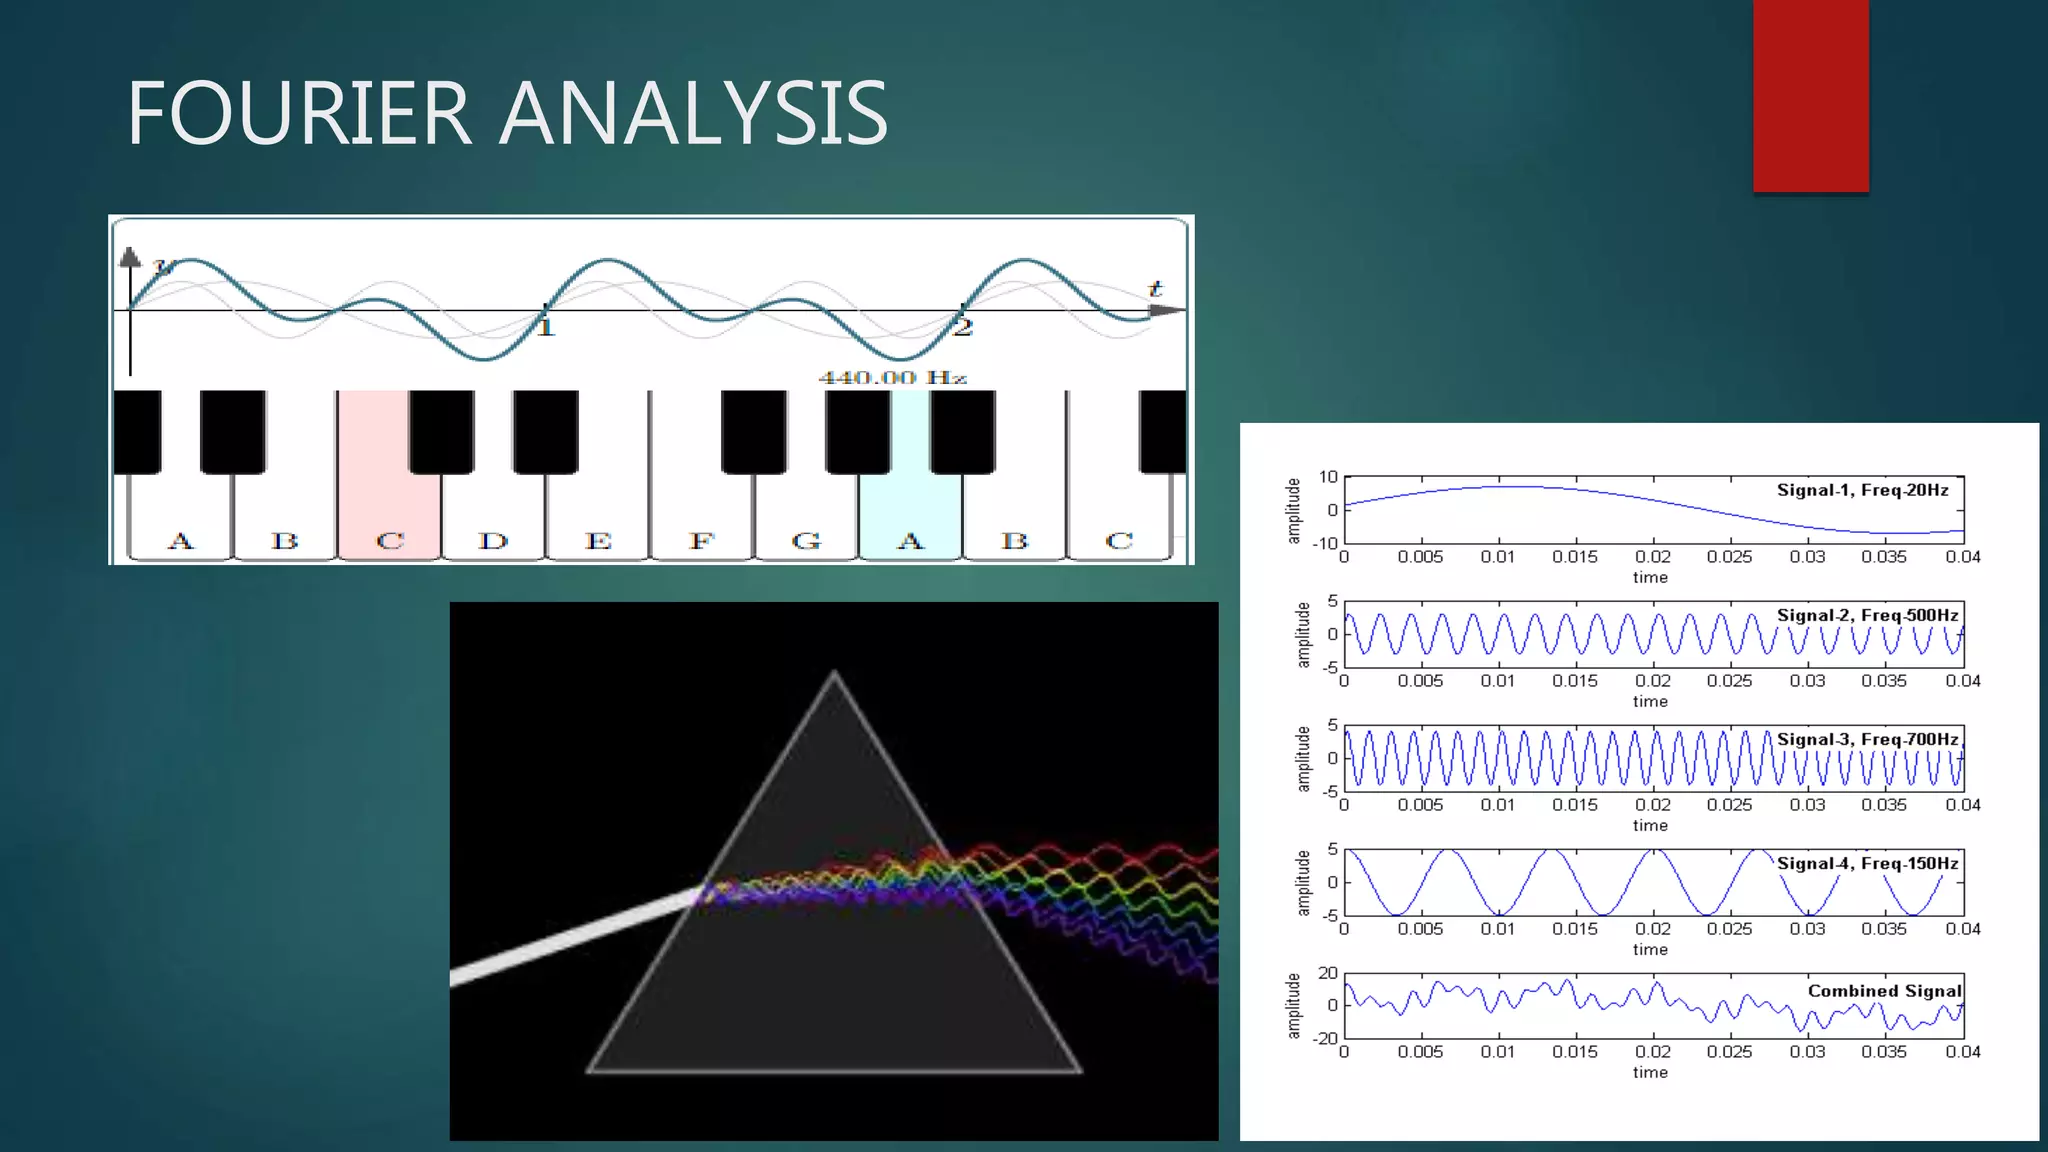
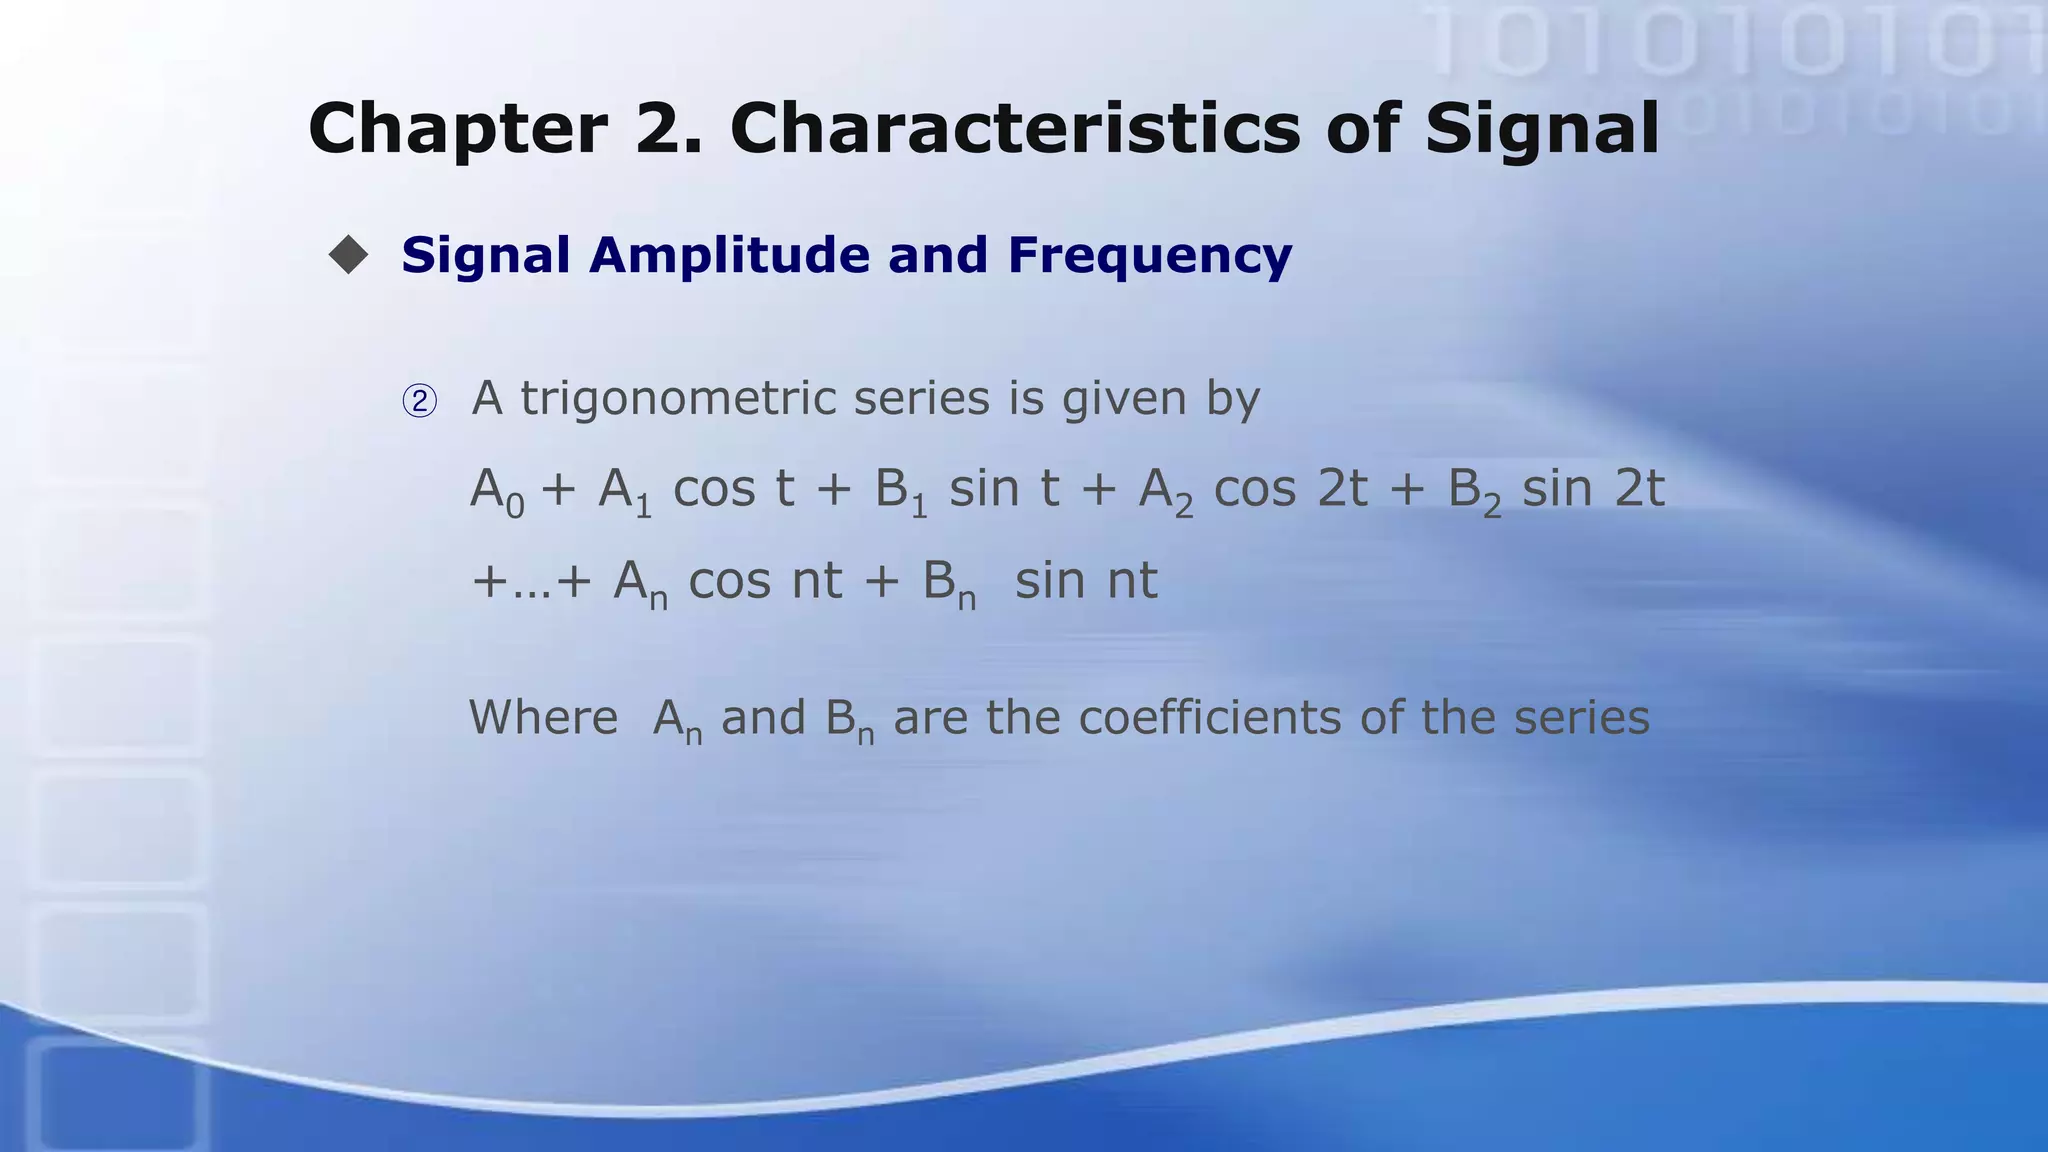
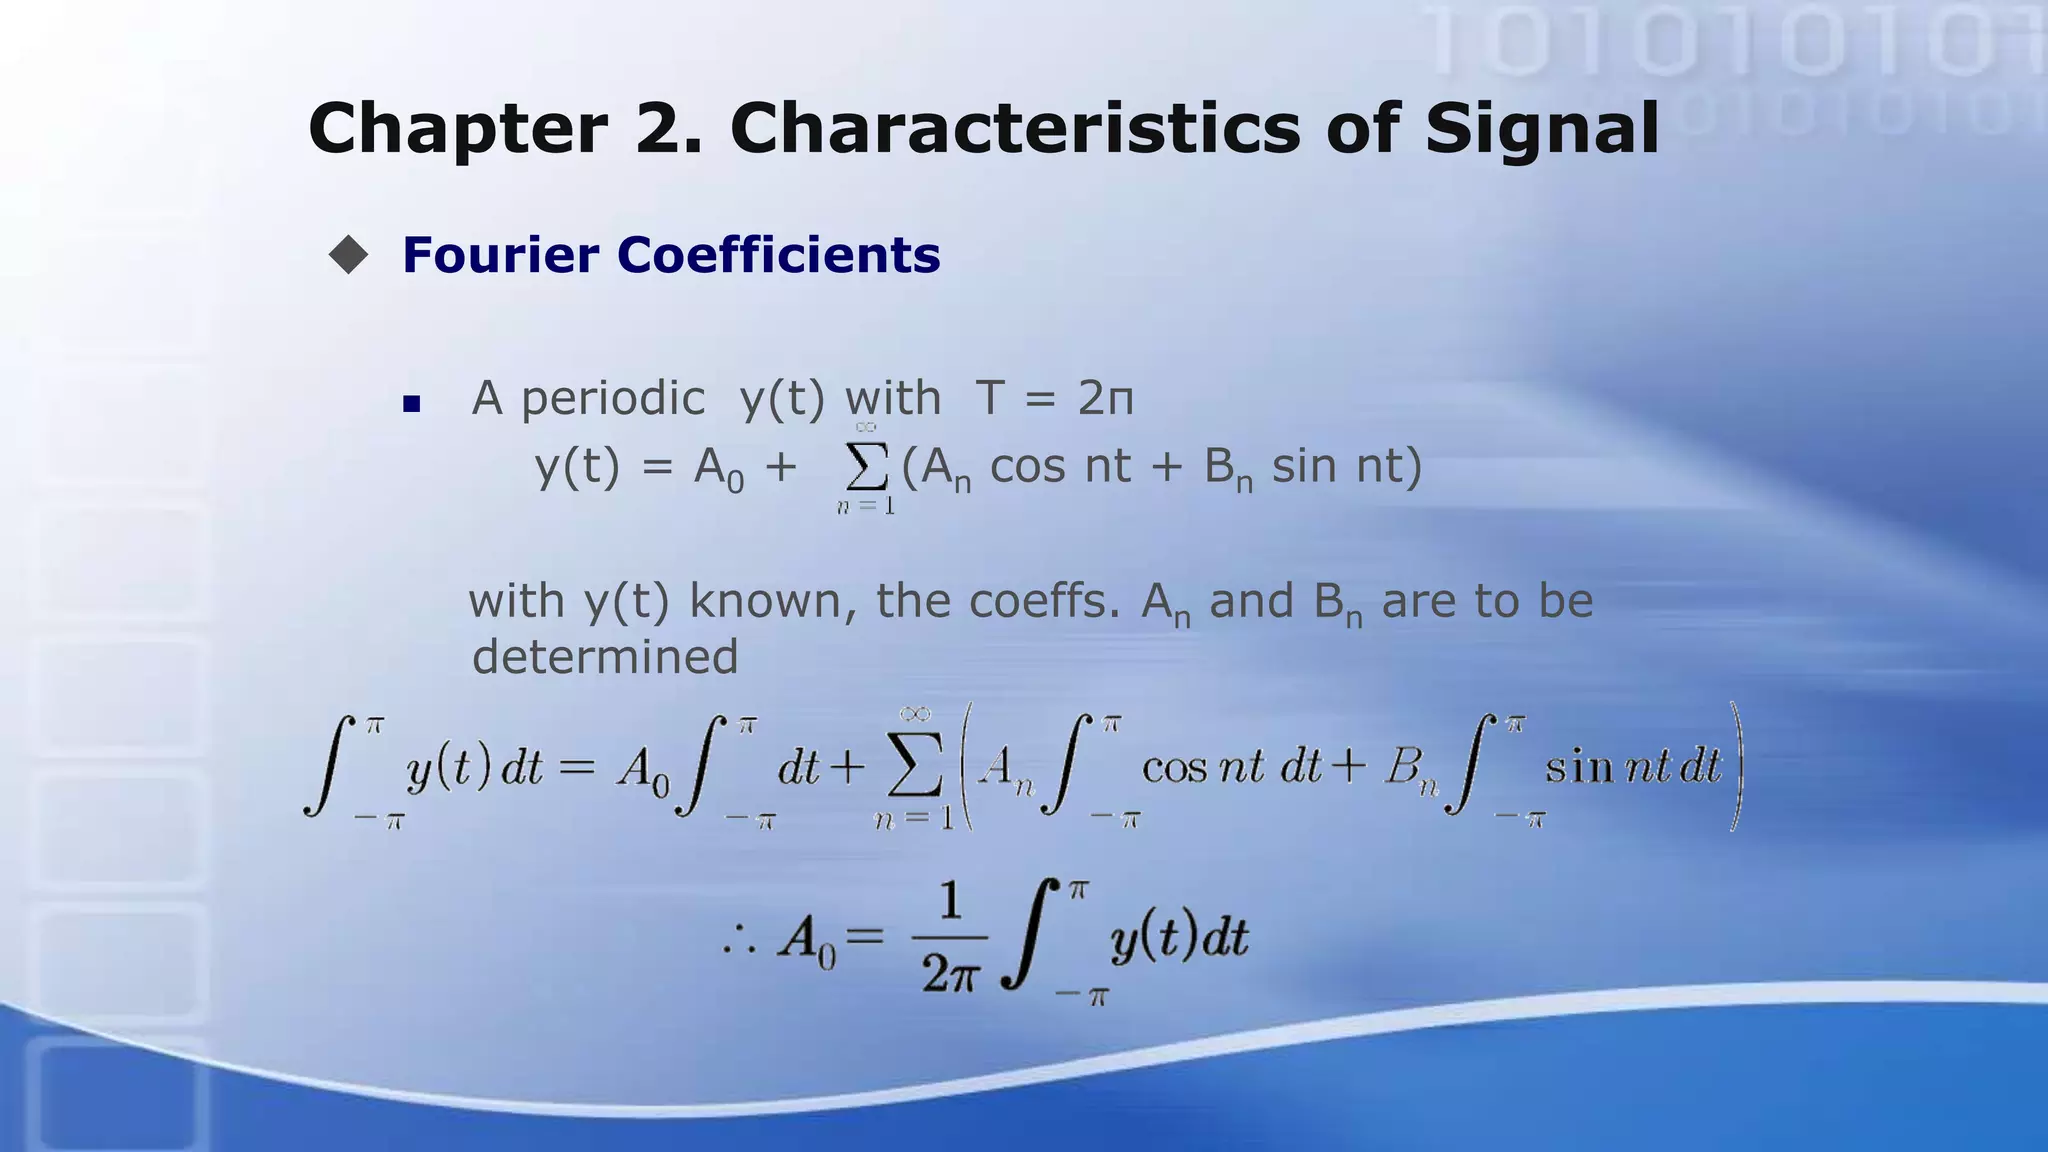
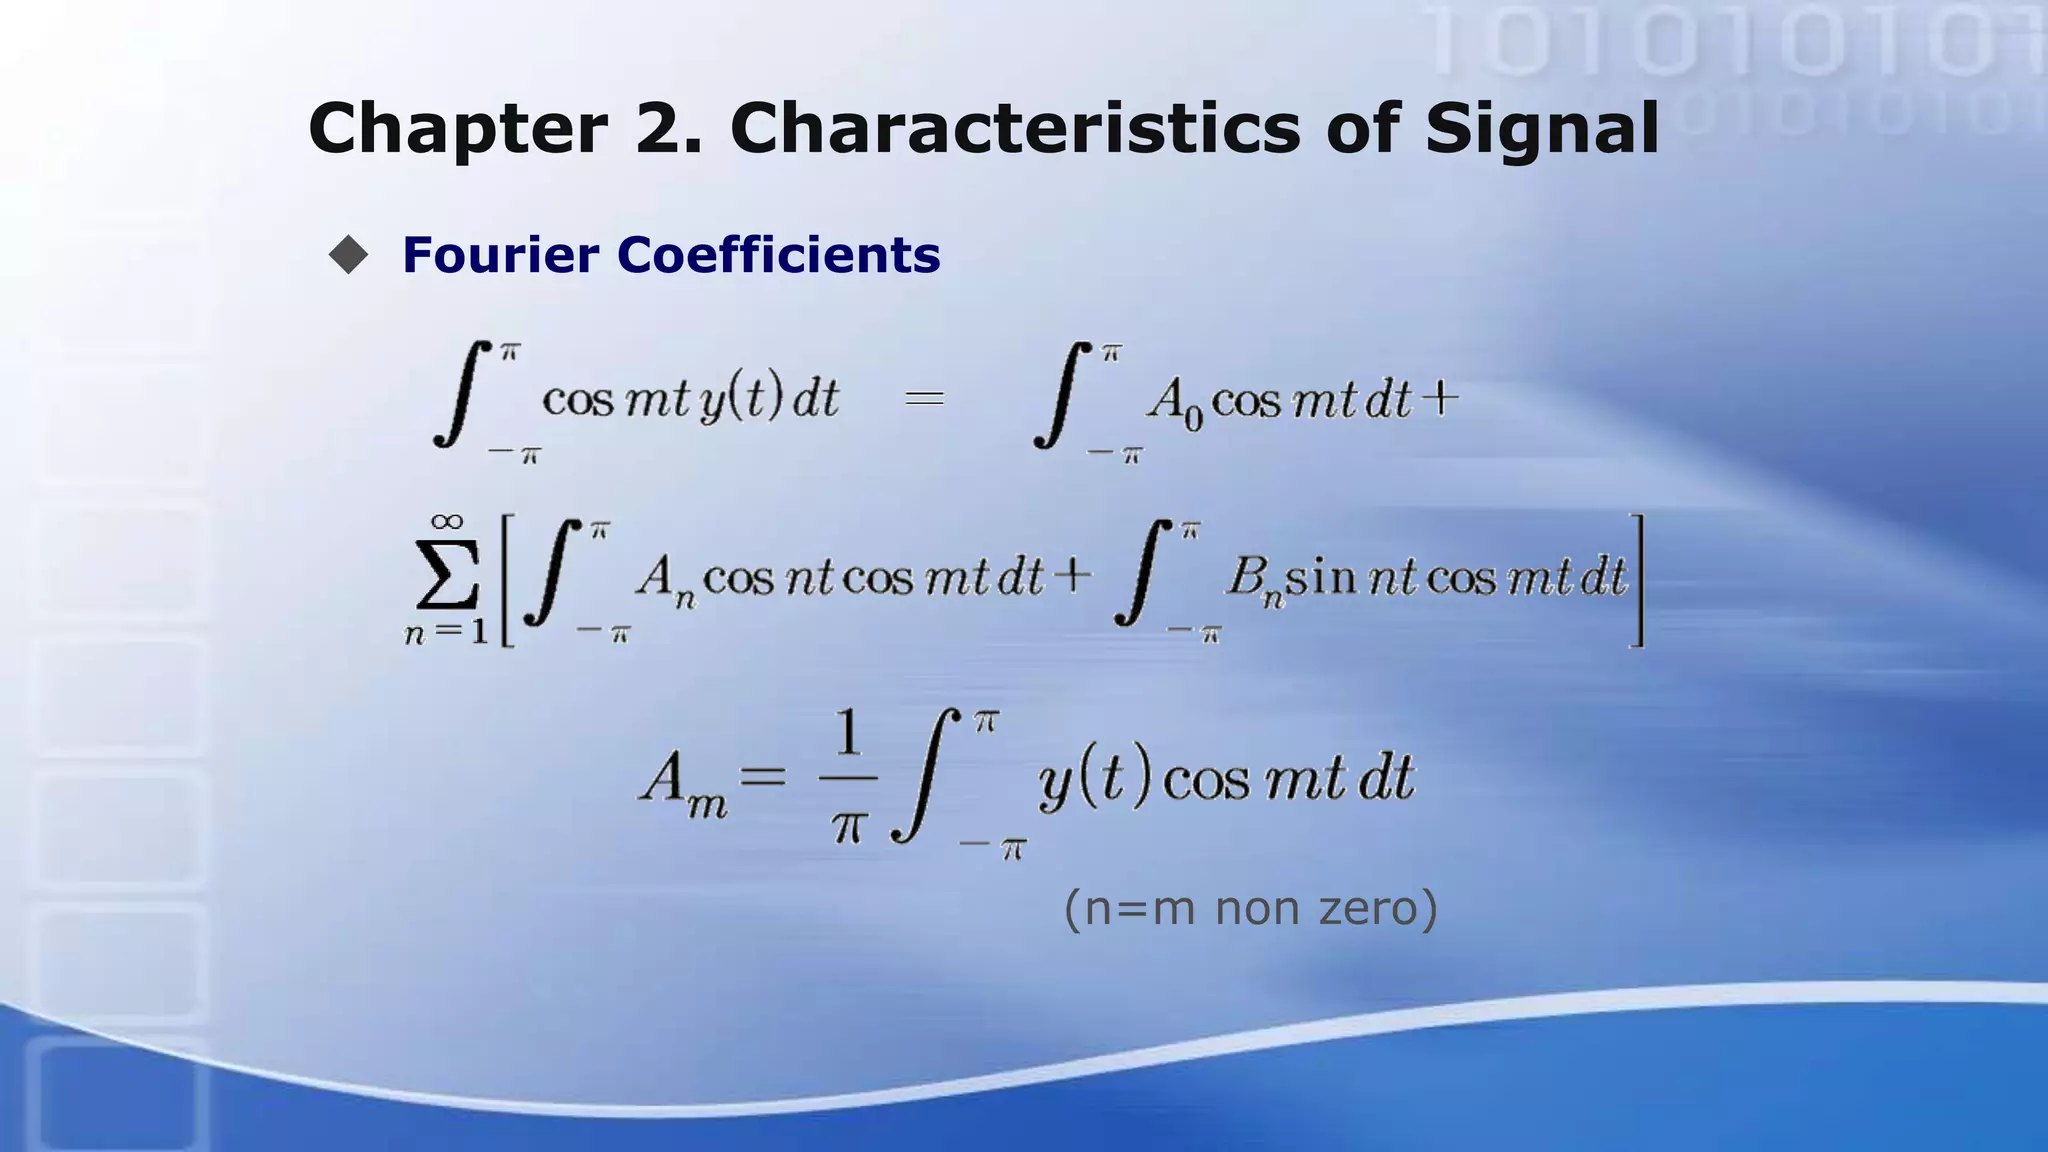
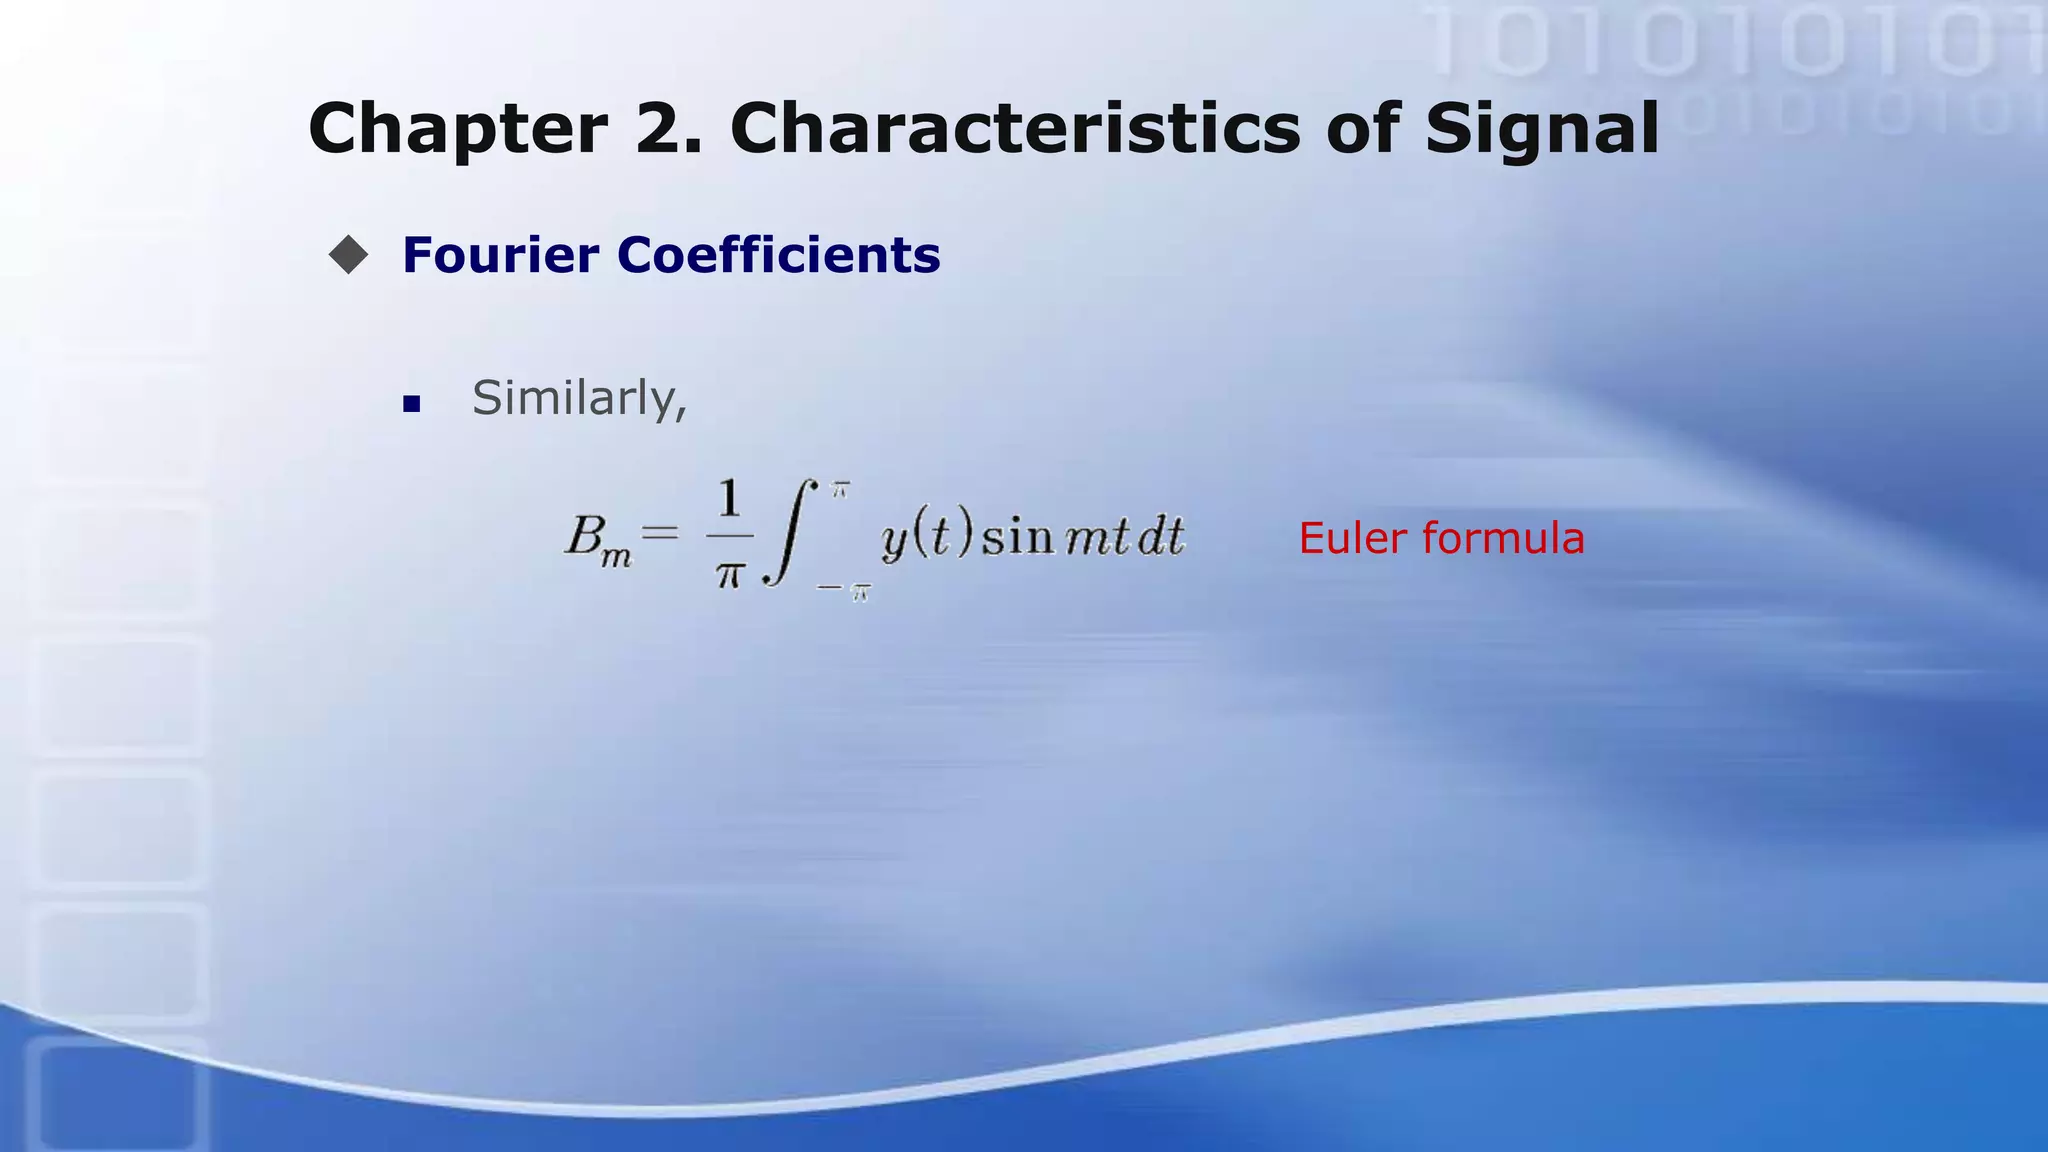
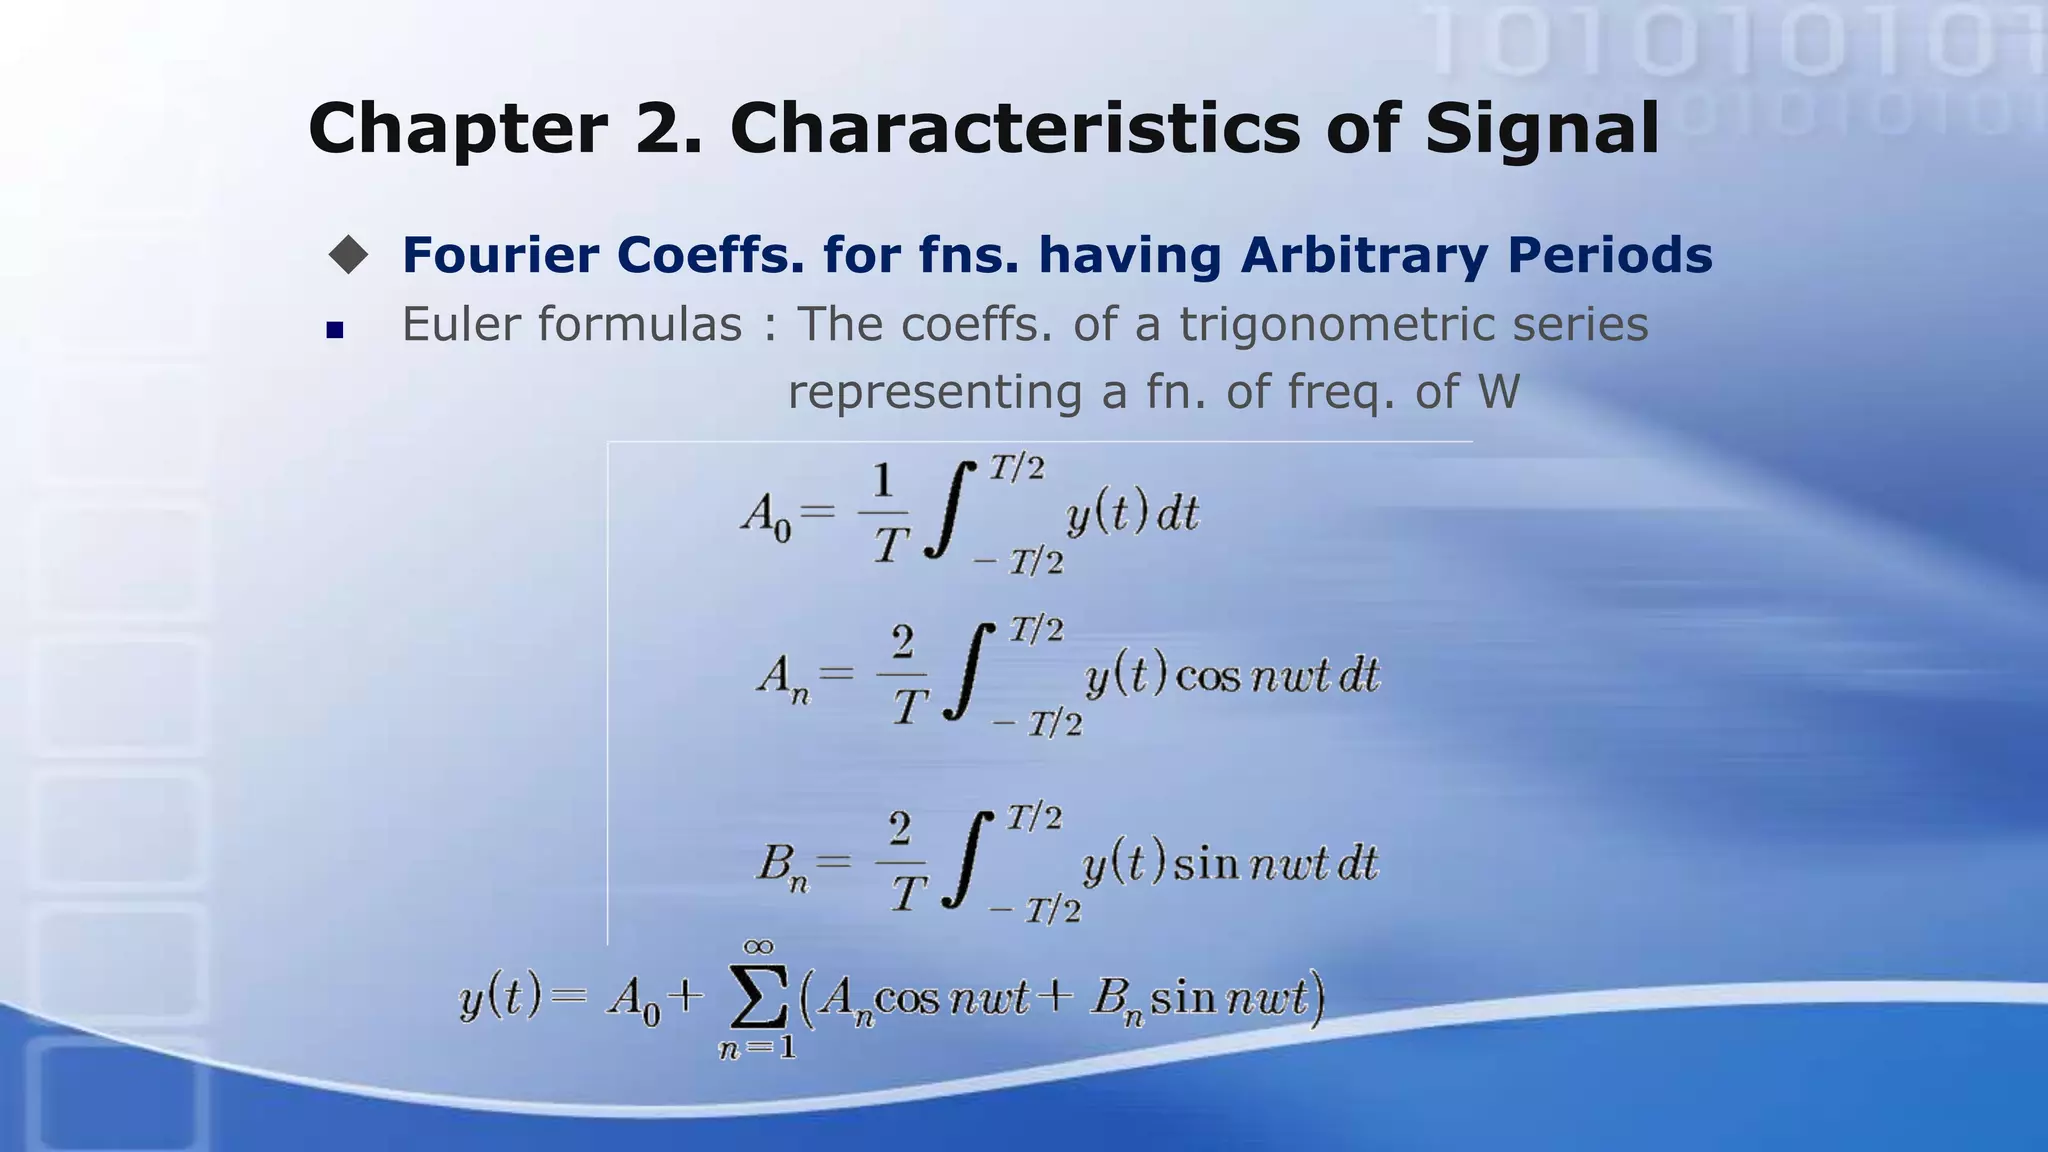
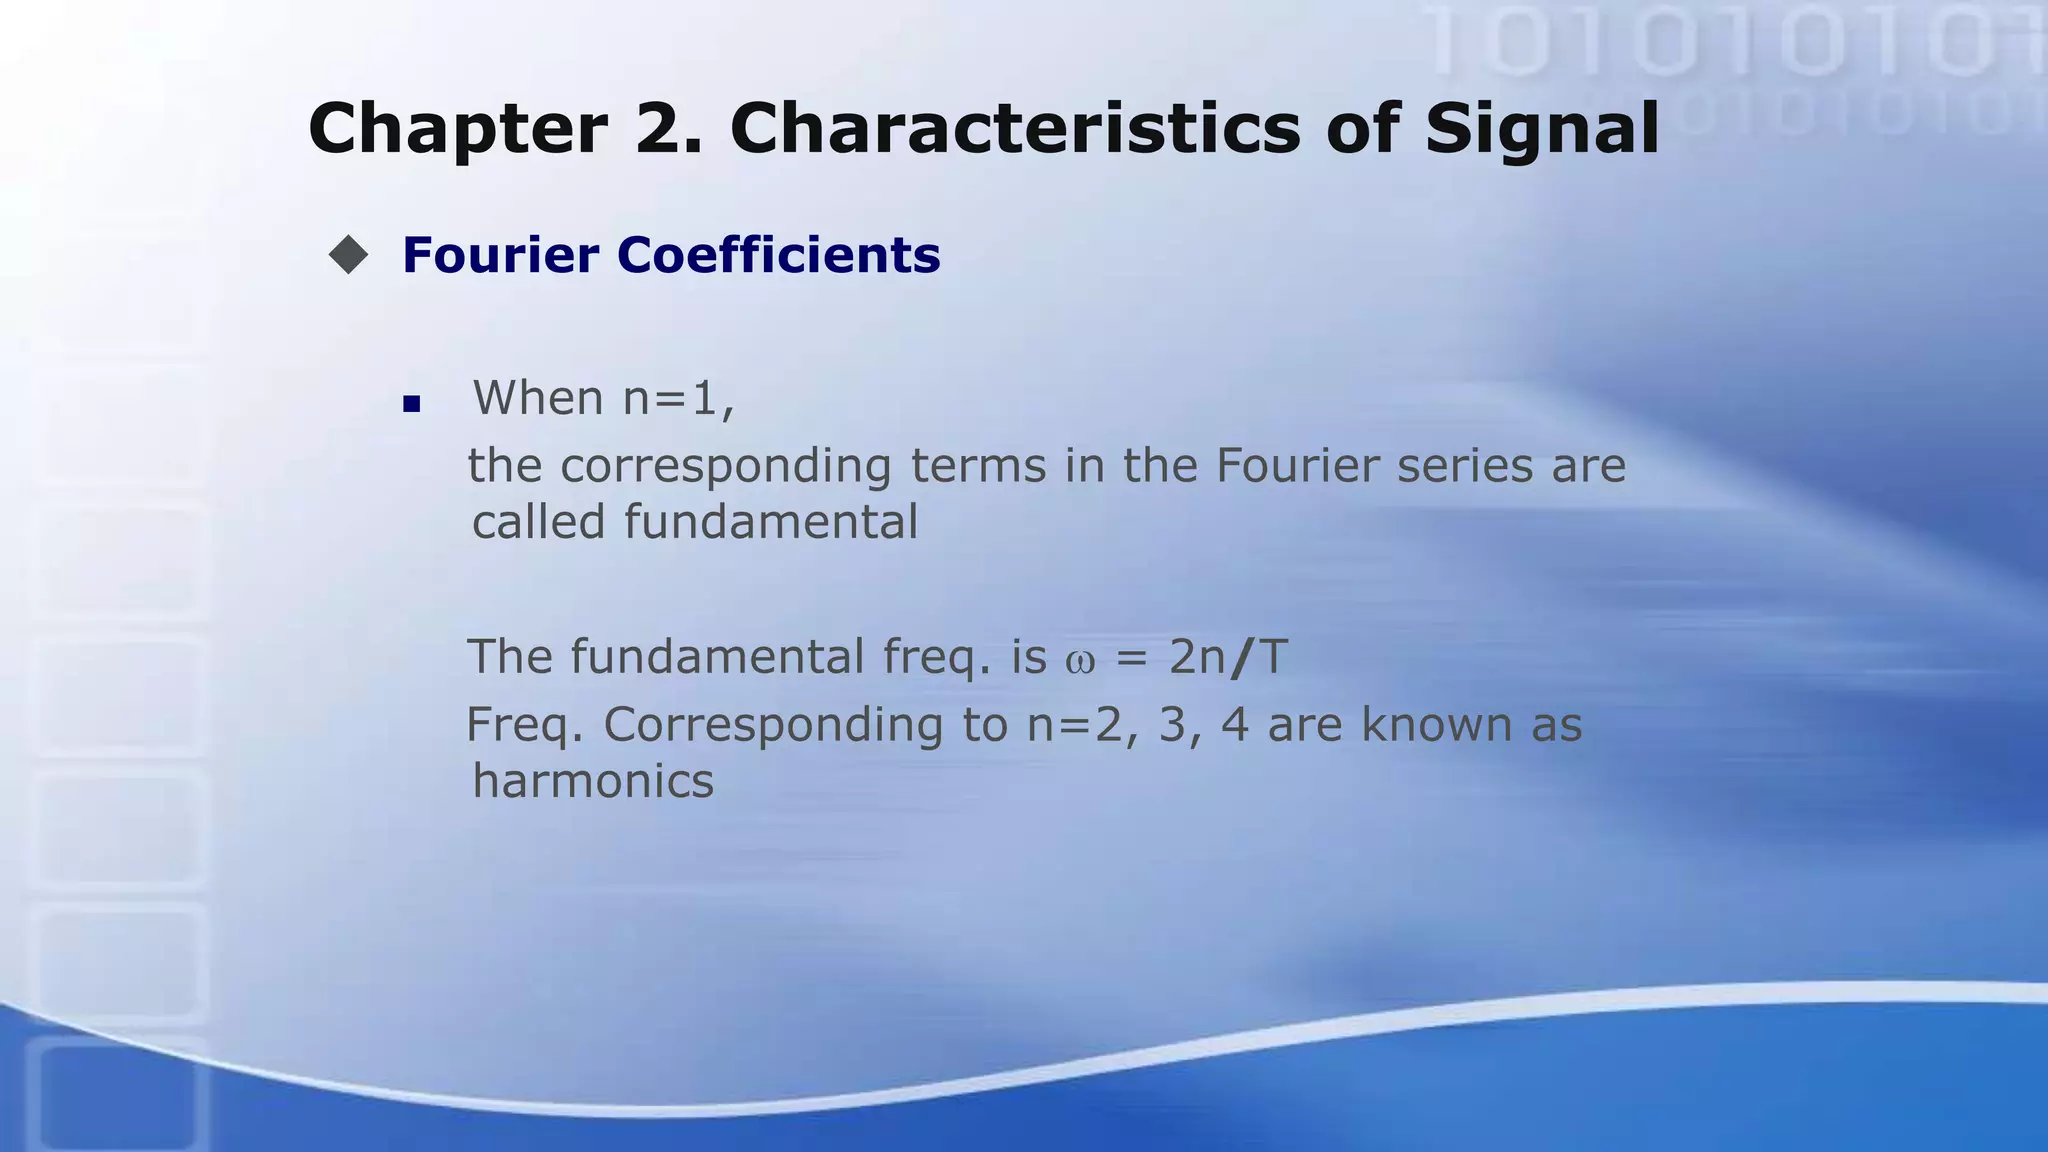
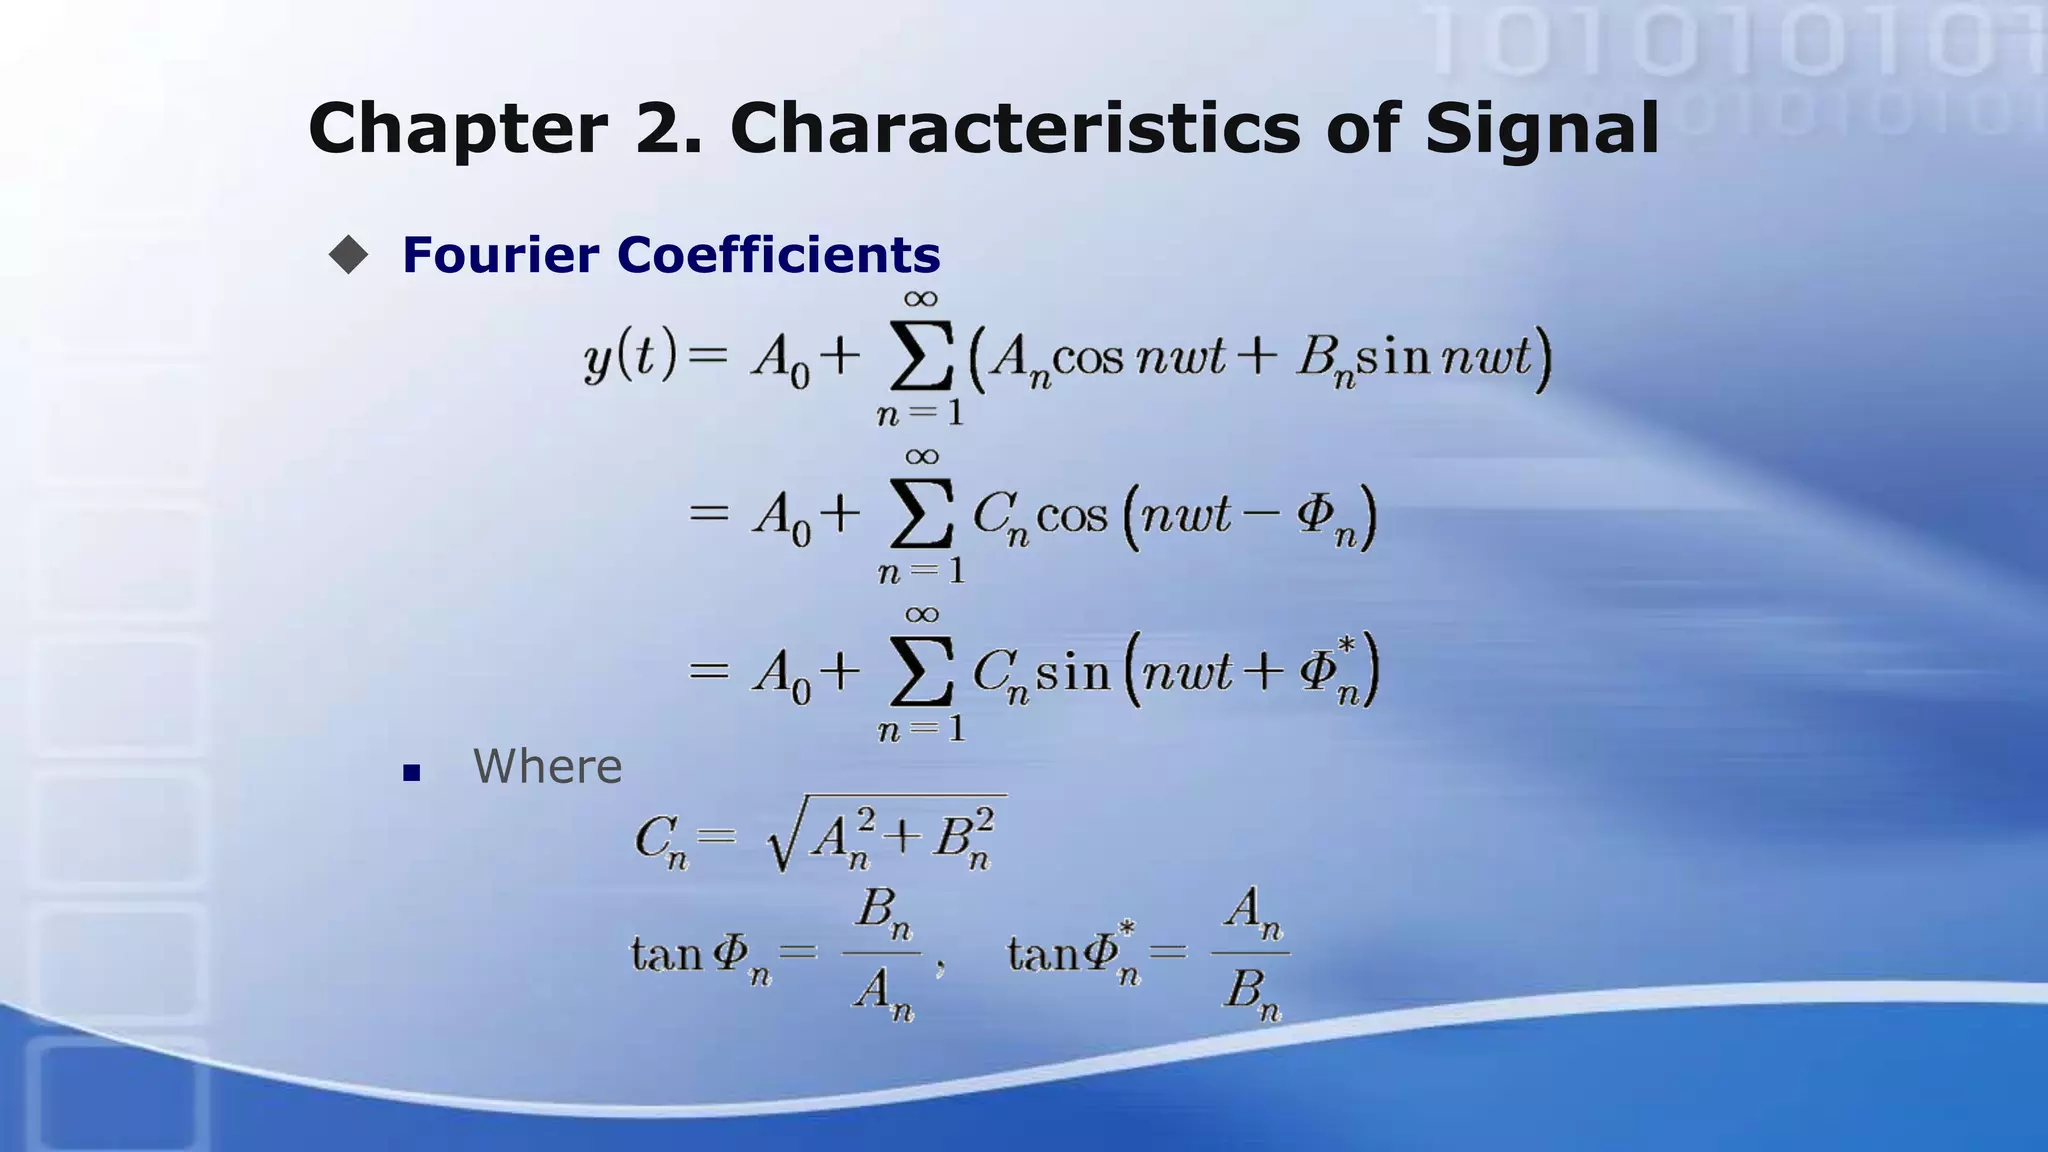
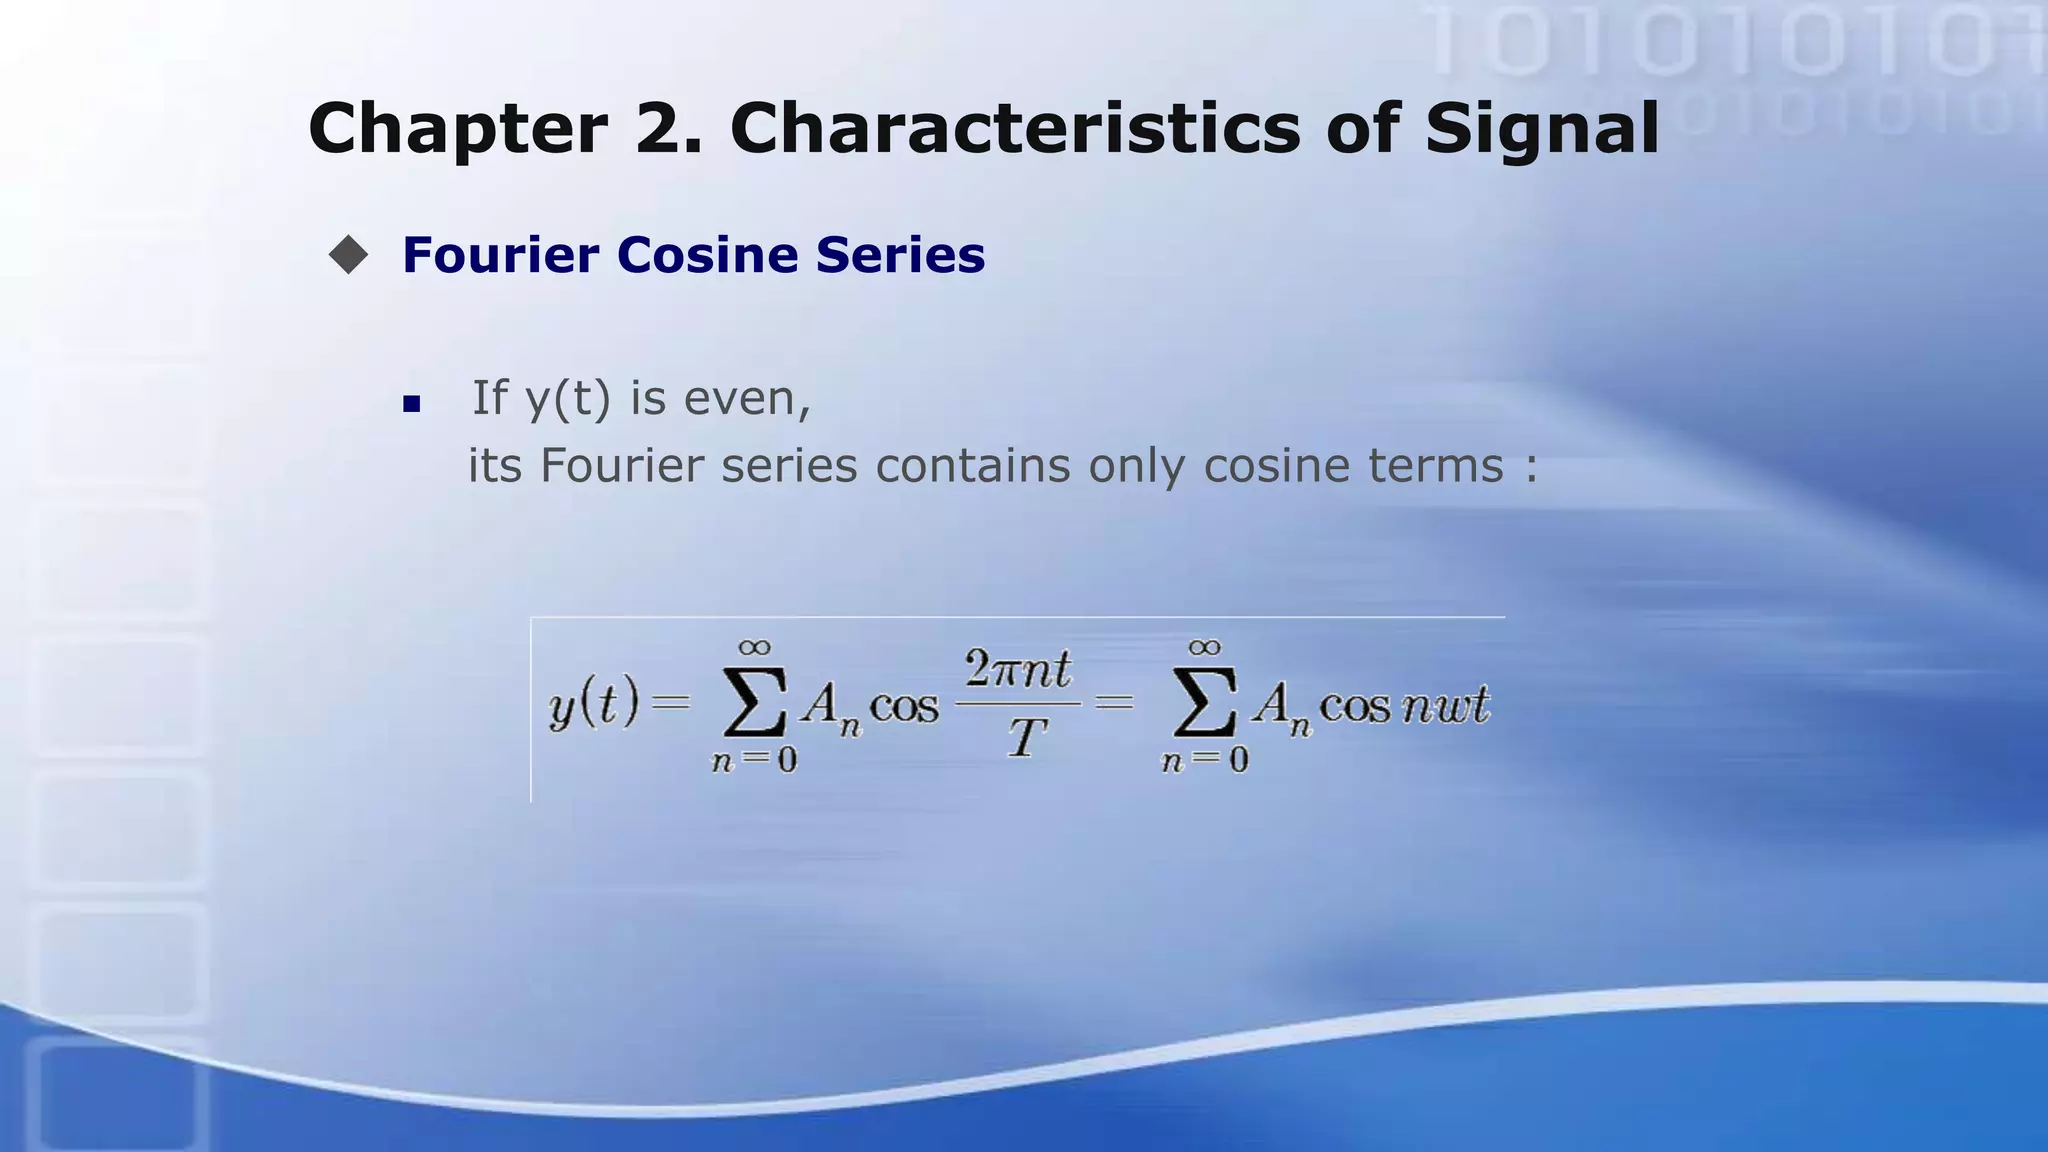
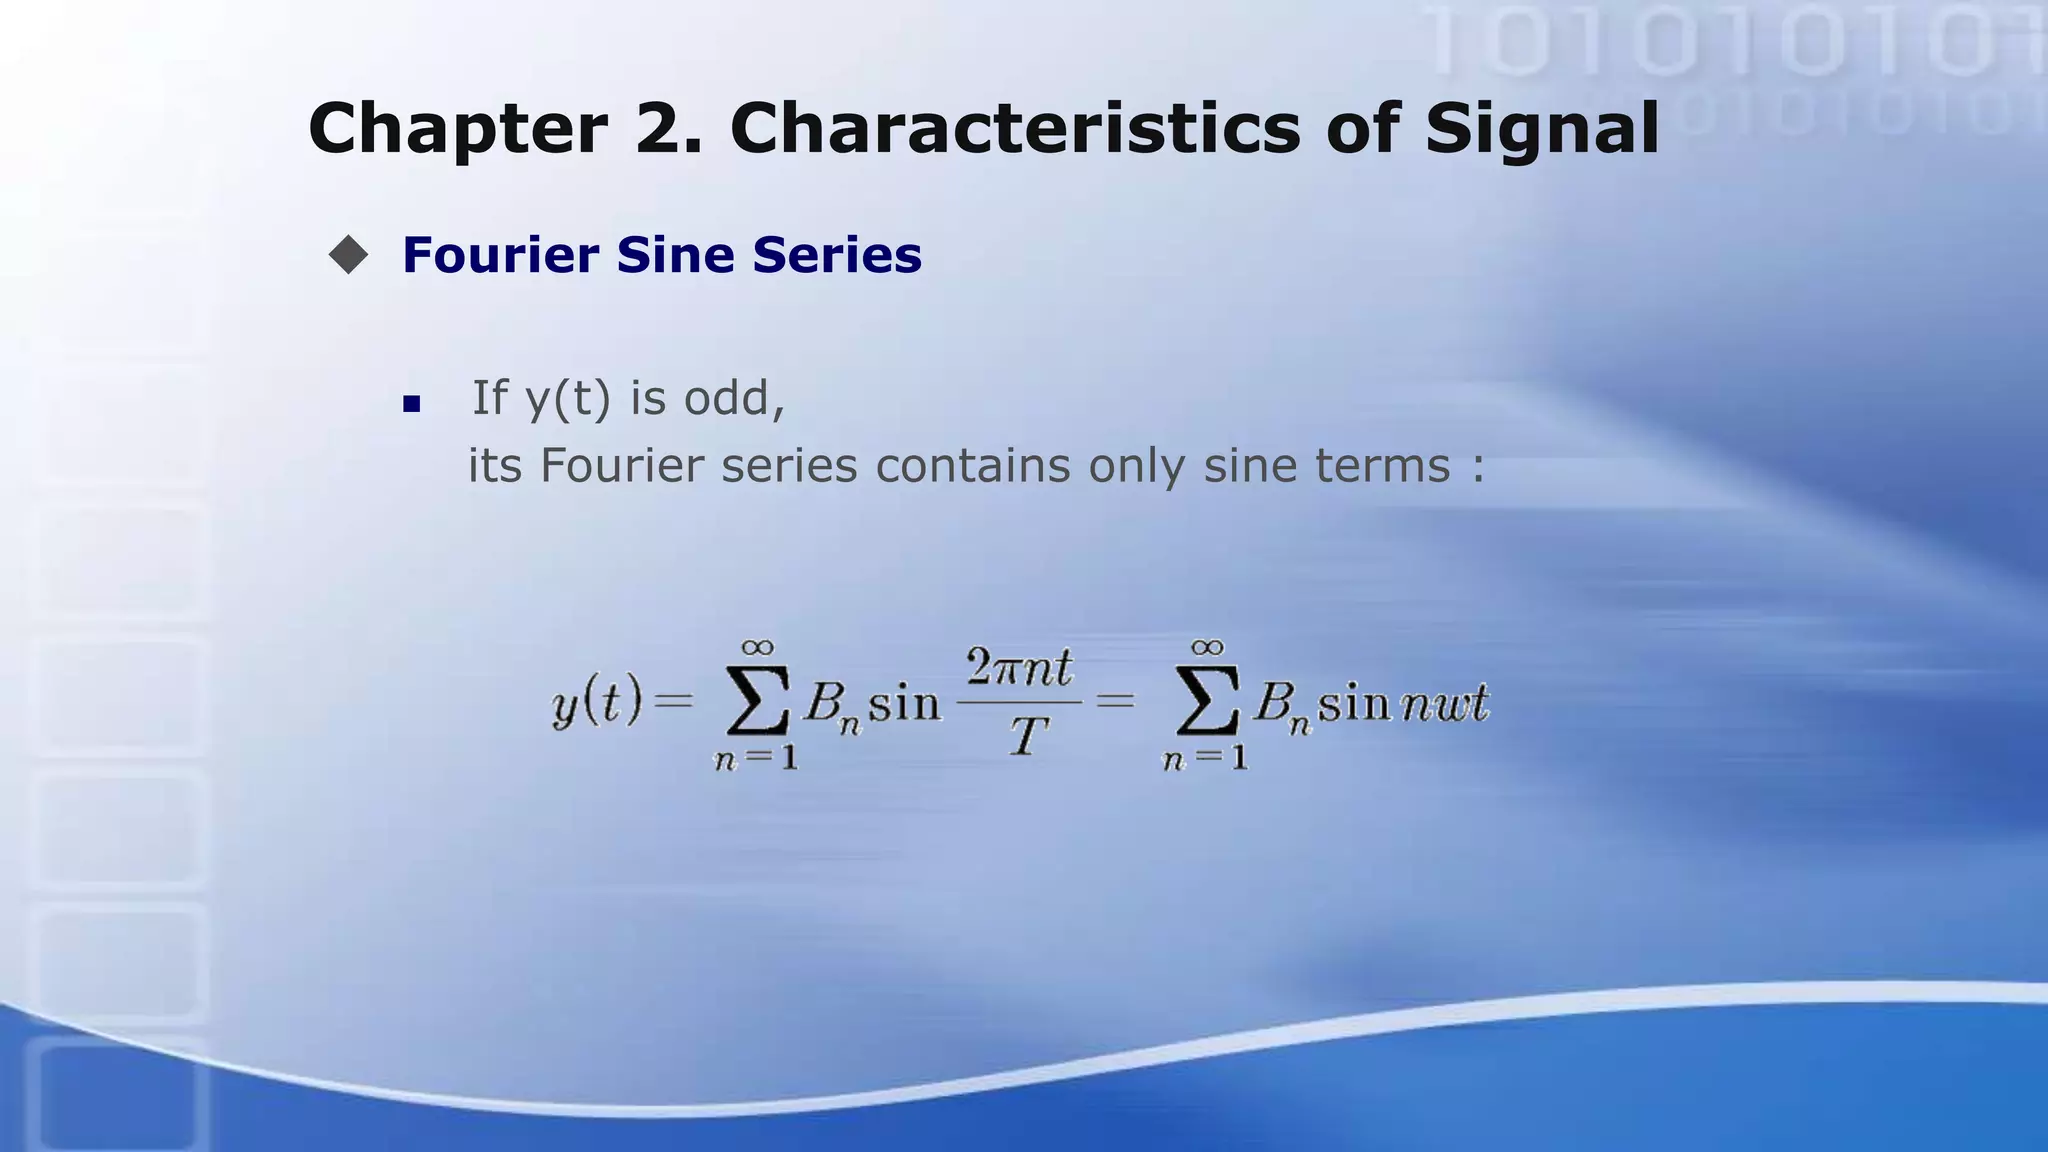
STATIC AND DYNAMIC CHARACTERISTICS
OF SIGNALS
CHAPTER # 02
THEORY AND DESIGN FOR MECHANICAL MEASUREMENTS – 5TH EDITION
FIGLIOLA – BEASELY
ASST. PROF. SALMAN ABUBAKAR BUGVI
MED - UOL
INTRODUCTION
 A measurement system takes an input
quantity and transforms it into an output
quantity that can be observed or
recorded.
 The corresponding lecture discusses
characteristics of both the input signals
to a measurement system and the
resulting output signals.
 The shape and form of a signal are often
referred to as its waveform.
UNDERSTANDING OF WAVEFORMS
SIGNAL CONCEPTS
Two important tasks engineers face in the measurement of physical variables
are (1) Selecting a measurement system (2) Interpreting the output from a
measurement system.
Input range of car tire 275 kPa
Input range of bicycle tire 700 kPa
Idea of input of range of instrument
Some basic understanding of nature of input
signal (magnitude)
Necessary for selecting a measurement
system
SIGNAL CONCEPTS
 Will the tire gauge work for measuring the
pressure change inside an automobile cylinder?
 A much more difficult task especially when time
and spatial behavior of input is not known.
 Pressure in cylinder varies with time.
 Select a measurement system to determine the
time varying pressure.
 Information of pressure changes inside cylinder
would be necessary.
 From thermodynamics and speed range of engine
magnitude of pressures expected may be
estimated along with their rate of change.
VARYING PRESSURE
DEFINITION OF SIGNAL
 Associate signal with transmission of information.
 A signal is the physical variation about the measured
variable being transmitted between process and
measurement system, between stages of
measurement system or as output.
 Many measurement systems exhibit similar
responses under variety of conditions.
 Performance and capabilities of measurement
system may be described in a generalized way.
 Generalized behavior of measurement system can
be examined by possible forms of input and output
signals.
WAVEFORM CLASSIFICATION
 Analog Signals
 Discrete Time Signals
 Digital Signals
CONVERSION OF SIGNALS
SIGNAL WAVEFORMS
 A static signal does not vary with time. Example is diameter of shaft.
 Many physical variables change very slowly with respect to time and are
considered static. Example the voltage difference across battery terminal
is considered static in time over the useful life.
 When we are interested in how measured value changes with respect to
time we study dynamic signals.
 Dynamic signal is time dependent signal.
CLASSIFICATION OF DYNAMIC
SIGNALS
 A deterministic signal varies in time in a predictable manner, such as a sine
wave, a step function or a ramp function.
 A non deterministic signal that has no discernible pattern of repetition. It
cannot be prescribed before it occurs, although certain characteristics may
be known in advance.
 Transmission of data files from one computer to another.
Rate of data transmission – possible range of signal magnitude, are
known for any signal
Not possible to predict future signal characteristics based on existing
information in such a signal.
FUNCTIONS OF DETERMINISTIC
VARIABLES
STEP FUNCTION RAMP FUNCTION SINE FUNCTION
Aperiodic Periodic
PERIODIC AND APERIODIC
WAVEFORMS
 A signal is steady periodic if the variation of the magnitude of the signal
repeats at regular intervals in time.
 Motion of an ideal pendulum, the temperature variations of an IC engine
under steady operating conditions.
 A simple periodic waveform contains only one frequency.
 A complex periodic waveform contains multiple frequencies and is
represented as superposition of multiple simple periodic waveforms.
 Aperiodic is the term used to describe deterministic signals that do not
repeat at regular intervals.
SIGNAL ANALYSIS
A measurement system produces a signal that
may be analog, discrete time or digital.
An analog signal is continuous with time and
has a magnitude analogous to the physical
variable being measured.
Mean or average value of signal is found by
DC OFFSET
SIGNAL ANALYSIS
 The mean value does not provide any indication of the amount of variation
in the dynamic portion of the signal.
 The characterization of the dynamic portion or AC component of the signal
can be done by signal root mean square value.
SUBTRACTING DC OFFSET
• When AC component is of primary interest the DC component can be removed.
• Procedure allows change of scale or plotting of signal such that fluctuations which were small
percentage of DC signal can be more clearly observed without superposition of large DC
component.
SOLVED EXAMPLE - 2.1
Spend 5 minutes in reading and following the solved
example 2.1
Theory and Design for Mechanical Measurements 5th
Edition
Figliola - Beasely
SIGNAL AMPLITUDE AND FREQUENCY
 A key factor in measurement system behavior is
the nature of input signal to the system.
 A means is needed to classify waveforms for both
input and resulting output signal relative to their
magnitude and frequency.
 A very complex signal even one that is non
deterministic in nature can be approximated as an
infinite series of sine and cosine functions
 This method is called Fourier Analysis.
FOURIER ANALYSIS
 Combining a number of different pure tones can
generate rich musical sound.
 Another example is separation of white light through a
prism.
 Complex waveform represented by white light is broken
into simpler components represented by colors of
spectrum.
 Fourier Analysis is roughly the equivalent of a prism.
 It yields a representation of complex signal in terms of
simple periodic functions.
 This allows measurement system response to be
reasonably well defined by examining output resulting
from few specific input waveforms.
FOURIER ANALYSIS
STUDY THE 3 PAGES OF HANDOUT PROVIDED
CHAPTER #19 – VIBRATIONS
PERIODIC SIGNALS
VECTOR MECHANICS FOR ENGINEERS (DYNAMICS)
5TH EDITION BEER - JOHNSTON
Chapter 2. Characteristics of Signal
 Signal Amplitude and Frequency
② A trigonometric series is given by
A0 + A1 cos t + B1 sin t + A2 cos 2t + B2 sin 2t
+…+ An cos nt + Bn sin nt
Where An and Bn are the coefficients of the series
Chapter 2. Characteristics of Signal
 Fourier Coefficients
 A periodic y(t) with T = 2π
y(t) = A0 + (An cos nt + Bn sin nt)
with y(t) known, the coeffs. An and Bn are to be
determined
Chapter 2. Characteristics of Signal
 Fourier Coefficients
(n=m non zero)
Chapter 2. Characteristics of Signal
 Fourier Coefficients
 Similarly,
Euler formula
Chapter 2. Characteristics of Signal
 Fourier Coeffs. for fns. having Arbitrary Periods
 Euler formulas : The coeffs. of a trigonometric series
representing a fn. of freq. of W
Chapter 2. Characteristics of Signal
 Fourier Coefficients
 When n=1,
the corresponding terms in the Fourier series are
called fundamental
The fundamental freq. is w = 2n/T
Freq. Corresponding to n=2, 3, 4 are known as
harmonics
Chapter 2. Characteristics of Signal
 Fourier Coefficients
 Where
Chapter 2. Characteristics of Signal
 Even and Odd Functions
 A fn. g(t) is even if
g(-t) = g(t) cos nt : even
 A fn. h(t) is odd if
h(-t) = - h(t) sin nt : odd
Chapter 2. Characteristics of Signal
 Fourier Cosine Series
 If y(t) is even,
its Fourier series contains only cosine terms :
Chapter 2. Characteristics of Signal
 Fourier Sine Series
 If y(t) is odd,
its Fourier series contains only sine terms :
STUDY AND FOLLOW THE SOLVED
EXAMPLES
2.3 – 2.4 – 2.5
THEORY AND DESIGN FOR MECHANICAL
MEASUREMENTS
5th EDITION FIGLIOLA - BEASELY
ASSIGNMENT # 02
EXERCISE PROBLEMS CHAPTER #2
THEORY AND DESIGN FOR MECHANICAL
MEASUREMENTS 5TH EDITION
FIGLIOLA – BEASELY
PROBLEMS # 2.1-2.2-2.3-2.4-2.7-2.9-2.10-2.11-
2.12-2.13-2.14-2.15-2.16-2.21

Static and dynamic characteristics of signals

  • 1.
    STATIC AND DYNAMICCHARACTERISTICS OF SIGNALS CHAPTER # 02 THEORY AND DESIGN FOR MECHANICAL MEASUREMENTS – 5TH EDITION FIGLIOLA – BEASELY ASST. PROF. SALMAN ABUBAKAR BUGVI MED - UOL
  • 2.
    INTRODUCTION  A measurementsystem takes an input quantity and transforms it into an output quantity that can be observed or recorded.  The corresponding lecture discusses characteristics of both the input signals to a measurement system and the resulting output signals.  The shape and form of a signal are often referred to as its waveform.
  • 3.
  • 4.
  • 5.
    SIGNAL CONCEPTS Two importanttasks engineers face in the measurement of physical variables are (1) Selecting a measurement system (2) Interpreting the output from a measurement system. Input range of car tire 275 kPa Input range of bicycle tire 700 kPa Idea of input of range of instrument Some basic understanding of nature of input signal (magnitude) Necessary for selecting a measurement system
  • 6.
    SIGNAL CONCEPTS  Willthe tire gauge work for measuring the pressure change inside an automobile cylinder?  A much more difficult task especially when time and spatial behavior of input is not known.  Pressure in cylinder varies with time.  Select a measurement system to determine the time varying pressure.  Information of pressure changes inside cylinder would be necessary.  From thermodynamics and speed range of engine magnitude of pressures expected may be estimated along with their rate of change.
  • 7.
  • 8.
    DEFINITION OF SIGNAL Associate signal with transmission of information.  A signal is the physical variation about the measured variable being transmitted between process and measurement system, between stages of measurement system or as output.  Many measurement systems exhibit similar responses under variety of conditions.  Performance and capabilities of measurement system may be described in a generalized way.  Generalized behavior of measurement system can be examined by possible forms of input and output signals.
  • 9.
    WAVEFORM CLASSIFICATION  AnalogSignals  Discrete Time Signals  Digital Signals
  • 11.
  • 12.
    SIGNAL WAVEFORMS  Astatic signal does not vary with time. Example is diameter of shaft.  Many physical variables change very slowly with respect to time and are considered static. Example the voltage difference across battery terminal is considered static in time over the useful life.  When we are interested in how measured value changes with respect to time we study dynamic signals.  Dynamic signal is time dependent signal.
  • 13.
    CLASSIFICATION OF DYNAMIC SIGNALS A deterministic signal varies in time in a predictable manner, such as a sine wave, a step function or a ramp function.  A non deterministic signal that has no discernible pattern of repetition. It cannot be prescribed before it occurs, although certain characteristics may be known in advance.  Transmission of data files from one computer to another. Rate of data transmission – possible range of signal magnitude, are known for any signal Not possible to predict future signal characteristics based on existing information in such a signal.
  • 14.
    FUNCTIONS OF DETERMINISTIC VARIABLES STEPFUNCTION RAMP FUNCTION SINE FUNCTION Aperiodic Periodic
  • 15.
    PERIODIC AND APERIODIC WAVEFORMS A signal is steady periodic if the variation of the magnitude of the signal repeats at regular intervals in time.  Motion of an ideal pendulum, the temperature variations of an IC engine under steady operating conditions.  A simple periodic waveform contains only one frequency.  A complex periodic waveform contains multiple frequencies and is represented as superposition of multiple simple periodic waveforms.  Aperiodic is the term used to describe deterministic signals that do not repeat at regular intervals.
  • 17.
    SIGNAL ANALYSIS A measurementsystem produces a signal that may be analog, discrete time or digital. An analog signal is continuous with time and has a magnitude analogous to the physical variable being measured. Mean or average value of signal is found by DC OFFSET
  • 18.
    SIGNAL ANALYSIS  Themean value does not provide any indication of the amount of variation in the dynamic portion of the signal.  The characterization of the dynamic portion or AC component of the signal can be done by signal root mean square value.
  • 20.
    SUBTRACTING DC OFFSET •When AC component is of primary interest the DC component can be removed. • Procedure allows change of scale or plotting of signal such that fluctuations which were small percentage of DC signal can be more clearly observed without superposition of large DC component.
  • 21.
    SOLVED EXAMPLE -2.1 Spend 5 minutes in reading and following the solved example 2.1 Theory and Design for Mechanical Measurements 5th Edition Figliola - Beasely
  • 22.
    SIGNAL AMPLITUDE ANDFREQUENCY  A key factor in measurement system behavior is the nature of input signal to the system.  A means is needed to classify waveforms for both input and resulting output signal relative to their magnitude and frequency.  A very complex signal even one that is non deterministic in nature can be approximated as an infinite series of sine and cosine functions  This method is called Fourier Analysis.
  • 23.
    FOURIER ANALYSIS  Combininga number of different pure tones can generate rich musical sound.  Another example is separation of white light through a prism.  Complex waveform represented by white light is broken into simpler components represented by colors of spectrum.  Fourier Analysis is roughly the equivalent of a prism.  It yields a representation of complex signal in terms of simple periodic functions.  This allows measurement system response to be reasonably well defined by examining output resulting from few specific input waveforms.
  • 24.
  • 25.
    STUDY THE 3PAGES OF HANDOUT PROVIDED CHAPTER #19 – VIBRATIONS PERIODIC SIGNALS VECTOR MECHANICS FOR ENGINEERS (DYNAMICS) 5TH EDITION BEER - JOHNSTON
  • 26.
    Chapter 2. Characteristicsof Signal  Signal Amplitude and Frequency ② A trigonometric series is given by A0 + A1 cos t + B1 sin t + A2 cos 2t + B2 sin 2t +…+ An cos nt + Bn sin nt Where An and Bn are the coefficients of the series
  • 27.
    Chapter 2. Characteristicsof Signal  Fourier Coefficients  A periodic y(t) with T = 2π y(t) = A0 + (An cos nt + Bn sin nt) with y(t) known, the coeffs. An and Bn are to be determined
  • 28.
    Chapter 2. Characteristicsof Signal  Fourier Coefficients (n=m non zero)
  • 29.
    Chapter 2. Characteristicsof Signal  Fourier Coefficients  Similarly, Euler formula
  • 30.
    Chapter 2. Characteristicsof Signal  Fourier Coeffs. for fns. having Arbitrary Periods  Euler formulas : The coeffs. of a trigonometric series representing a fn. of freq. of W
  • 31.
    Chapter 2. Characteristicsof Signal  Fourier Coefficients  When n=1, the corresponding terms in the Fourier series are called fundamental The fundamental freq. is w = 2n/T Freq. Corresponding to n=2, 3, 4 are known as harmonics
  • 32.
    Chapter 2. Characteristicsof Signal  Fourier Coefficients  Where
  • 33.
    Chapter 2. Characteristicsof Signal  Even and Odd Functions  A fn. g(t) is even if g(-t) = g(t) cos nt : even  A fn. h(t) is odd if h(-t) = - h(t) sin nt : odd
  • 34.
    Chapter 2. Characteristicsof Signal  Fourier Cosine Series  If y(t) is even, its Fourier series contains only cosine terms :
  • 35.
    Chapter 2. Characteristicsof Signal  Fourier Sine Series  If y(t) is odd, its Fourier series contains only sine terms :
  • 36.
    STUDY AND FOLLOWTHE SOLVED EXAMPLES 2.3 – 2.4 – 2.5 THEORY AND DESIGN FOR MECHANICAL MEASUREMENTS 5th EDITION FIGLIOLA - BEASELY
  • 37.
    ASSIGNMENT # 02 EXERCISEPROBLEMS CHAPTER #2 THEORY AND DESIGN FOR MECHANICAL MEASUREMENTS 5TH EDITION FIGLIOLA – BEASELY PROBLEMS # 2.1-2.2-2.3-2.4-2.7-2.9-2.10-2.11- 2.12-2.13-2.14-2.15-2.16-2.21