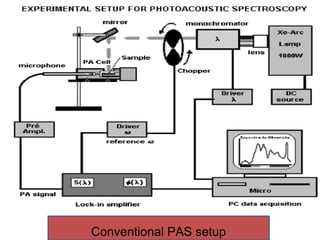
Photoacoustic
sPectroscoPy
By

rajesh M KaMble
T. P. No. 27
History
 Photoacoustic effect discovered by Alexander Grahm
Bell in 1880
 Bell found that when light was focused on to thin
diaphragm, sound was emitted
 Bell also studied the sounds produced by the irradiation
of various solid samples in a brass cavity sealed with a
glass window
The original experiment carried out by Alexander Bell
Introduction
 PAS or Optoacoustic spectroscopy was developed
in 1973 which provides UV, Visible and IR absorption
spectra of solids, semisolids and turbid liquids
 Obtaining of spectra for above kind of samples by
ordinary methods is usually difficult because of light
scattering and reflection
 It is non-destructive technique
 Minimal or no sample preparation
 Applied for opaque and scattering samples
 Used for qualitative and quantitative experiments
 Used to detect defects on the surface of thin films
The Photoacoustic effect
 PAS is based upon a light absorption effect
 In PAS the gas to be measured is irradiated by a
chopped beam of light of a pre-selected wavelength
 The gas molecules absorb some of the light energy and
convert it in to an acoustic signal which is detected by a
microphone
 If the frequency of the light coincides with an absorption
band of the gas in the cell, then the gas molecules will
absorb part of the light
 The higher the concentration of gas in the cell, the more
light will be absorbed
 As the gas absorbs energy, it is heated and therefore
expands and causes a pressure rise
 As the light is chopped, the pressure will alternately
increase or decrease and an acoustic signal is thus
generated
 Only the absorbed light is converted to sound
 The acoustic signal is detected by microphone
 The electrical output signals from the microphone are
added in an amplifier before they are processed
Photoacoustic effect in solids
 In PAS studies of solids, the PAS effect is observed by
from periodic heat flow from the solid to the surrounding
gas
 The periodic heat flow produces pressure fluctuation in
the gas of the cell and are detected by the microphone
 The power of resulting sound is directly related to the
extent of absorption of light by solid
 The analog signal from microphone recorded as a
function of wavelength of incident light
 The radiation reflected or scattered by the sample has
no effect on microphone and thus does not interfere
Possible PA generating mechanisms
Conventional PAS setup
Instruments
 A single beam PAS the spectrum from the lamp is first
recorded digitally followed by the spectrum for the
sample
 The stored lamp data then used to correct the output
from the sample for variations in the lamp output as a
function of wavelength
 Double-beam instrument is equipped with a pair of
matched cells (and transducers), one contains a sample
and the other reference material such as finely divided
carbon
Applications
 Bulk studies :
- PAS provide optical data for solids which are not
highly reflective, highly opaque or highly scattering (e.g.
Insulator, semiconductor & metallic systems)
-Many solid & semi solid biological systems can be
studied by PAS
 Surface studies
 De-excitation studies
UV/visible PA spectroscopy
 PAS permits spectroscopic
studies of blood without
separation of blood cells,
protein & lipid molecules
 The whole blood does not
yield satisfactory spectra by
conventional spectroscopy
because of highly scattering
properties of large molecules
PAS spectra of
smears of blood and
blood components
Non-biological studies
 Spectrum: (a) PAS of Cr2O3
powder in the region 200-900
nm
(b) Optical absorption
spectrum on a 4µ thick Cr2O3
crystal
(c) Diffuse reflectance
spectrum on Cr2O3 powder
 The two crystal field bands of
Cr3+ ion at 600 & 460 nm are
clearly resolved in PA
spectrum as they are in
absorption spectrum of Cr2O3
crystal
PAS spectra of

Cr2O3
Surface studies
 Adsorbed & chemisorbed molecular
species on the surfaces of metals,
semiconductors and insulators can
be studied by PAS
 PAS offers a simple & highly
sensitive means for performing nondestructive compound identification
directly on the TLC plates
 Conventional spectroscopic
techniques are unsuitable because of
the opacity & light scattering
properties of silica gel adsorbent on
the TLC plates

The compounds are:
(A) p-nitroaniline
(B) benzylidene
acetone
(C) salicylaldehyde
(D) 1-tetralone and
De-excitation (Fluorescent)studies
 PA effect measures non-radiative
de-excitation processes in a
system after it has been optically
excited
 This selective PAS technique
applied to study of florescent (or
phosphorescent) &
photosensitive materials
 Fluorescent Ho2O3: Ho3+ have
strong fluorescent energy levels
& these tend to de-excite through
the emission of photon rather
than phonon or heat excitation

PAS spectra of Ho2O3
References
1. Principles of Instrumental Analysis, 5th Edn., Skoog and
West
2. Photoacoustics and Photoacoustic Spectroscopy, Allan
Rosencwaig (Chemical Analysis , Vol.57)
3. Rosencwaig A. Photoacoustic Spectroscopy: A New
Tool for Investigation of Solids, Anal. Chem. 1975,
47(6), 592 A-604 A.
THANK YOU

Spectroscopy

  • 1.
  • 2.
    History  Photoacoustic effectdiscovered by Alexander Grahm Bell in 1880  Bell found that when light was focused on to thin diaphragm, sound was emitted  Bell also studied the sounds produced by the irradiation of various solid samples in a brass cavity sealed with a glass window
  • 3.
    The original experimentcarried out by Alexander Bell
  • 4.
    Introduction  PAS orOptoacoustic spectroscopy was developed in 1973 which provides UV, Visible and IR absorption spectra of solids, semisolids and turbid liquids  Obtaining of spectra for above kind of samples by ordinary methods is usually difficult because of light scattering and reflection  It is non-destructive technique  Minimal or no sample preparation
  • 5.
     Applied foropaque and scattering samples  Used for qualitative and quantitative experiments  Used to detect defects on the surface of thin films
  • 6.
    The Photoacoustic effect PAS is based upon a light absorption effect  In PAS the gas to be measured is irradiated by a chopped beam of light of a pre-selected wavelength  The gas molecules absorb some of the light energy and convert it in to an acoustic signal which is detected by a microphone  If the frequency of the light coincides with an absorption band of the gas in the cell, then the gas molecules will absorb part of the light
  • 7.
     The higherthe concentration of gas in the cell, the more light will be absorbed  As the gas absorbs energy, it is heated and therefore expands and causes a pressure rise  As the light is chopped, the pressure will alternately increase or decrease and an acoustic signal is thus generated  Only the absorbed light is converted to sound  The acoustic signal is detected by microphone  The electrical output signals from the microphone are added in an amplifier before they are processed
  • 8.
    Photoacoustic effect insolids  In PAS studies of solids, the PAS effect is observed by from periodic heat flow from the solid to the surrounding gas  The periodic heat flow produces pressure fluctuation in the gas of the cell and are detected by the microphone  The power of resulting sound is directly related to the extent of absorption of light by solid  The analog signal from microphone recorded as a function of wavelength of incident light  The radiation reflected or scattered by the sample has no effect on microphone and thus does not interfere
  • 9.
  • 10.
  • 11.
    Instruments  A singlebeam PAS the spectrum from the lamp is first recorded digitally followed by the spectrum for the sample  The stored lamp data then used to correct the output from the sample for variations in the lamp output as a function of wavelength  Double-beam instrument is equipped with a pair of matched cells (and transducers), one contains a sample and the other reference material such as finely divided carbon
  • 12.
    Applications  Bulk studies: - PAS provide optical data for solids which are not highly reflective, highly opaque or highly scattering (e.g. Insulator, semiconductor & metallic systems) -Many solid & semi solid biological systems can be studied by PAS  Surface studies  De-excitation studies
  • 13.
    UV/visible PA spectroscopy PAS permits spectroscopic studies of blood without separation of blood cells, protein & lipid molecules  The whole blood does not yield satisfactory spectra by conventional spectroscopy because of highly scattering properties of large molecules PAS spectra of smears of blood and blood components
  • 14.
    Non-biological studies  Spectrum:(a) PAS of Cr2O3 powder in the region 200-900 nm (b) Optical absorption spectrum on a 4µ thick Cr2O3 crystal (c) Diffuse reflectance spectrum on Cr2O3 powder  The two crystal field bands of Cr3+ ion at 600 & 460 nm are clearly resolved in PA spectrum as they are in absorption spectrum of Cr2O3 crystal PAS spectra of Cr2O3
  • 15.
    Surface studies  Adsorbed& chemisorbed molecular species on the surfaces of metals, semiconductors and insulators can be studied by PAS  PAS offers a simple & highly sensitive means for performing nondestructive compound identification directly on the TLC plates  Conventional spectroscopic techniques are unsuitable because of the opacity & light scattering properties of silica gel adsorbent on the TLC plates The compounds are: (A) p-nitroaniline (B) benzylidene acetone (C) salicylaldehyde (D) 1-tetralone and
  • 16.
    De-excitation (Fluorescent)studies  PAeffect measures non-radiative de-excitation processes in a system after it has been optically excited  This selective PAS technique applied to study of florescent (or phosphorescent) & photosensitive materials  Fluorescent Ho2O3: Ho3+ have strong fluorescent energy levels & these tend to de-excite through the emission of photon rather than phonon or heat excitation PAS spectra of Ho2O3
  • 17.
    References 1. Principles ofInstrumental Analysis, 5th Edn., Skoog and West 2. Photoacoustics and Photoacoustic Spectroscopy, Allan Rosencwaig (Chemical Analysis , Vol.57) 3. Rosencwaig A. Photoacoustic Spectroscopy: A New Tool for Investigation of Solids, Anal. Chem. 1975, 47(6), 592 A-604 A.
  • 18.