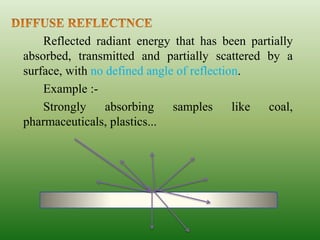
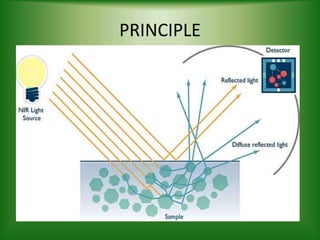
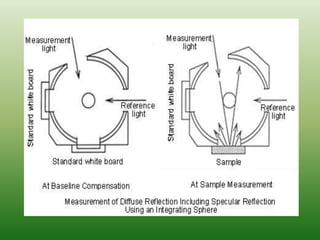
UV-VIS reflectance spectroscopy is a technique that measures the diffuse reflectance of a sample across UV and visible wavelengths. It works by directing light at a sample inside an integrating sphere, which captures reflected light and directs it to a detector. The ratio of reflected to incident light at each wavelength is the reflectance spectrum. Reflectance is affected by factors like particle size, homogeneity, and packing density. It finds applications in pharmaceutical analysis and other industries to qualitatively and quantitatively analyze samples like drugs, proteins, and chemicals.


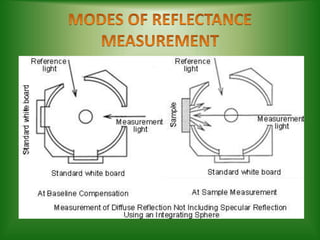
![• This is the ratio of the diffusely reflected part of the
(whole) reflected flux to the incident flux. The
measurement of diffuse reflectance is made in
comparison to a reflection standard (reflectance N)
with a collimated or conical radiation beam. The
signals of the detector are calculated as follows:
• ρd = I (X) - I (stray) - ρ [ I (mi) - I (stray) ]
I (N) - I (stray) - ρN [ I (mi) - I (stray) ]
WHERE,
I (X): signal with sample irradiation
I (N): signal with standard irradiation
I (stray): signal with open measurement port
I (mi): signal with irradiance of a mirror](https://image.slidesharecdn.com/sasi3-160926035834/85/UV-VISIBLE-REFLECTANCESPECTROSCOPY-AND-APPLICATION-11-320.jpg)


![PERI-PROSTHETIC FRACTURE NAIL-PLATE CONSTRUCT [NPC].pptx](https://cdn.slidesharecdn.com/ss_thumbnails/drarunkumardrmohamedashrafperiprostheticfrasturenail-plateconstructnpc-260209164459-7e9d15a1-thumbnail.jpg?width=640&height=640&fit=bounds)


