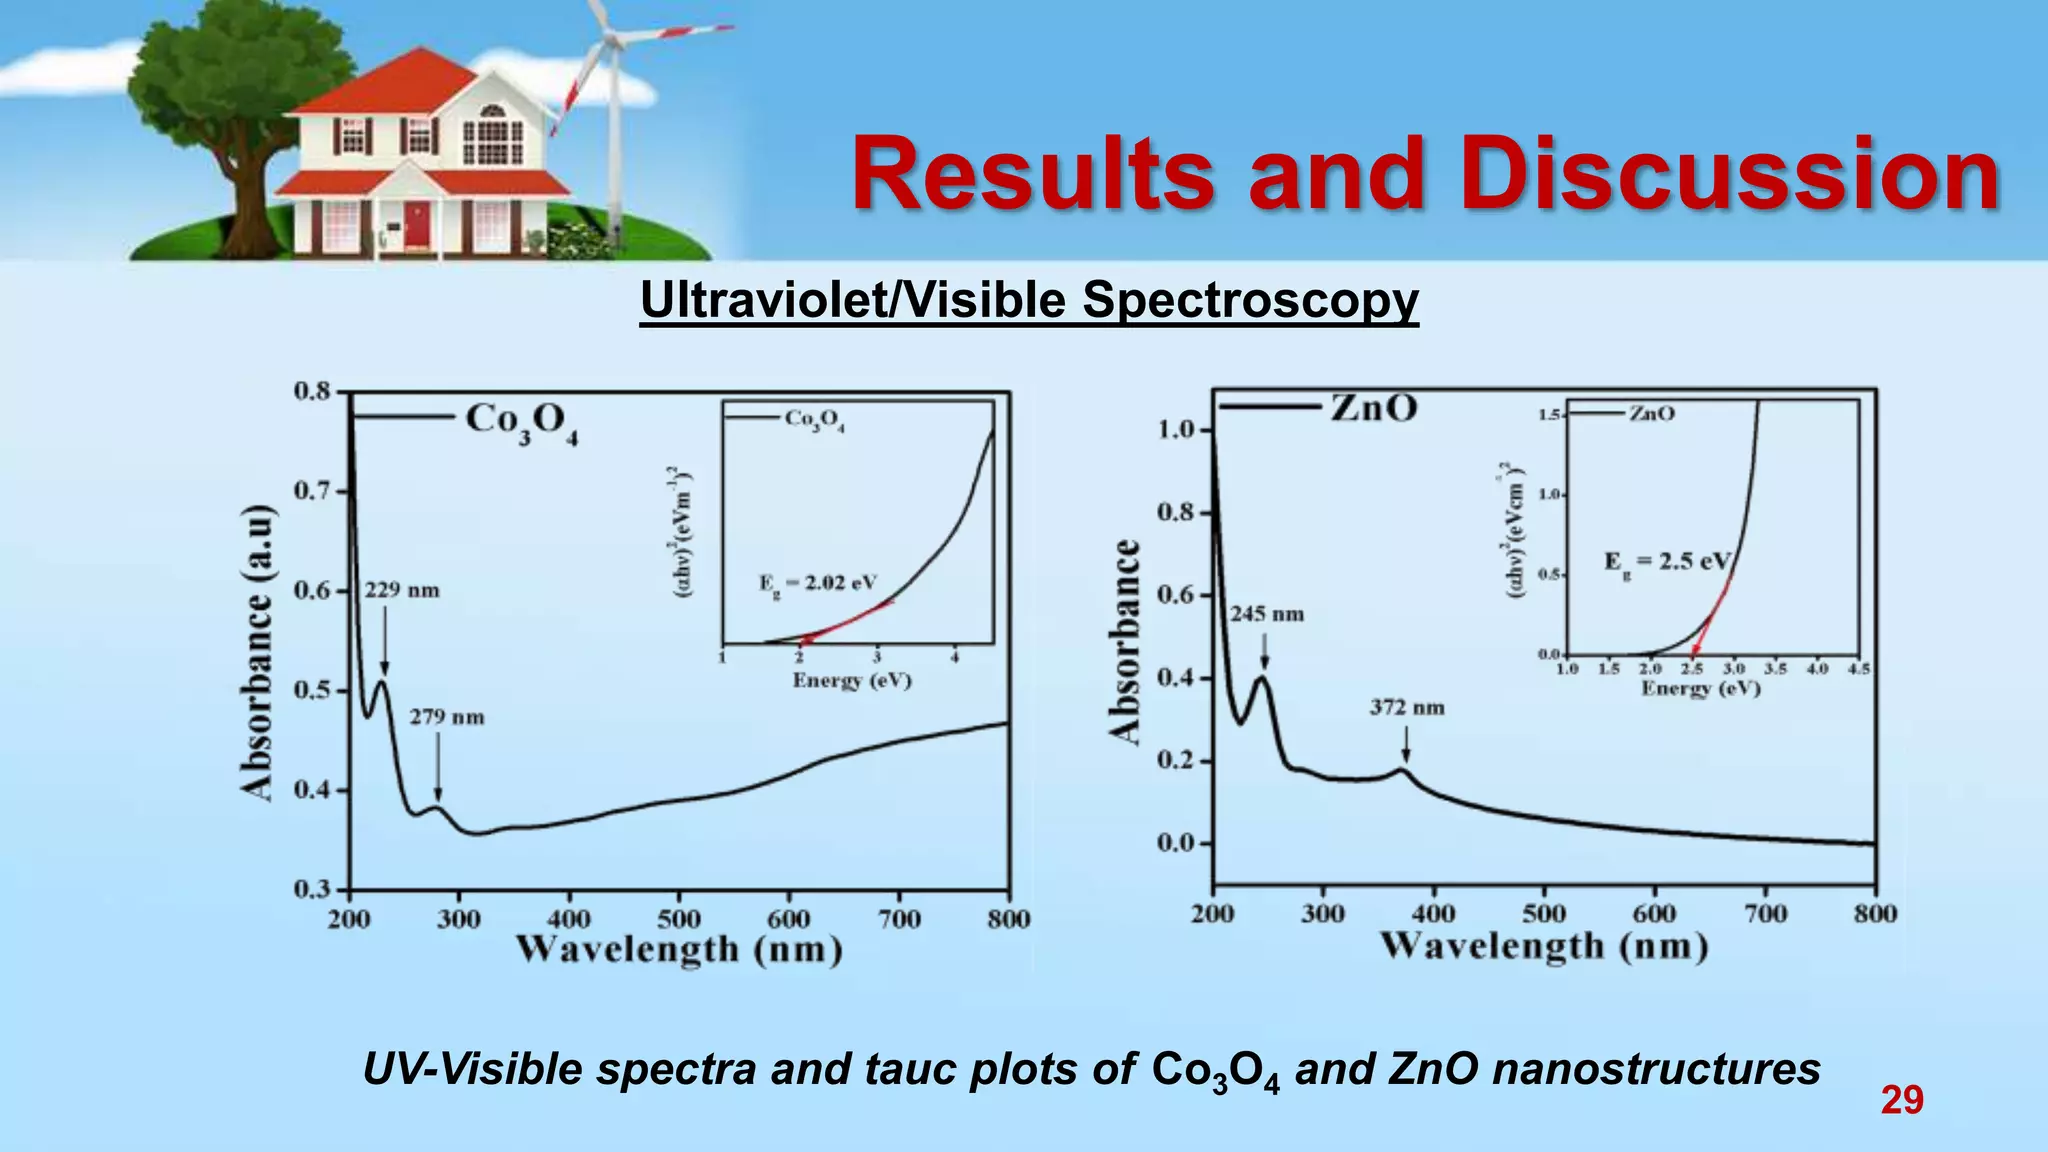
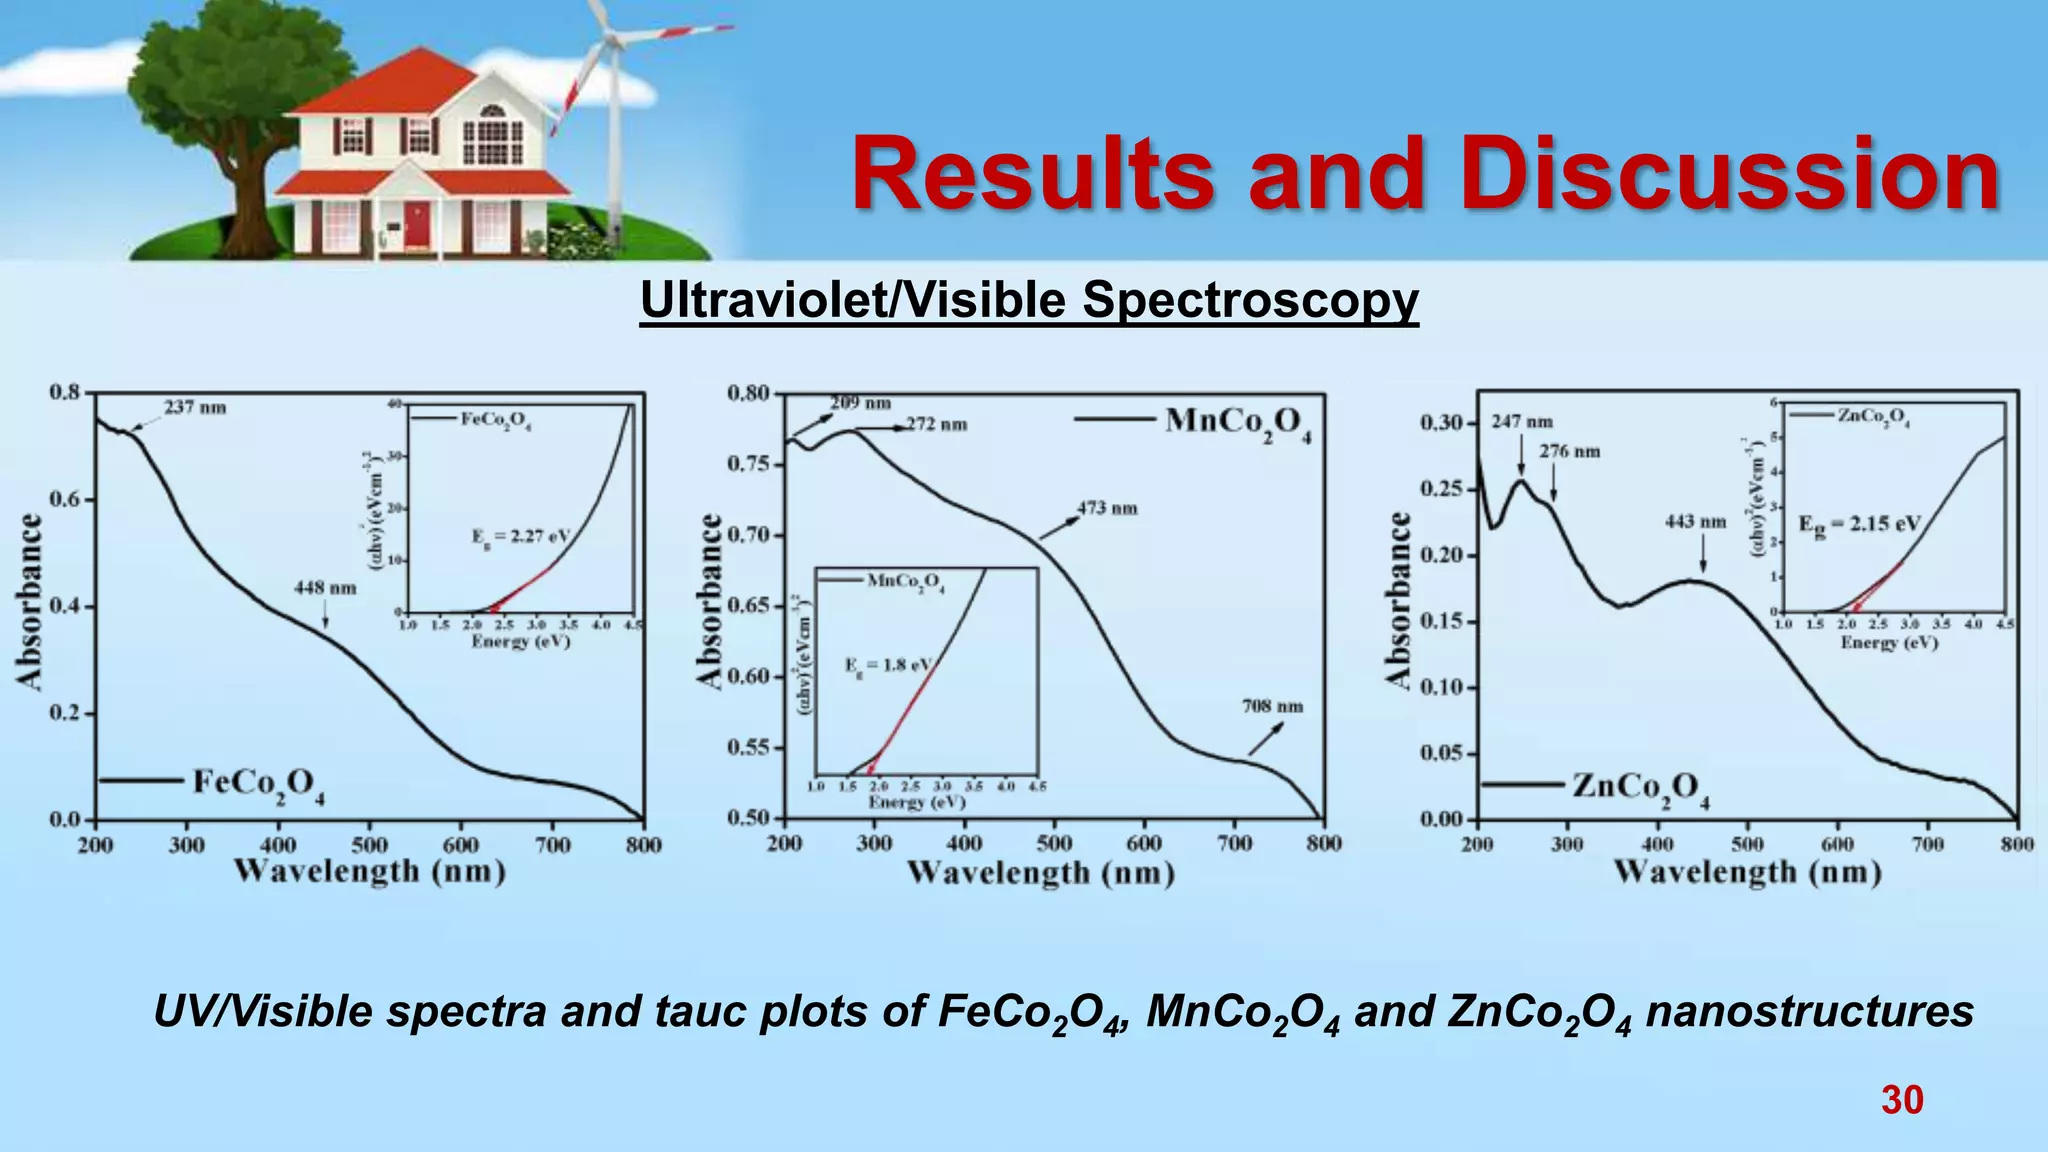
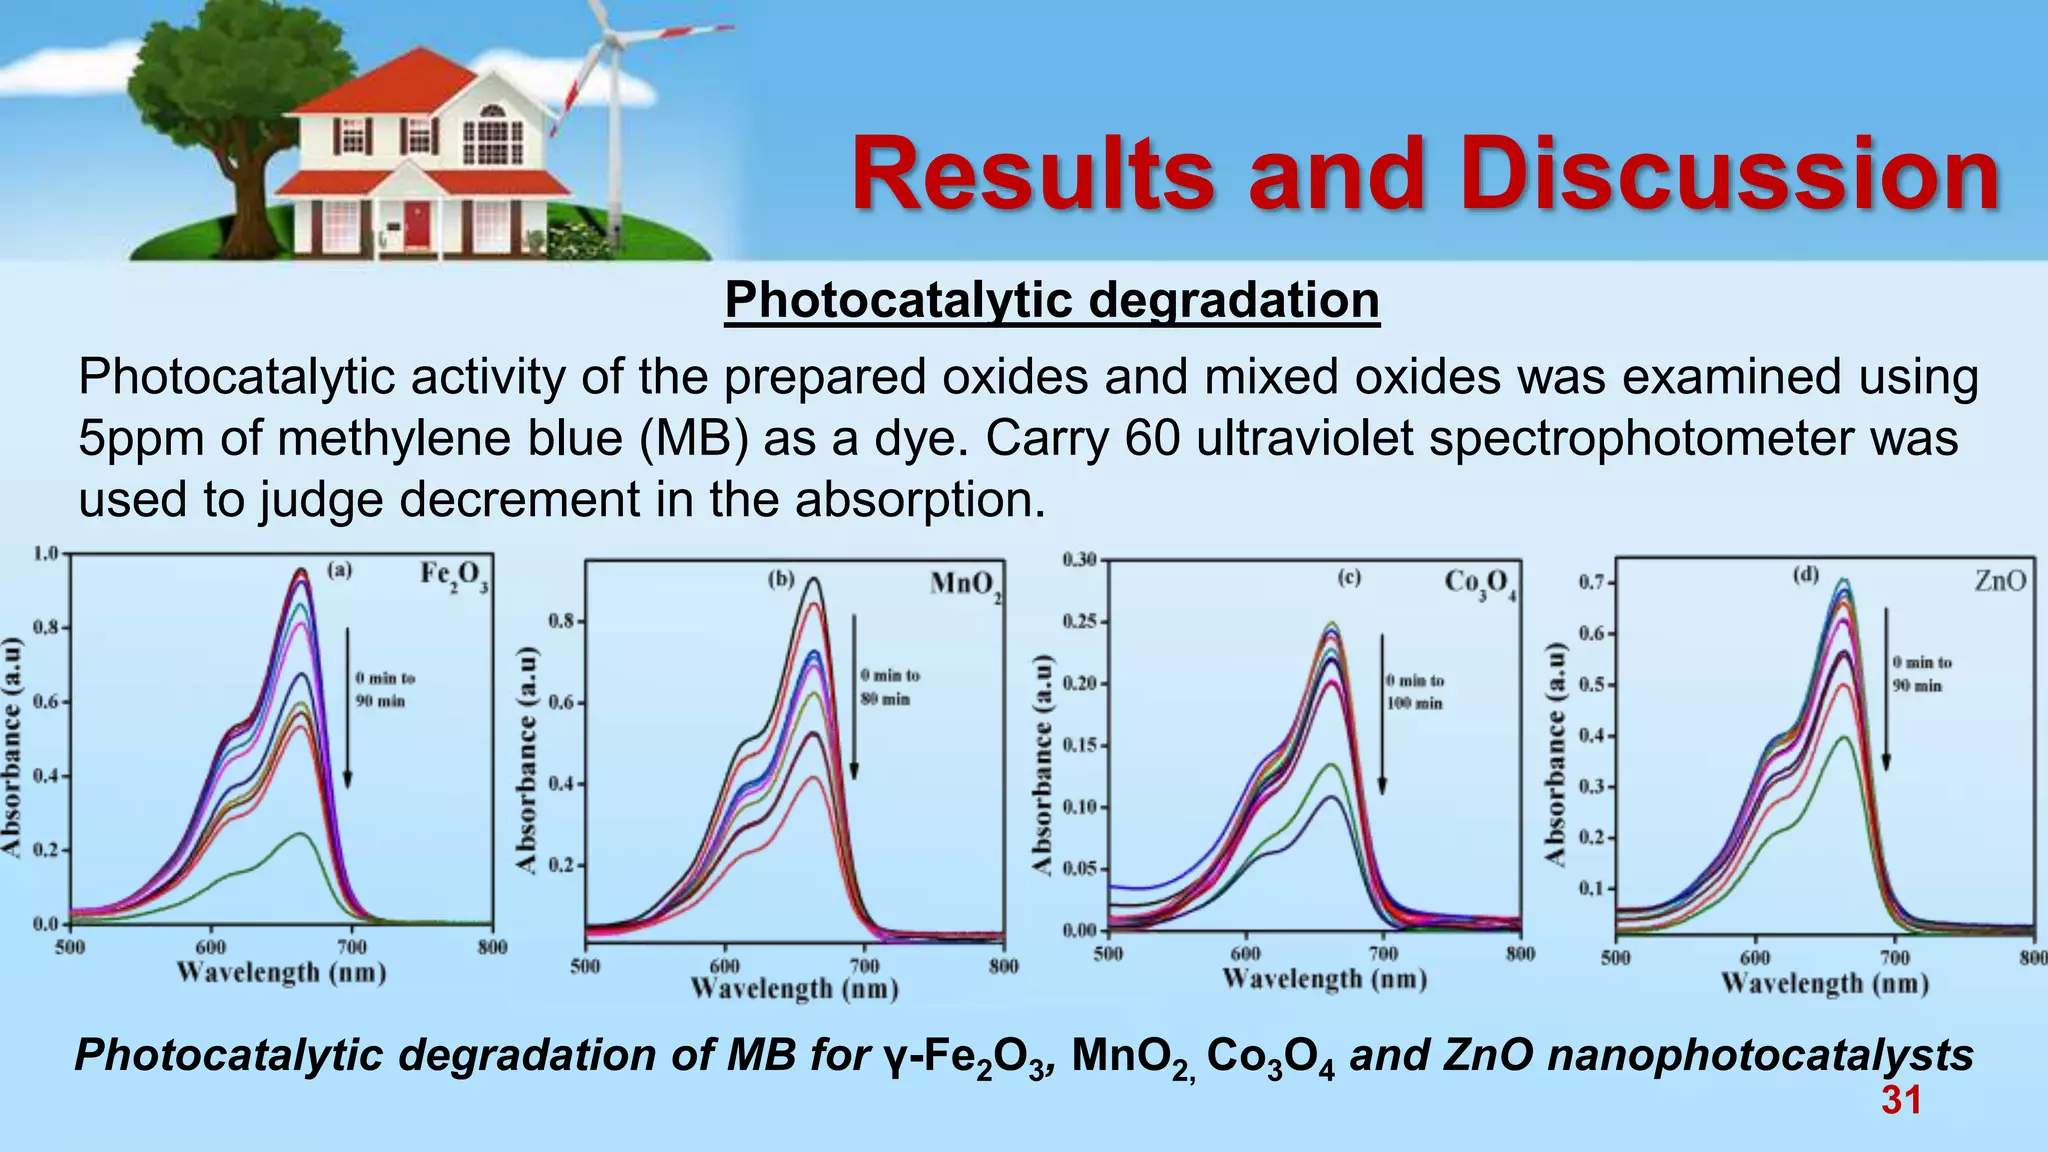
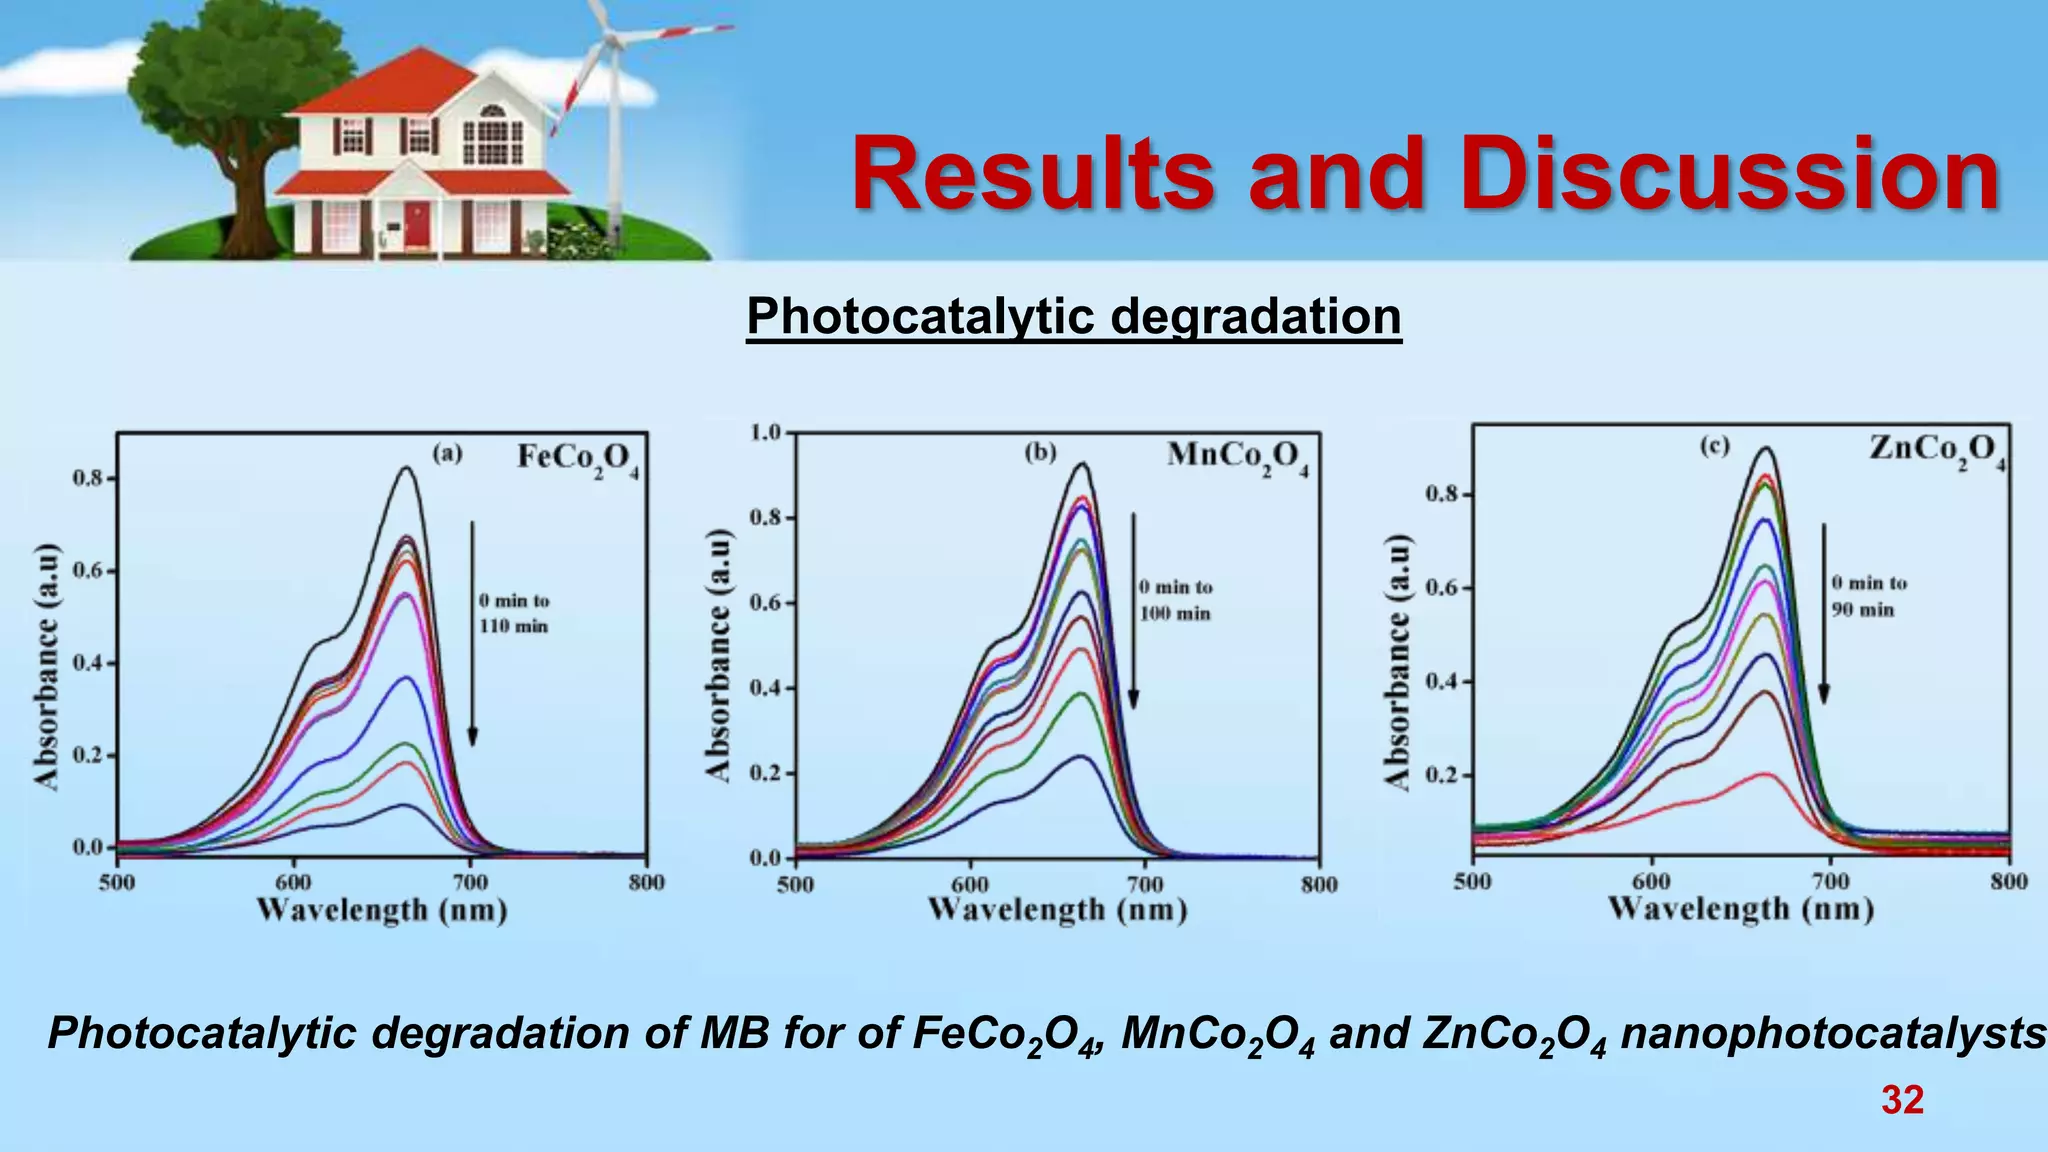
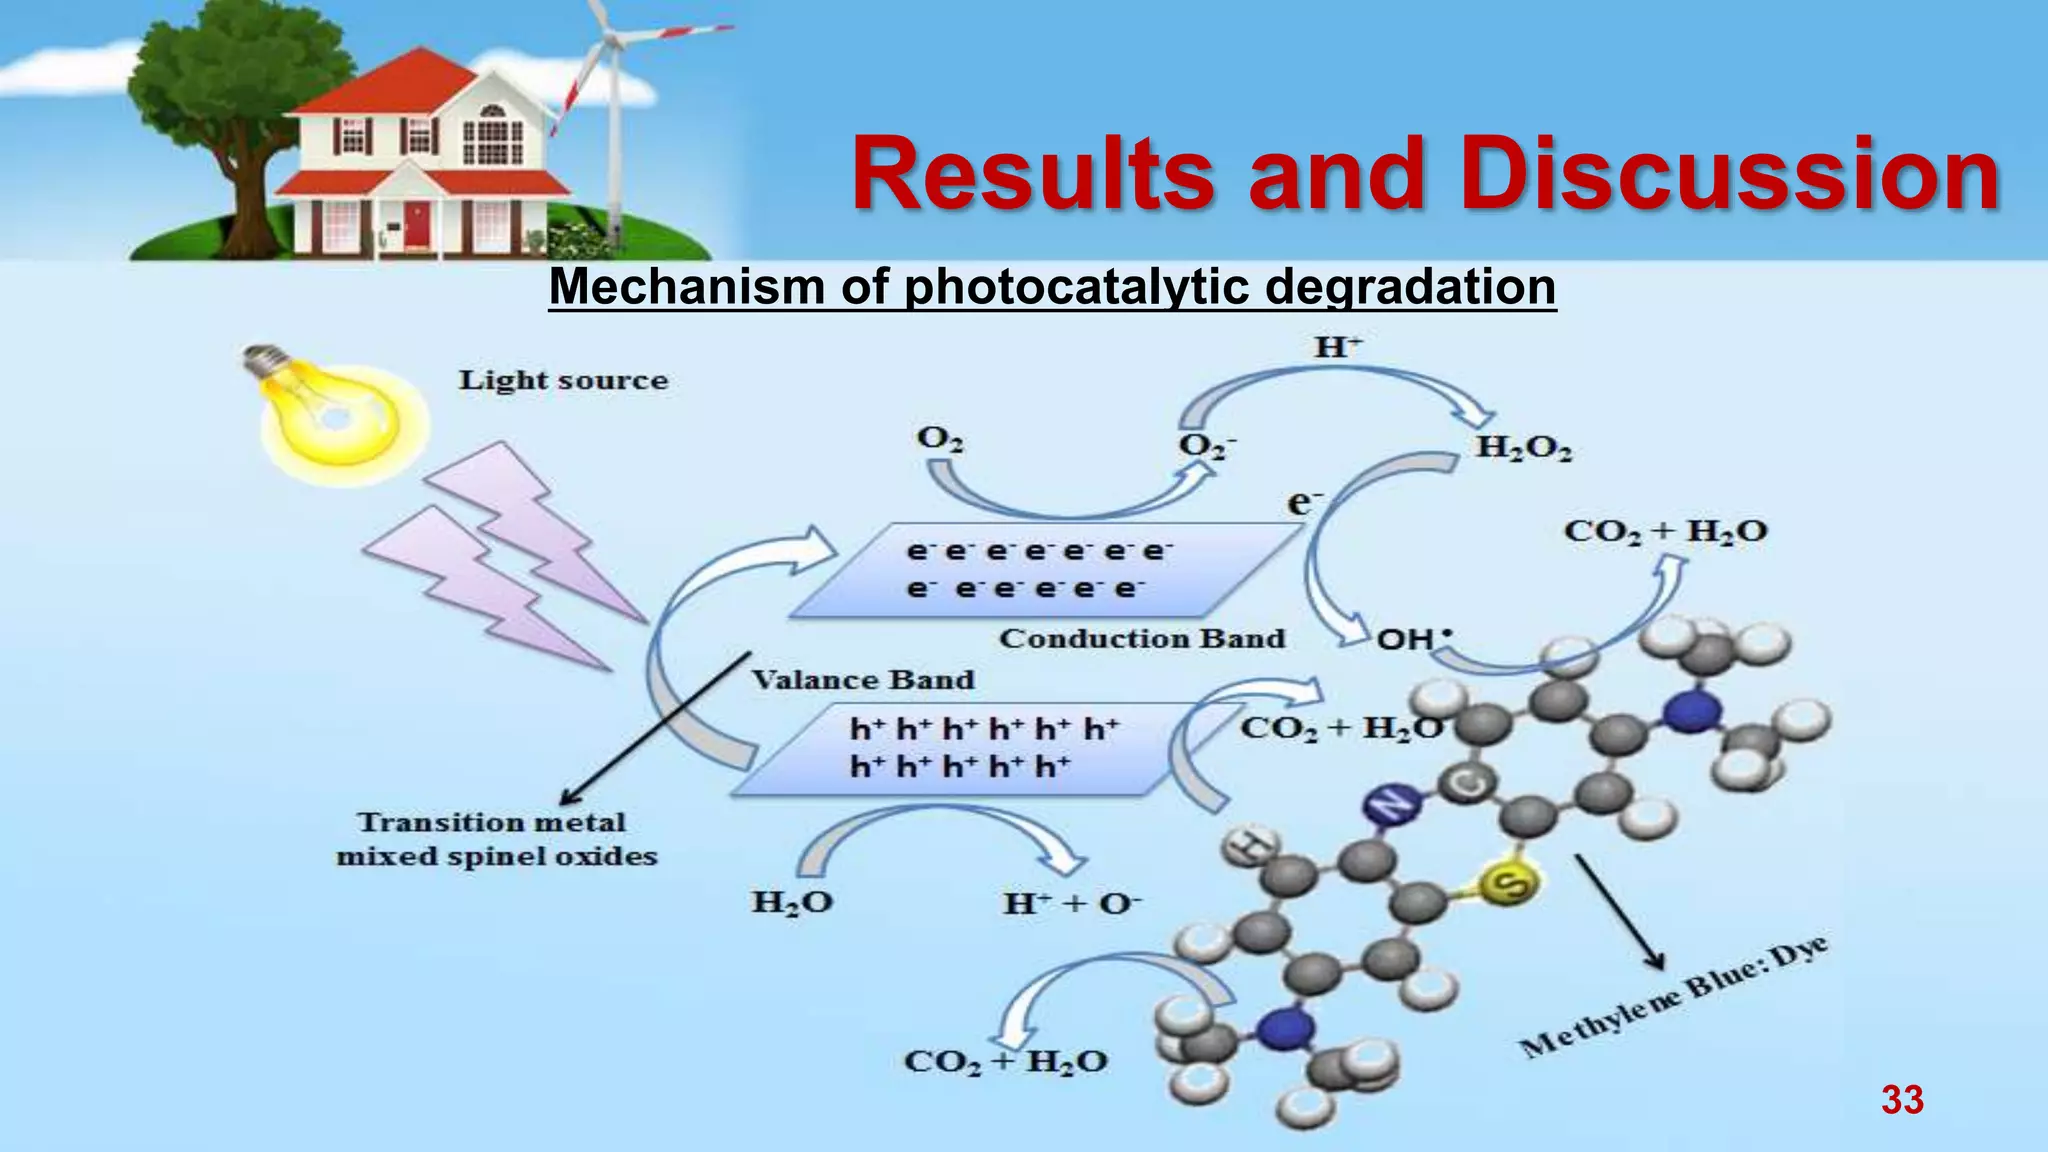
“Photocatalytic Studies of
Transition Metal Oxides
Nanostructures Prepared
through Wet Chemical
Route”
1
2
“Photocatalytic Studies of Transition Metal Oxides
Nanostructures Prepared through Wet Chemical
Route”
The Islamia University of
Bahawalpur
3
Contents
Introduction
• Nanotechnology
• Nanomaterials
• Photocatalysis
• Application of photocatalysis
Experimental work
• Synthesis of simple transition metal oxides
• Synthesis of spinel type mixed transition metal oxides
Results and Discussion
• X-ray Diffraction
• Field emission scanning electron microscopy
• Brunauer-Emmett-Teller (BET)
• Fourier transform infrared spectroscopy
• Current-voltage measurements
• UV/Visible spectroscopy
• Photocatalysis
Conclusion
4
Introduction
5
Introduction
 Nanotechnology is the control or
manipulation of materials in
nano-range.
 The prefix “nano” generates from
Greek word “νᾶνος” (latin word
nanus) have meaning dwarf or a
little man denotes a number 10-9.
 Nano means billionth part of a
meter (1*10-9).
Nanotechnology
6
Introduction
Nanomaterials
7
Introduction
Dimension based nanomaterials
Dimension (D) 8
¶ A process in which a substrate is
activated by light to facilitate or
modify the kinetics of a reaction is
called photocatalysis.
¶ The reaction mechanism have four
steps
 Generation of electron and hole
pairs by the absorption of light
 Charges separation
 Transformation of electron and
hole pairs to the photocatalyst
surface
 Charges utilization to intimate
redox reaction on the surface
Introduction
Photocatalysis
9
Introduction
Band Gap Energy
Band gap energy is the range of several energy levels in a crystal that cannot be
possessed by an electron.
Band gap contrast of metal, semiconductors and insulators 10
Introduction
Applications of photocatalysis
11
Experimental Section
12
Experimental work
Synthesis of Fe2O3, MnO2 Co3O4 and ZnO nanoparticles
13
Experimental work
Synthesis of FeCo2O4, MnCo2O4 and ZnCo2O4 nanoparticles
14
Experimental work
Techniques used for samples characterization
15
Results & Discussion
16
Results and Discussion
XRD pattern of (a) iron oxide (γ-Fe2O3) and (b) manganese oxide (MnO2) nanostructures
X-ray Diffraction
17
Results and Discussion
XRD pattern of (a) cobalt oxide (Co3O4) and(b) zinc oxide (ZnO) nanostructures
X-ray Diffraction
18
Results and Discussion
X-ray Diffraction
XRD patterns of FeCo2O4, MnCo2O4 and ZnCo2O4 nanostructures 19
Results and Discussion
Sr. No.
Sample
Name
Crystal
System
Crystallite
Size (nm)
W. H. Plot
crystallite Size
(nm)
Strain
Lattice Parameters
a (A
ͦ
) c (A
ͦ
)
1 FeCo2O4 Cubic 6.77 6.44 2.64×10⁻⁵ 8.1035 -
2 MnCo2O4 Cubic 7.77 6.6 3.06×10⁻³ 8.0389 -
3 ZnCo2O4 Cubic 7.63 6 3.47×10⁻³ 7.8924 -
4 Fe2O3 Cubic 14.5 10 2.4×10⁻³ 8.8422 -
5 MnO2 Tetragonal 20.77 12 2.37×10⁻³ 9.8649 2.8540
6 Co3O4 Cubic 14.93 16.4 9.9×10⁻⁴ 9.5280 -
7 ZnO Tetragonal 11.76 10.67 1.46×10⁻³ 2.6365 5.2213
XRD parameters of oxides and spinel mixed oxides
20
Results and Discussion
Field Emission Scanning Electron microscopy
FE-SEM images of FeCo2O4, MnCo2O4 and ZnCo2O4 nanostructures
21
Results and Discussion
Brunauer-Emmett-Teller (BET)
Adsorption/desorption isotherm curves (a) FeCo2O4 nanoparticles (b) MnCo2O4
nanoparticles (c) ZnCo2O4 nanoparticles
22
Results and Discussion
Brunauer-Emmett-Teller (BET)
S. No. Sample Name
Surface Area
(m2/g)
Particle size (nm)
Pore Volume
(cm3/g)
Pore size (nm)
1 FeCo2O4 113.93 m2/g 52 nm 0.45 cm3/g 15.71 nm
2 MnCo2O4 50.80 m2/g 118 nm 0.23 cm3/g 18.29 nm
3 ZnCo2O4 29.39 m2/g 204 nm 0.19 cm3/g 25.74 nm
23
Results and Discussion
Fourier Transform Infrared Spectroscopy
FTIR spectra of γ-Fe2O3, MnO2, Co3O4 and ZnO nanostructures 24
Results and Discussion
Fourier Transform Infrared Spectroscopy
FTIR spectra of FeCo2O4, MnCo2O4 and ZnCo2O4 nanostructures 25
Results and Discussion
Current-Voltage (I-V) measurement
The Fe2O3 and MnO2 having S-shaped curves show non-linear and non-ohmic nature and
reveals semi-conductor behavior while the Co3O4 and ZnO exhibit linear curves obey ohm’s
law and demonstrate conducting behavior.
I-V curves of γ-Fe2O3, MnO2, Co3O4 and ZnO nanostructures 26
Results and Discussion
Current-Voltage (I-V) measurement
I-V curves of FeCo2O4 MnCo2O4 and ZnCo2O4 is slightly S-shaped (non-linear or non-
ohmic behavior) which indicates the semi-conducting nature of the material.
I-V curves of FeCo2O4, MnCo2O4 and ZnCo2O4 nanostructures 27
Results and Discussion
Ultraviolet/Visible Spectroscopy
UV-Visible spectra and tauc plots of γ-Fe2O3 and MnO2, nanostructures
28
Results and Discussion
Ultraviolet/Visible Spectroscopy
UV-Visible spectra and tauc plots of Co3O4 and ZnO nanostructures
29
Results and Discussion
Ultraviolet/Visible Spectroscopy
UV/Visible spectra and tauc plots of FeCo2O4, MnCo2O4 and ZnCo2O4 nanostructures
30
Results and Discussion
Photocatalytic degradation
Photocatalytic degradation of MB for γ-Fe2O3, MnO2, Co3O4 and ZnO nanophotocatalysts
31
Photocatalytic activity of the prepared oxides and mixed oxides was examined using
5ppm of methylene blue (MB) as a dye. Carry 60 ultraviolet spectrophotometer was
used to judge decrement in the absorption.
Results and Discussion
Photocatalytic degradation
Photocatalytic degradation of MB for of FeCo2O4, MnCo2O4 and ZnCo2O4 nanophotocatalysts
32
Results and Discussion
Mechanism of photocatalytic degradation
33
Results and Discussion
Sr. No. Sample Name Degradation (%) Rate Constant (min-1)
1 FeCo2O4 89.02% 1.87×10⁻²
2 MnCo2O4 74.83% 1.12×10⁻²
3 ZnCo2O4 77.50% 1.4×10⁻²
4 Fe2O3 74.58% 1.36×10⁻²
5 MnO2 54.03% 1.03×10⁻²
6 Co3O4 56.40% 1.06×10⁻²
7 ZnO 44% 1.00×10⁻²
Percentage degradation and rate constant (min-1) values of different samples.
34
 Spinel mixed oxides have superior photocatalytic activity than simple metal oxides.
Results and Discussion
Percentage degradation rate of MB at specific time intervals under different photocatalyst
(a) FeCo2O4, MnCo2O4 and ZnCo2O4 (b) Fe2O3, MnO2, Co3O4 and ZnO nanophotocatalysts
35
Conclusion
 Photocatalytic degradation capability of simple transition
metal oxides and spinel mixed metal oxides under visible
light irradiation have been studied.
 spinel mixed oxides have superior photocatalytic activity
than simple metal oxides.
 The enhanced photocatalytic behavior of spinel metal
oxides is attributed to …..
 Small crystallite size
 Increased surface area of nano-catalyst
 High light absorption rate at the interface of photocatalyst
 Decrease rate of reunion of charge carriers at the
interface of photocatalyst
36
Publications
37
Any Questions?
38
Acknowledgement
 All praises and thanks to Allah Almighty who created the universe and knows whatever is in
it, hidden or evident, and who bestowed upon me the intellectual ability and wisdom to search
for its secrets.
 Ever-Thankful, for His helps and bless. Many prayers for the Holy Prophet Muhammad ‫ﷺ‬
( )
 There are no proper words to convey my deep gratitude and respect for my thesis and
research advisor, Dr. Muhammad Farooq Warsi.
 I am keenly thankful to the worthy chairman Department of chemistry, Professor Dr.
Muhammad Ashfaq for providing all the research facilities to complete this research project
in time.
 XRD (QAU), FTIR (Women uni multan), IV (physics department, IUB), UV/VIS (IFS Sweden),
SEM and BET (Dr. Sonia American uni cairo Egypt) are also highly acknowledged for
providing these characterizations.
 I want to give special gratitude to my sister, Wajeeha Shaheen.
 . I would also like to thank Simab Gul, Hira and Attiya Rahman for their corporation.
39
40

Photocatalysis

  • 1.
    “Photocatalytic Studies of TransitionMetal Oxides Nanostructures Prepared through Wet Chemical Route” 1
  • 2.
  • 3.
    “Photocatalytic Studies ofTransition Metal Oxides Nanostructures Prepared through Wet Chemical Route” The Islamia University of Bahawalpur 3
  • 4.
    Contents Introduction • Nanotechnology • Nanomaterials •Photocatalysis • Application of photocatalysis Experimental work • Synthesis of simple transition metal oxides • Synthesis of spinel type mixed transition metal oxides Results and Discussion • X-ray Diffraction • Field emission scanning electron microscopy • Brunauer-Emmett-Teller (BET) • Fourier transform infrared spectroscopy • Current-voltage measurements • UV/Visible spectroscopy • Photocatalysis Conclusion 4
  • 5.
  • 6.
    Introduction  Nanotechnology isthe control or manipulation of materials in nano-range.  The prefix “nano” generates from Greek word “νᾶνος” (latin word nanus) have meaning dwarf or a little man denotes a number 10-9.  Nano means billionth part of a meter (1*10-9). Nanotechnology 6
  • 7.
  • 8.
  • 9.
    ¶ A processin which a substrate is activated by light to facilitate or modify the kinetics of a reaction is called photocatalysis. ¶ The reaction mechanism have four steps  Generation of electron and hole pairs by the absorption of light  Charges separation  Transformation of electron and hole pairs to the photocatalyst surface  Charges utilization to intimate redox reaction on the surface Introduction Photocatalysis 9
  • 10.
    Introduction Band Gap Energy Bandgap energy is the range of several energy levels in a crystal that cannot be possessed by an electron. Band gap contrast of metal, semiconductors and insulators 10
  • 11.
  • 12.
  • 13.
    Experimental work Synthesis ofFe2O3, MnO2 Co3O4 and ZnO nanoparticles 13
  • 14.
    Experimental work Synthesis ofFeCo2O4, MnCo2O4 and ZnCo2O4 nanoparticles 14
  • 15.
    Experimental work Techniques usedfor samples characterization 15
  • 16.
  • 17.
    Results and Discussion XRDpattern of (a) iron oxide (γ-Fe2O3) and (b) manganese oxide (MnO2) nanostructures X-ray Diffraction 17
  • 18.
    Results and Discussion XRDpattern of (a) cobalt oxide (Co3O4) and(b) zinc oxide (ZnO) nanostructures X-ray Diffraction 18
  • 19.
    Results and Discussion X-rayDiffraction XRD patterns of FeCo2O4, MnCo2O4 and ZnCo2O4 nanostructures 19
  • 20.
    Results and Discussion Sr.No. Sample Name Crystal System Crystallite Size (nm) W. H. Plot crystallite Size (nm) Strain Lattice Parameters a (A ͦ ) c (A ͦ ) 1 FeCo2O4 Cubic 6.77 6.44 2.64×10⁻⁵ 8.1035 - 2 MnCo2O4 Cubic 7.77 6.6 3.06×10⁻³ 8.0389 - 3 ZnCo2O4 Cubic 7.63 6 3.47×10⁻³ 7.8924 - 4 Fe2O3 Cubic 14.5 10 2.4×10⁻³ 8.8422 - 5 MnO2 Tetragonal 20.77 12 2.37×10⁻³ 9.8649 2.8540 6 Co3O4 Cubic 14.93 16.4 9.9×10⁻⁴ 9.5280 - 7 ZnO Tetragonal 11.76 10.67 1.46×10⁻³ 2.6365 5.2213 XRD parameters of oxides and spinel mixed oxides 20
  • 21.
    Results and Discussion FieldEmission Scanning Electron microscopy FE-SEM images of FeCo2O4, MnCo2O4 and ZnCo2O4 nanostructures 21
  • 22.
    Results and Discussion Brunauer-Emmett-Teller(BET) Adsorption/desorption isotherm curves (a) FeCo2O4 nanoparticles (b) MnCo2O4 nanoparticles (c) ZnCo2O4 nanoparticles 22
  • 23.
    Results and Discussion Brunauer-Emmett-Teller(BET) S. No. Sample Name Surface Area (m2/g) Particle size (nm) Pore Volume (cm3/g) Pore size (nm) 1 FeCo2O4 113.93 m2/g 52 nm 0.45 cm3/g 15.71 nm 2 MnCo2O4 50.80 m2/g 118 nm 0.23 cm3/g 18.29 nm 3 ZnCo2O4 29.39 m2/g 204 nm 0.19 cm3/g 25.74 nm 23
  • 24.
    Results and Discussion FourierTransform Infrared Spectroscopy FTIR spectra of γ-Fe2O3, MnO2, Co3O4 and ZnO nanostructures 24
  • 25.
    Results and Discussion FourierTransform Infrared Spectroscopy FTIR spectra of FeCo2O4, MnCo2O4 and ZnCo2O4 nanostructures 25
  • 26.
    Results and Discussion Current-Voltage(I-V) measurement The Fe2O3 and MnO2 having S-shaped curves show non-linear and non-ohmic nature and reveals semi-conductor behavior while the Co3O4 and ZnO exhibit linear curves obey ohm’s law and demonstrate conducting behavior. I-V curves of γ-Fe2O3, MnO2, Co3O4 and ZnO nanostructures 26
  • 27.
    Results and Discussion Current-Voltage(I-V) measurement I-V curves of FeCo2O4 MnCo2O4 and ZnCo2O4 is slightly S-shaped (non-linear or non- ohmic behavior) which indicates the semi-conducting nature of the material. I-V curves of FeCo2O4, MnCo2O4 and ZnCo2O4 nanostructures 27
  • 28.
    Results and Discussion Ultraviolet/VisibleSpectroscopy UV-Visible spectra and tauc plots of γ-Fe2O3 and MnO2, nanostructures 28
  • 29.
    Results and Discussion Ultraviolet/VisibleSpectroscopy UV-Visible spectra and tauc plots of Co3O4 and ZnO nanostructures 29
  • 30.
    Results and Discussion Ultraviolet/VisibleSpectroscopy UV/Visible spectra and tauc plots of FeCo2O4, MnCo2O4 and ZnCo2O4 nanostructures 30
  • 31.
    Results and Discussion Photocatalyticdegradation Photocatalytic degradation of MB for γ-Fe2O3, MnO2, Co3O4 and ZnO nanophotocatalysts 31 Photocatalytic activity of the prepared oxides and mixed oxides was examined using 5ppm of methylene blue (MB) as a dye. Carry 60 ultraviolet spectrophotometer was used to judge decrement in the absorption.
  • 32.
    Results and Discussion Photocatalyticdegradation Photocatalytic degradation of MB for of FeCo2O4, MnCo2O4 and ZnCo2O4 nanophotocatalysts 32
  • 33.
    Results and Discussion Mechanismof photocatalytic degradation 33
  • 34.
    Results and Discussion Sr.No. Sample Name Degradation (%) Rate Constant (min-1) 1 FeCo2O4 89.02% 1.87×10⁻² 2 MnCo2O4 74.83% 1.12×10⁻² 3 ZnCo2O4 77.50% 1.4×10⁻² 4 Fe2O3 74.58% 1.36×10⁻² 5 MnO2 54.03% 1.03×10⁻² 6 Co3O4 56.40% 1.06×10⁻² 7 ZnO 44% 1.00×10⁻² Percentage degradation and rate constant (min-1) values of different samples. 34
  • 35.
     Spinel mixedoxides have superior photocatalytic activity than simple metal oxides. Results and Discussion Percentage degradation rate of MB at specific time intervals under different photocatalyst (a) FeCo2O4, MnCo2O4 and ZnCo2O4 (b) Fe2O3, MnO2, Co3O4 and ZnO nanophotocatalysts 35
  • 36.
    Conclusion  Photocatalytic degradationcapability of simple transition metal oxides and spinel mixed metal oxides under visible light irradiation have been studied.  spinel mixed oxides have superior photocatalytic activity than simple metal oxides.  The enhanced photocatalytic behavior of spinel metal oxides is attributed to …..  Small crystallite size  Increased surface area of nano-catalyst  High light absorption rate at the interface of photocatalyst  Decrease rate of reunion of charge carriers at the interface of photocatalyst 36
  • 37.
  • 38.
  • 39.
    Acknowledgement  All praisesand thanks to Allah Almighty who created the universe and knows whatever is in it, hidden or evident, and who bestowed upon me the intellectual ability and wisdom to search for its secrets.  Ever-Thankful, for His helps and bless. Many prayers for the Holy Prophet Muhammad ‫ﷺ‬ ( )  There are no proper words to convey my deep gratitude and respect for my thesis and research advisor, Dr. Muhammad Farooq Warsi.  I am keenly thankful to the worthy chairman Department of chemistry, Professor Dr. Muhammad Ashfaq for providing all the research facilities to complete this research project in time.  XRD (QAU), FTIR (Women uni multan), IV (physics department, IUB), UV/VIS (IFS Sweden), SEM and BET (Dr. Sonia American uni cairo Egypt) are also highly acknowledged for providing these characterizations.  I want to give special gratitude to my sister, Wajeeha Shaheen.  . I would also like to thank Simab Gul, Hira and Attiya Rahman for their corporation. 39
  • 40.