Downloaded 268 times
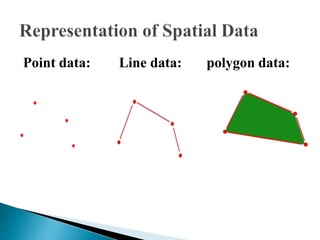
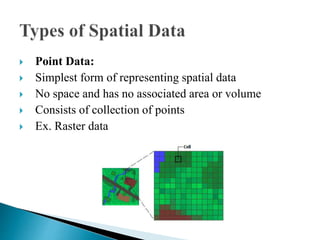


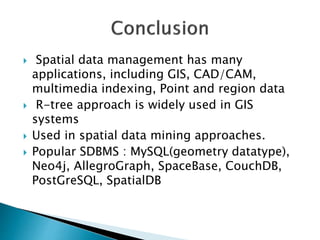


The document provides an overview of spatial data, including its definitions, types, queries, and indexing techniques. It discusses applications such as Geographic Information Systems (GIS) and multimedia databases, while comparing various indexing methods like R-trees, grid files, and region quad-trees. The challenges of managing high-dimensional spatial data and the use of spatial data in different database management systems are also highlighted.


![Attack surfaces and attack tress[inform]](https://cdn.slidesharecdn.com/ss_thumbnails/lecture03-260108015941-a4dee53b-thumbnail.jpg?width=640&height=640&fit=bounds)


