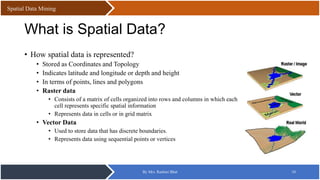
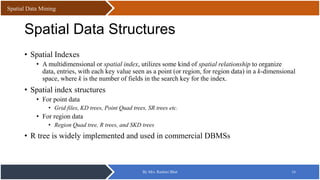
This document discusses spatial data mining. It defines spatial data as data pertaining to the geographic location of features and boundaries on Earth. Spatial data mining involves discovering patterns from large spatial datasets and can be used for applications like GIS, geomarketing, and natural disaster prediction. Some key techniques of spatial data mining include spatial classification, clustering, and detecting trends and autocorrelation. The document also discusses spatial data structures like grids, R-trees, and z-ordering which are used to store and index spatial data.
Spatial databases are used to store geographic information. Querying on such databases are : range queries, nearest neighbor queries and spatial joins. Many indexing techniques are used for faster retrieval of data out of which r-trees are mainly efficient. Other indexing techniques are quad-trees, grid files etc. Spatial data is used in GIS applications.
Database Structures – Relational, Object Oriented – ER diagram - spatial data models – Raster Data Structures – Raster Data Compression - Vector Data Structures - Raster vs Vector Models TIN and GRID data models - OGC standards - Data Quality.
Spatial data is comprised of objects in multi-dimensional space.
Storing spatial data in a standard database would require excessive amounts of space.Queries to retrieve and analyze spatial data from a standard database would be long and cumbersome leaving a lot of room for error.
Spatial databases provide much more efficient storage, retrieval, and analysis of spatial data.
Geo-referencing is GIS based spatial analysis technique which is discussed in this presentation.For video you can see following link:
https://www.youtube.com/watch?v=h559lOsvOU8&feature=youtu.be&fbclid=IwAR3PB9YB4i86zrYyzxbiz_g2-4_ujowdO1gfm4Lz5E3vGf56Fn5DAzeUA_8
This presentation gives the idea about Data Preprocessing in the field of Data Mining. Images, examples and other things are adopted from "Data Mining Concepts and Techniques by Jiawei Han, Micheline Kamber and Jian Pei "
We present an automatic approach for discovering location names in WWW data culled from diverse domains. Our approach builds upon the Apache Tika, Apache OpenNLP, and Apache Lucene frameworks. Tika is used to extract text and metadata from any file. The text and metadata are provided to Apache OpenNLP and its location entity extraction model. The discovered location entities are then delivered to a gazetteer indexed in Apache Lucene derived from the Geonames.org dataset. This paper describes the overall approach and then explains in detail the challenges we faced, and the methodology that we employed to overcome them. We describe the evolution of our geo gazetteer process and algorithm and demonstrate the approach’s accuracy in data collected in the DARPA MEMEX and NSF Polar Cyber Infrastructure efforts.
PostGIS is a spatial extension for PostgreSQL
PostGIS aims to be an “OpenGIS Simple Features for SQL” compliant spatial database
I am the principal developer
Big Data and Geospatial with HPCC SystemsHPCC Systems
This presentation covers one topic that we have mastered after several years : Geospatial.
We will reveal how we deal with very specific spatial challenges in our day to day use cases :
• Answer questions combining the best of BigData and geospatial analysis.
• Ingestion and use of raster and vector data with our Massive Parallel Processing platform (Thor).
• Store and query spatial information with sub-second queries, using our data refinery (Roxie)
And much more under the umbrella of LexisNexis HPCC Systems (High Performance Computing Cluster), an open source platform for Big Data processing and analytics.
UNIT - 5: Data Warehousing and Data MiningNandakumar P
UNIT-V
Mining Object, Spatial, Multimedia, Text, and Web Data: Multidimensional Analysis and Descriptive Mining of Complex Data Objects – Spatial Data Mining – Multimedia Data Mining – Text Mining – Mining the World Wide Web.
The PPT describes following contents
What is process?
Scheduling Criteria
Types of schedulers
Process Scheduling algorithms along with examples.
Threads
Multithreading
User thread
kernel thread
LF Energy Webinar: Electrical Grid Modelling and Simulation Through PowSyBl -...DanBrown980551
Do you want to learn how to model and simulate an electrical network from scratch in under an hour?
Then welcome to this PowSyBl workshop, hosted by Rte, the French Transmission System Operator (TSO)!
During the webinar, you will discover the PowSyBl ecosystem as well as handle and study an electrical network through an interactive Python notebook.
PowSyBl is an open source project hosted by LF Energy, which offers a comprehensive set of features for electrical grid modelling and simulation. Among other advanced features, PowSyBl provides:
- A fully editable and extendable library for grid component modelling;
- Visualization tools to display your network;
- Grid simulation tools, such as power flows, security analyses (with or without remedial actions) and sensitivity analyses;
The framework is mostly written in Java, with a Python binding so that Python developers can access PowSyBl functionalities as well.
What you will learn during the webinar:
- For beginners: discover PowSyBl's functionalities through a quick general presentation and the notebook, without needing any expert coding skills;
- For advanced developers: master the skills to efficiently apply PowSyBl functionalities to your real-world scenarios.
The Art of the Pitch: WordPress Relationships and SalesLaura Byrne
Clients don’t know what they don’t know. What web solutions are right for them? How does WordPress come into the picture? How do you make sure you understand scope and timeline? What do you do if sometime changes?
All these questions and more will be explored as we talk about matching clients’ needs with what your agency offers without pulling teeth or pulling your hair out. Practical tips, and strategies for successful relationship building that leads to closing the deal.
GDG Cloud Southlake #33: Boule & Rebala: Effective AppSec in SDLC using Deplo...James Anderson
Effective Application Security in Software Delivery lifecycle using Deployment Firewall and DBOM
The modern software delivery process (or the CI/CD process) includes many tools, distributed teams, open-source code, and cloud platforms. Constant focus on speed to release software to market, along with the traditional slow and manual security checks has caused gaps in continuous security as an important piece in the software supply chain. Today organizations feel more susceptible to external and internal cyber threats due to the vast attack surface in their applications supply chain and the lack of end-to-end governance and risk management.
The software team must secure its software delivery process to avoid vulnerability and security breaches. This needs to be achieved with existing tool chains and without extensive rework of the delivery processes. This talk will present strategies and techniques for providing visibility into the true risk of the existing vulnerabilities, preventing the introduction of security issues in the software, resolving vulnerabilities in production environments quickly, and capturing the deployment bill of materials (DBOM).
Speakers:
Bob Boule
Robert Boule is a technology enthusiast with PASSION for technology and making things work along with a knack for helping others understand how things work. He comes with around 20 years of solution engineering experience in application security, software continuous delivery, and SaaS platforms. He is known for his dynamic presentations in CI/CD and application security integrated in software delivery lifecycle.
Gopinath Rebala
Gopinath Rebala is the CTO of OpsMx, where he has overall responsibility for the machine learning and data processing architectures for Secure Software Delivery. Gopi also has a strong connection with our customers, leading design and architecture for strategic implementations. Gopi is a frequent speaker and well-known leader in continuous delivery and integrating security into software delivery.
Unlocking Productivity: Leveraging the Potential of Copilot in Microsoft 365, a presentation by Christoforos Vlachos, Senior Solutions Manager – Modern Workplace, Uni Systems
In the rapidly evolving landscape of technologies, XML continues to play a vital role in structuring, storing, and transporting data across diverse systems. The recent advancements in artificial intelligence (AI) present new methodologies for enhancing XML development workflows, introducing efficiency, automation, and intelligent capabilities. This presentation will outline the scope and perspective of utilizing AI in XML development. The potential benefits and the possible pitfalls will be highlighted, providing a balanced view of the subject.
We will explore the capabilities of AI in understanding XML markup languages and autonomously creating structured XML content. Additionally, we will examine the capacity of AI to enrich plain text with appropriate XML markup. Practical examples and methodological guidelines will be provided to elucidate how AI can be effectively prompted to interpret and generate accurate XML markup.
Further emphasis will be placed on the role of AI in developing XSLT, or schemas such as XSD and Schematron. We will address the techniques and strategies adopted to create prompts for generating code, explaining code, or refactoring the code, and the results achieved.
The discussion will extend to how AI can be used to transform XML content. In particular, the focus will be on the use of AI XPath extension functions in XSLT, Schematron, Schematron Quick Fixes, or for XML content refactoring.
The presentation aims to deliver a comprehensive overview of AI usage in XML development, providing attendees with the necessary knowledge to make informed decisions. Whether you’re at the early stages of adopting AI or considering integrating it in advanced XML development, this presentation will cover all levels of expertise.
By highlighting the potential advantages and challenges of integrating AI with XML development tools and languages, the presentation seeks to inspire thoughtful conversation around the future of XML development. We’ll not only delve into the technical aspects of AI-powered XML development but also discuss practical implications and possible future directions.
Sudheer Mechineni, Head of Application Frameworks, Standard Chartered Bank
Discover how Standard Chartered Bank harnessed the power of Neo4j to transform complex data access challenges into a dynamic, scalable graph database solution. This keynote will cover their journey from initial adoption to deploying a fully automated, enterprise-grade causal cluster, highlighting key strategies for modelling organisational changes and ensuring robust disaster recovery. Learn how these innovations have not only enhanced Standard Chartered Bank’s data infrastructure but also positioned them as pioneers in the banking sector’s adoption of graph technology.
Climate Impact of Software Testing at Nordic Testing DaysKari Kakkonen
My slides at Nordic Testing Days 6.6.2024
Climate impact / sustainability of software testing discussed on the talk. ICT and testing must carry their part of global responsibility to help with the climat warming. We can minimize the carbon footprint but we can also have a carbon handprint, a positive impact on the climate. Quality characteristics can be added with sustainability, and then measured continuously. Test environments can be used less, and in smaller scale and on demand. Test techniques can be used in optimizing or minimizing number of tests. Test automation can be used to speed up testing.
DevOps and Testing slides at DASA ConnectKari Kakkonen
My and Rik Marselis slides at 30.5.2024 DASA Connect conference. We discuss about what is testing, then what is agile testing and finally what is Testing in DevOps. Finally we had lovely workshop with the participants trying to find out different ways to think about quality and testing in different parts of the DevOps infinity loop.
Pushing the limits of ePRTC: 100ns holdover for 100 daysAdtran
At WSTS 2024, Alon Stern explored the topic of parametric holdover and explained how recent research findings can be implemented in real-world PNT networks to achieve 100 nanoseconds of accuracy for up to 100 days.
UiPath Test Automation using UiPath Test Suite series, part 5DianaGray10
Welcome to UiPath Test Automation using UiPath Test Suite series part 5. In this session, we will cover CI/CD with devops.
Topics covered:
CI/CD with in UiPath
End-to-end overview of CI/CD pipeline with Azure devops
Speaker:
Lyndsey Byblow, Test Suite Sales Engineer @ UiPath, Inc.
Generative AI Deep Dive: Advancing from Proof of Concept to ProductionAggregage
Join Maher Hanafi, VP of Engineering at Betterworks, in this new session where he'll share a practical framework to transform Gen AI prototypes into impactful products! He'll delve into the complexities of data collection and management, model selection and optimization, and ensuring security, scalability, and responsible use.
Maruthi Prithivirajan, Head of ASEAN & IN Solution Architecture, Neo4j
Get an inside look at the latest Neo4j innovations that enable relationship-driven intelligence at scale. Learn more about the newest cloud integrations and product enhancements that make Neo4j an essential choice for developers building apps with interconnected data and generative AI.
Removing Uninteresting Bytes in Software FuzzingAftab Hussain
Imagine a world where software fuzzing, the process of mutating bytes in test seeds to uncover hidden and erroneous program behaviors, becomes faster and more effective. A lot depends on the initial seeds, which can significantly dictate the trajectory of a fuzzing campaign, particularly in terms of how long it takes to uncover interesting behaviour in your code. We introduce DIAR, a technique designed to speedup fuzzing campaigns by pinpointing and eliminating those uninteresting bytes in the seeds. Picture this: instead of wasting valuable resources on meaningless mutations in large, bloated seeds, DIAR removes the unnecessary bytes, streamlining the entire process.
In this work, we equipped AFL, a popular fuzzer, with DIAR and examined two critical Linux libraries -- Libxml's xmllint, a tool for parsing xml documents, and Binutil's readelf, an essential debugging and security analysis command-line tool used to display detailed information about ELF (Executable and Linkable Format). Our preliminary results show that AFL+DIAR does not only discover new paths more quickly but also achieves higher coverage overall. This work thus showcases how starting with lean and optimized seeds can lead to faster, more comprehensive fuzzing campaigns -- and DIAR helps you find such seeds.
- These are slides of the talk given at IEEE International Conference on Software Testing Verification and Validation Workshop, ICSTW 2022.
GraphSummit Singapore | The Future of Agility: Supercharging Digital Transfor...Neo4j
Leonard Jayamohan, Partner & Generative AI Lead, Deloitte
This keynote will reveal how Deloitte leverages Neo4j’s graph power for groundbreaking digital twin solutions, achieving a staggering 100x performance boost. Discover the essential role knowledge graphs play in successful generative AI implementations. Plus, get an exclusive look at an innovative Neo4j + Generative AI solution Deloitte is developing in-house.
How to Get CNIC Information System with Paksim Ga.pptxdanishmna97
Pakdata Cf is a groundbreaking system designed to streamline and facilitate access to CNIC information. This innovative platform leverages advanced technology to provide users with efficient and secure access to their CNIC details.
2. What is Spatial Data?
• Data pertaining to the space occupied objects
• Data that identifies the geographic location of features and boundaries on Earth
• E.g. roadmap indicating cities, roads etc.
• Spatial database stores large amount of spatial data such as maps, pre-processed
remote sensing or medical imaging data.
• Spatial database have topological and distance information
• Requires spatial indexing, data access, reasoning, geometric computation and knowledge
representation techniques.
By Mrs. Rashmi Bhat 2
Spatial Data Mining
3. What is Spatial Data?
• Two distinct types of attributes
• Non-spatial attributes
• Independent of geometric considerations
• Same as in traditional data mining
• Numerical, categorical, ordinal etc.
• E.g. City_name, City_population, City_zip
• Spatial attributes
• Includes data which is geographically referenced
• Includes location, shape, size and orientation
• Deals with neighborhood and extent
• E.g. longitude, latitude, elevation
By Mrs. Rashmi Bhat 3
Spatial Data Mining
4. What is Spatial Data?
• A spatial data object occupies a certain region of space, called its spatial extent,
which is characterized by its location and boundary.
• Spatial data can be either point data or region data.
• Point data
• A point has a spatial extent characterized completely by its location.
• It occupies no space and has no associated area or volume
• Point data consists of collection of points in multidimensional space.
• Raster data is an example of directly measured point data.
By Mrs. Rashmi Bhat 4
Spatial Data Mining
5. What is Spatial Data?
• Region data
• A region has a spatial extent with a location and a boundary.
• The location can be thought of the position of a fixed 'anchor point' for the region, such as its
centroid.
• In two dimensions, the boundary can be visualized as a line (for finite regions, a closed loop),
and in three dimensions, it is a surface.
• Region data consists of a collection of regions.
• Vector data is used to describe the geometric approximations, constructed using points, line
segments, polygons, spheres, cubes.
• E.g. roads and rivers can be represented as a collection of line segments, and countries, states,
and lakes can be represented as polygons.
By Mrs. Rashmi Bhat 5
Spatial Data Mining
6. What is Spatial Data?
By Mrs. Rashmi Bhat 6
Spatial Data Mining
7. What is Spatial Data?
• Operations performed to manipulate vector data
• Determining distance between two objects
• Determining the area of the object
• Determining the length of the object
• Determining an intersection or union of the objects
• Determining mutual positions of the two object
By Mrs. Rashmi Bhat 7
Spatial Data Mining
8. What is Spatial Data?
• Spatial Relationships
By Mrs. Rashmi Bhat 8
Spatial Data Mining
disjoint
contains equals intersects overlaps touches within
Object1 Object 2
9. What is Spatial Data?
• Spatial Relationships
By Mrs. Rashmi Bhat 9
Spatial Data Mining
Land area contains Lake & Lake is within the land
area
Two countries are disjoint
Two roads intersect each other
Front pyramid overlaps the pyramid in back
State1 touches state2
10. What is Spatial Data?
• How spatial data is represented?
• Stored as Coordinates and Topology
• Indicates latitude and longitude or depth and height
• In terms of points, lines and polygons
• Raster data
• Consists of a matrix of cells organized into rows and columns in which each
cell represents specific spatial information
• Represents data in cells or in grid matrix
• Vector Data
• Used to store data that has discrete boundaries.
• Represents data using sequential points or vertices
By Mrs. Rashmi Bhat 10
Spatial Data Mining
11. What is Spatial Data?
By Mrs. Rashmi Bhat 11
Spatial Data Mining
Fig. In-car Navigation System
Fig. Road Map
12. What is Spatial Data Mining?
• Spatial mining is the process of discovering interesting and previously unknown
but potentially useful patterns from large spatial datasets.
• It is more difficult process due to complexity of spatial data types, spatial
relationships and spatial autocorrelation.
• It demands an integration of data mining with spatial database technologies.
• It can be used for
• understanding spatial data,
• discovering spatial relationships and relationships between spatial and nonspatial data,
• constructing spatial knowledge bases,
• reorganizing spatial databases, and
• optimizing spatial queries.
By Mrs. Rashmi Bhat 12
Spatial Data Mining
13. What is Spatial Data Mining?
• Spatial Data Mining Techniques
• Spatial Classification
• Spatial Prediction
• Spatial Association Rule
• Spatial Co-location Mining
• Spatial Clustering
• Spatial Trend Detection
• Spatial Autocorrelation
By Mrs. Rashmi Bhat 13
Spatial Data Mining
14. What is Spatial Data Mining?
• Spatial Data Mining Applications
• GIS
• Geomarketing
• Remote sensing
• Navigation
• Satellite communication
• Natural disaster prediction
• Agriculture development using biodiversity
• Real estate business for land evaluation
• For environmental studies
• And many more…
By Mrs. Rashmi Bhat 14
Spatial Data Mining
15. What is Spatial Data Mining?
• How spatial data mining is different from classical data mining?
• The data input of spatial data mining are more complex than the inputs of classical data
mining
• The data input of spatial data mining have two distinct types: spatial and non-spatial
attributes
• Data input to spatial data mining are implicit in nature
• Statistical foundation for spatial data mining is spatial autocorrelation while for data mining
its independence of samples
• Output of spatial data mining is spatial interest based, while that of classical data mining its
set based.
By Mrs. Rashmi Bhat 15
Spatial Data Mining
16. Spatial Data Structures
• Spatial Indexes
• A multidimensional or spatial index, utilizes some kind of spatial relationship to organize
data, entries, with each key value seen as a point (or region, for region data) in a k-dimensional
space, where k is the number of fields in the search key for the index.
• Spatial index structures
• For point data
• Grid files, KD trees, Point Quad trees, SR trees etc.
• For region data
• Region Quad tree, R trees, and SKD trees
• R tree is widely implemented and used in commercial DBMSs
By Mrs. Rashmi Bhat 16
Spatial Data Mining
17. Spatial Data Structures
• Spatial Indexes
• Most commonly used three approaches
• Z-ordering for point data (based on space filling curve)
• Grid Files
• R trees
By Mrs. Rashmi Bhat 17
Spatial Data Mining
18. Spatial Data Structures
• Z-ordering
• Space-filling curves are based on the assumption that any attribute value can be represented
with some fixed number of bits, say k bits.
• The maximum number of values along each dimension is 2𝑘
By Mrs. Rashmi Bhat 18
Spatial Data Mining
1st iteration 2nd iteration 3rd iteration 4th iteration
20. Spatial Data Structures
• Z-ordering
• Z-ordering recursively decomposes the data space into quadrants and subquadrants.
• The Region quad tree structure corresponds directly to the recursive decomposition of the
data space.
• Each node in the tree corresponds to a square-shaped region of the data space.
• The root corresponds to the entire data space, and leaf nodes correspond to exactly one point.
• Each internal node has four children, corresponding to the four quadrants into which the space
corresponding to the node is partitioned:
• 00 identifies the top left quadrant,
• 01 identifies the top right quadrant,
• 10 identifies the bottom left quadrant, and
• 11 identifies the bottom right quadrant.
By Mrs. Rashmi Bhat 20
Spatial Data Mining
22. Spatial Data Structures
• Grid Files
• Grid cells represents or defines a class, group, category or membership
By Mrs. Rashmi Bhat 22
Spatial Data Mining
23. Spatial Data Structures
• R-Tree
• Groups nearby objects and represents them with their minimum bounding rectangle (MBR) in
the next higher level of the tree
• “R” in R-tree stands for rectangle.
• Nodes of the tree store MBRs of objects or collections of objects
• The leaf nodes of the R-tree store the exact MBRs or bounding boxes of the individual
geometric objects, along with a pointer to the storage location of the contained geometry.
• All non-leaf nodes store references to several bounding boxes for each of which is a pointer to
a lower level node.
• The tree is constructed hierarchically by grouping the leaf boxes into larger, higher level boxes
which may themselves be grouped into even larger boxes at the next higher level.
By Mrs. Rashmi Bhat 23
Spatial Data Mining
25. Spatial Data Structures
• R-Tree
• The tree is constructed hierarchically by grouping the leaf boxes into larger, higher level boxes
which may themselves be grouped into even larger boxes at the next higher level.
• Since the original boxes are never sub-divided, as a consequence the non-leaf node ‘covering
boxes’ can be expected to overlap each other.
By Mrs. Rashmi Bhat 25
Spatial Data Mining
26. Spatial Autocorrelation
• Spatial Autocorrelation
• “Everything is related to everything else but nearby things are more related than distant
things”
• Spatial autocorrelation defines measures how much close objects are in comparison with other
close objects in space
• Moran’s I classifies:
By Mrs. Rashmi Bhat 26
Spatial Data Mining
Positive Spatial
Autocorrelation
No Spatial
Autocorrelation
Negative Spatial
Autocorrelation
27. Mining Spatial Associations
• Similar to the mining of association rules in transactional and relational databases,
spatial association rules can be mined in spatial databases.
• A spatial association rule is of the form of
𝐴 ⇒ 𝐵 𝑠%, 𝑐%
where
• 𝐴 and 𝐵 are sets of spatial or nonspatial predicates,
• 𝑠% is the support of the rule, and 𝑐% is the confidence of the rule.
• e.g. the following is a spatial association rules
𝒊𝒔_𝒂(𝑿, "𝑺𝒄𝒉𝒐𝒐𝒍") ∧ 𝒄𝒍𝒐𝒔𝒆_𝒕𝒐(𝑿, "𝒔𝒑𝒐𝒓𝒕_𝒄𝒆𝒏𝒕𝒆𝒓") ⇒ 𝒄𝒍𝒐𝒔𝒆_𝒕𝒐(𝑿, "𝒑𝒂𝒓𝒌") [𝟎. 𝟓%, 𝟖𝟎%]
• This rule states that 80% of schools that are close to sports centers are also close to parks, and 0.5% of
the data belongs to such a case.
By Mrs. Rashmi Bhat 27
Spatial Data Mining
28. Mining Spatial Associations
• Examples include distance information (such as 𝑐𝑙𝑜𝑠𝑒_𝑡𝑜 and 𝑓𝑎𝑟_𝑎𝑤𝑎𝑦), topological
relations (like 𝑖𝑛𝑡𝑒𝑟𝑠𝑒𝑐𝑡, 𝑜𝑣𝑒𝑟𝑙𝑎𝑝, and 𝑑𝑖𝑠𝑗𝑜𝑖𝑛𝑡), and spatial orientations (like 𝑙𝑒𝑓𝑡_𝑜𝑓 and
𝑤𝑒𝑠𝑡_𝑜𝑓).
• Spatial association mining needs to evaluate multiple spatial relationships among a
large number of spatial objects, the process could be quite costly.
• An interesting mining optimization method called progressive refinement can be
adopted in spatial association analysis.
• The method first mines large data sets roughly using a fast algorithm and then improves the
quality of mining in a pruned data set using a more expensive algorithm.
By Mrs. Rashmi Bhat 28
Spatial Data Mining
29. Mining Spatial Associations
• How to ensure the pruned data set covers the complete set of answers?
• an important requirement for the rough mining algorithm applied in the early stage is the
superset coverage property: that is, it preserves all of the potential answers.
• It should allow the false positive test, which might include some data sets that do not belong
to the answer sets
• It should not allow a false-negative test, which might exclude some potential answers.
• e.g. For mining spatial associations related to the spatial predicate close_to, collect
the candidates that pass the minimum support threshold by
• Applying certain rough spatial evaluation algorithms
• Evaluating the relaxed spatial predicate, g_close_to, which is a generalized close_to covering a
broader context that includes close_to, touch, and intersect.
By Mrs. Rashmi Bhat 29
Spatial Data Mining
30. Mining Spatial Associations
• If two spatial objects are closely located, their enclosing MBRs must be closely located,
matching g_close_to.
• The reverse is not always true: if the enclosing MBRs are closely located, the two spatial
objects may or may not be located so closely.
• The MBR pruning is a false-positive testing tool for closeness.
• Spatial Co-location Mining
• Identifying groups of particular features that appear frequently close to each other in a
geospatial map.
• Finding spatial co-locations can be considered as a special case of mining spatial associations.
• Based on the property of spatial autocorrelation, interesting features likely to coexist in closely
located regions.
By Mrs. Rashmi Bhat 30
Spatial Data Mining
31. Spatial Clustering
• Spatial data clustering identifies clusters, or densely populated regions, according
to some distance measurement in a large, multidimensional data set.
• Spatial clustering is a process of grouping a set of spatial objects into clusters so
that objects within a cluster have high similarity in comparison to one another, but
are dissimilar to objects in other clusters.
• e.g. Hot spot analysis in crime analysis and disease tracking
By Mrs. Rashmi Bhat 31
Spatial Data Mining
33. Spatial Clustering
• CLARANS (Clustering Large Applications based upon RANdomized Search)
• Combines the sampling technique (CLARA) with PAM
• Aims to use randomized search to facilitate the clustering of a large number of objects
• CLARANS draws a sample with some randomness in each step of the search.
• This clustering process can be viewed as a search through a graph, where each node is a
potential solution (a set of k-medoids).
• Two nodes are neighbors (connected by an arc in the graph) if their sets differ by only one
object.
• Each node can be assigned a cost that is defined by the total dissimilarity between every object
and the medoid of its cluster.
• At each step, PAM examines all of the neighbors of the current node in its search for a
minimum cost solution.
• The current node is then replaced by the neighbor with the largest descent in costs.
By Mrs. Rashmi Bhat 33
Spatial Data Mining
34. Spatial Clustering
• CLARANS (Clustering Large Applications based upon RANdomized Search)
• CLARANS dynamically draws a random sample of neighbors in each step of a search.
• The number of neighbors to be randomly sampled is restricted by a userspecified parameter.
• If a better neighbor is found (i.e., having a lower error), CLARANS moves to the neighbor’s
node and the process starts again; otherwise, the current clustering produces a local minimum.
• If a local minimum is found, CLARANS starts with new randomly selected nodes in search
for a new local minimum.
• Once a user-specified number of local minima has been found, the algorithm outputs, as a
solution, the best local minimum, that is, the local minimum having the lowest cost.
• CLARANS also enables the detection of outliers
• The computational complexity of CLARANS is about 𝑂(𝑛2
)
By Mrs. Rashmi Bhat 34
Spatial Data Mining