Downloaded 154 times


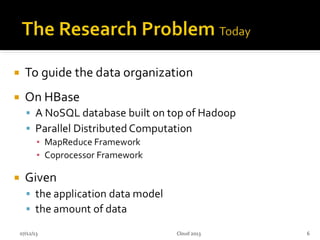
![ [1] built a multi-dimensional index layer on top of a one-
dimensional key-value store HBase to perform spatial queries.
[2] presented a novel key formulation schema, based on R+-tree
for spatial index in HBase.
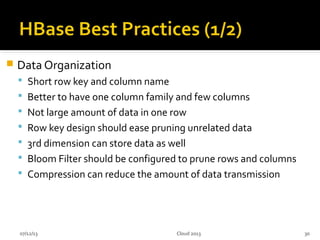
Focus on row-key design
no discussion about column and version design
07/12/13 11
[1] Shoji Nishimura, Sudipto Das, Divyakant Agrawal, Amr El Abbadi: MD-HBase: A
Scalable Multi-dimensional Data Infrastructure for Location Aware Services. Mobile
Data Management (1) 2011: 7-16
[2] Ya-Ting Hsu, Yi-Chin Pan, Ling-Yin Wei, Wen-Chih Peng, Wang-Chien Lee: Key
Formulation Schemes for Spatial Index in Cloud Data Managements. MDM 2012: 21-26
Cloud 2013](https://image.slidesharecdn.com/cloud2013-130712154506-phpapp01/85/HGrid-A-Data-Model-for-Large-Geospatial-Data-Sets-in-HBase-10-320.jpg)
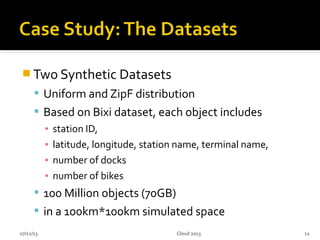
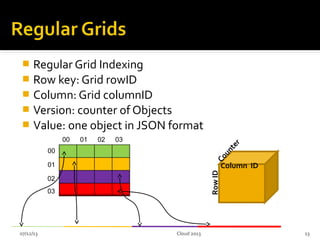
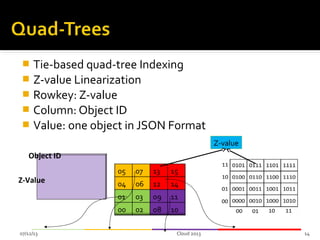
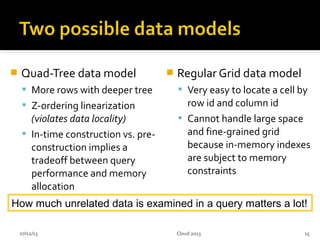
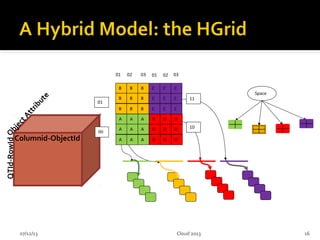
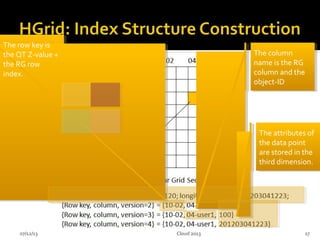
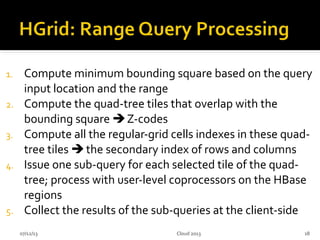
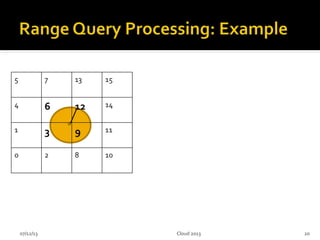
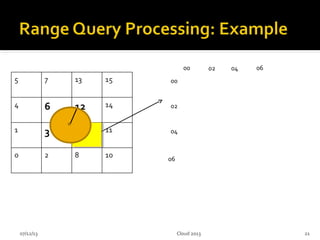
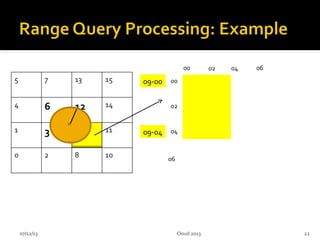
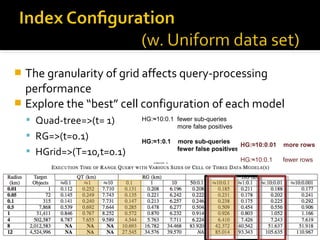
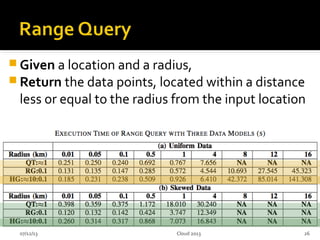
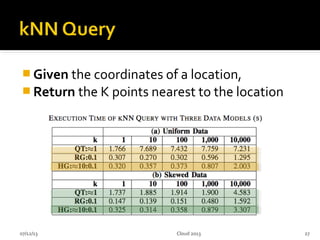
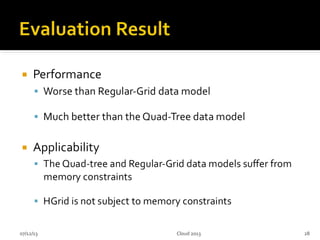


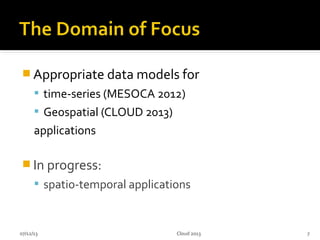
This document summarizes research on geospatial data modeling and query performance in HBase. It describes two data models tested: a regular grid index and a tie-based quadtree index. For the grid index, objects are stored by grid cell row and column keys. For the quadtree, objects are stored by Z-value row keys and object IDs. The document analyzes the tradeoffs of each approach and presents experiments comparing their query performance. It concludes with lessons learned on data organization, query processing, and directions for future work.


![[FOSS4G KOREA 2014]Hadoop 상에서 MapReduce를 이용한 Spatial Big Data 집계와 시스템 구축](https://cdn.slidesharecdn.com/ss_thumbnails/foss4g2014hadoop-geohash-v02-140829035316-phpapp02-thumbnail.jpg?width=640&height=640&fit=bounds)


![Getting Started with Apache Spark: Big Data Made Simple [Free Meetup]](https://cdn.slidesharecdn.com/ss_thumbnails/apachesparkgettingstarted-260203175547-8361bcc3-thumbnail.jpg?width=640&height=640&fit=bounds)


