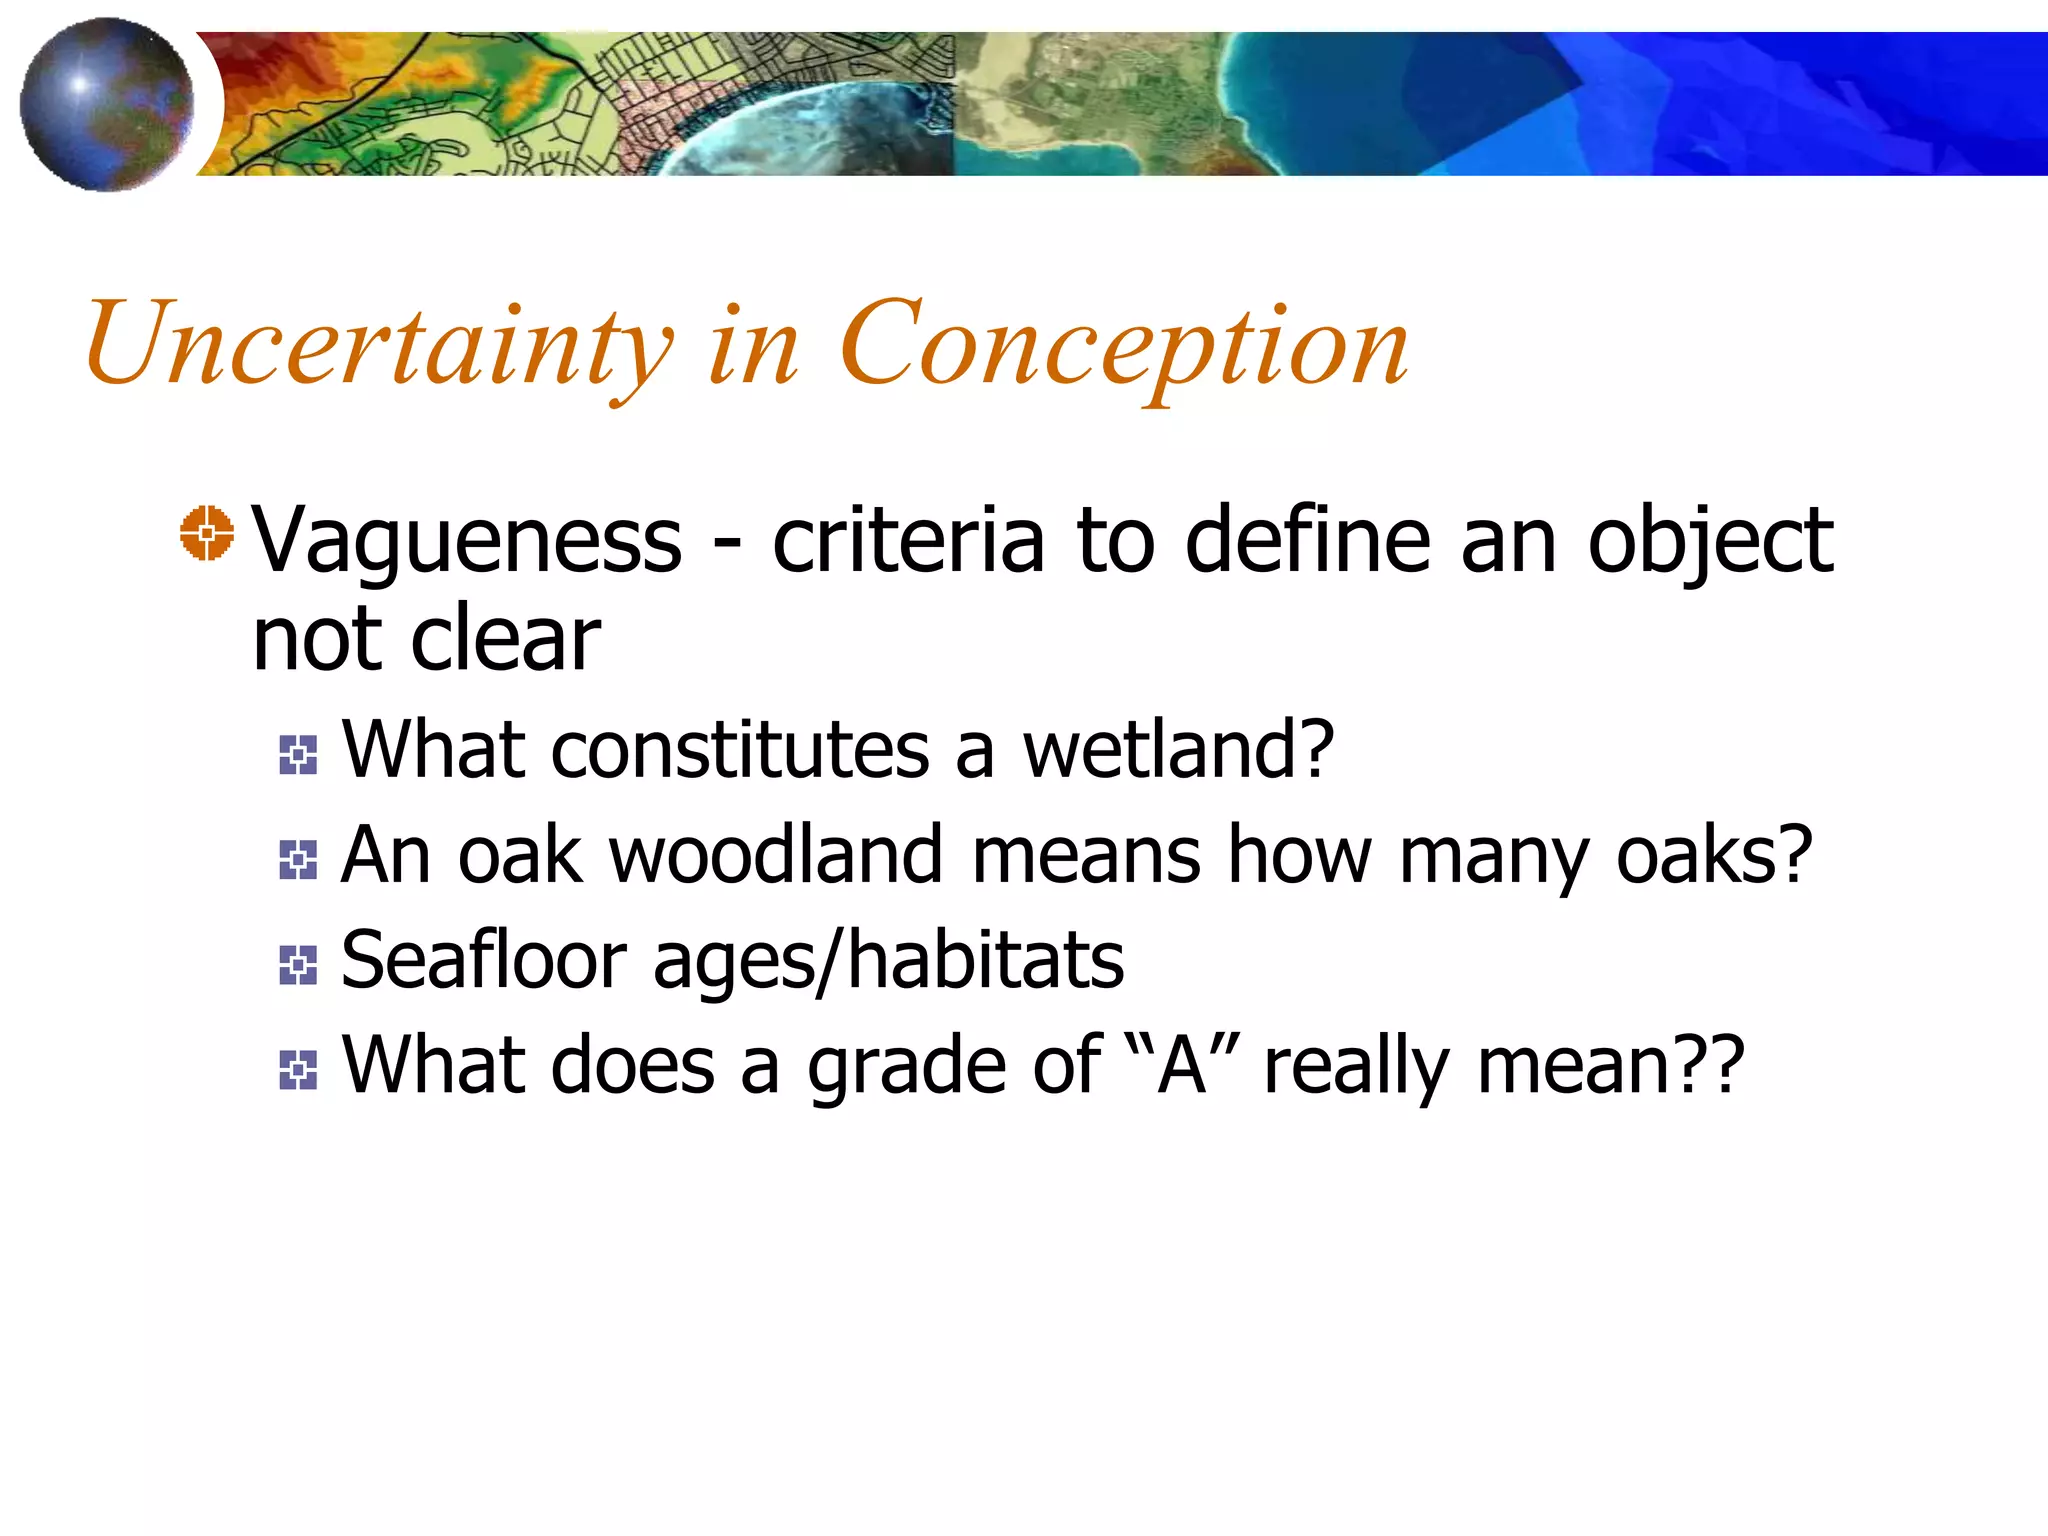
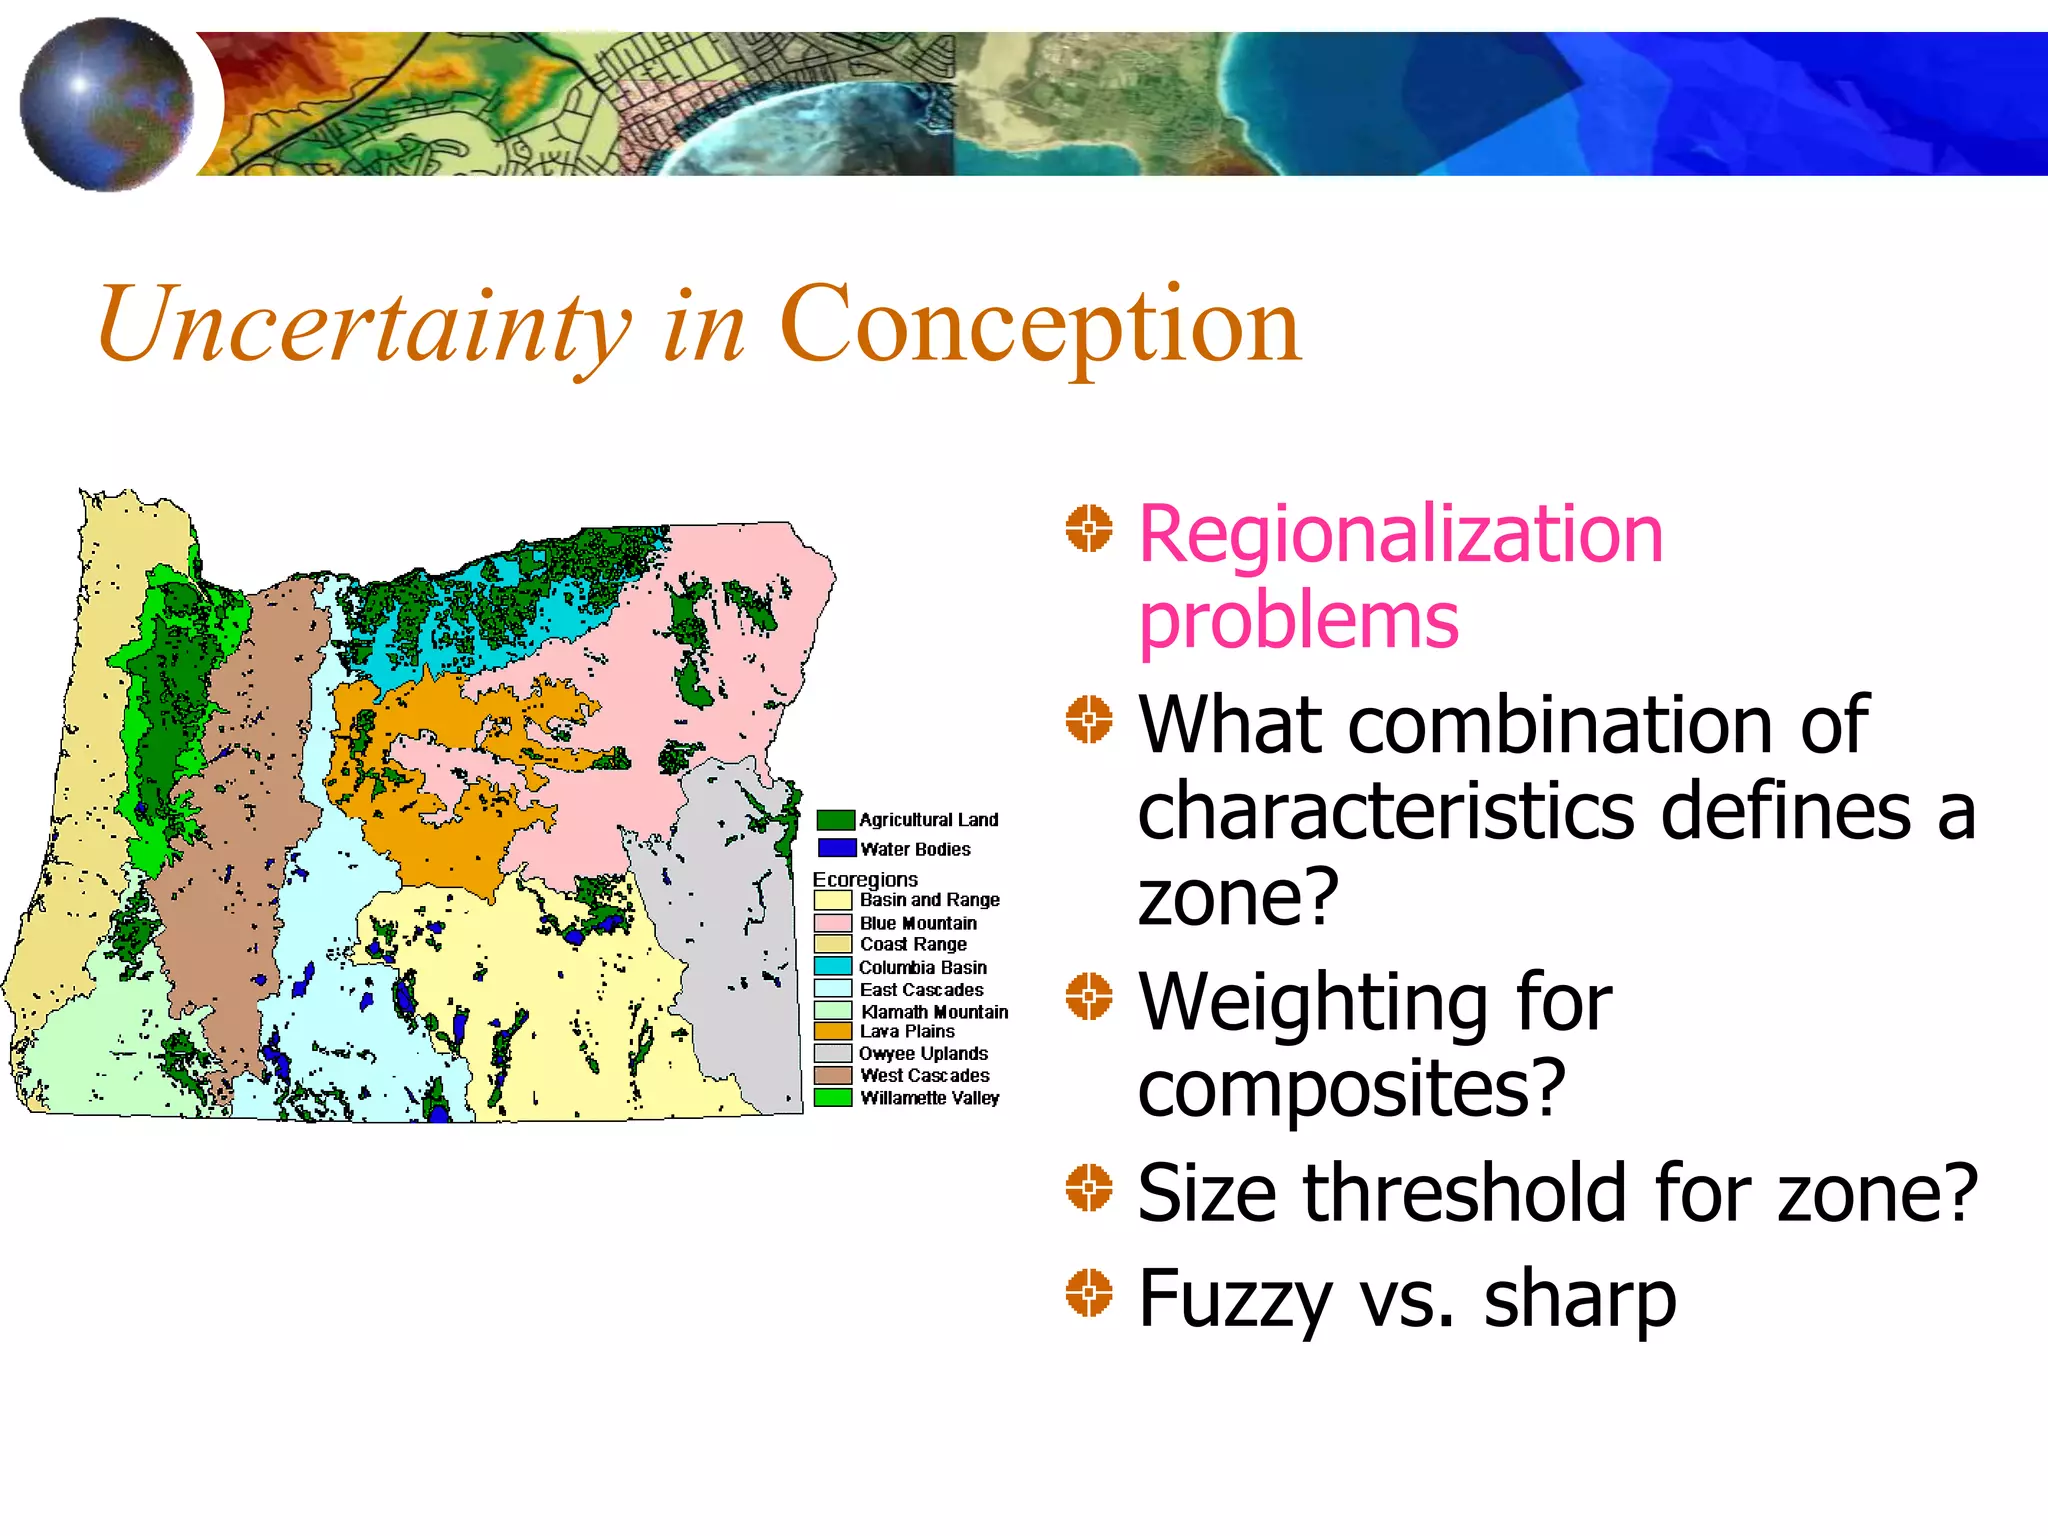
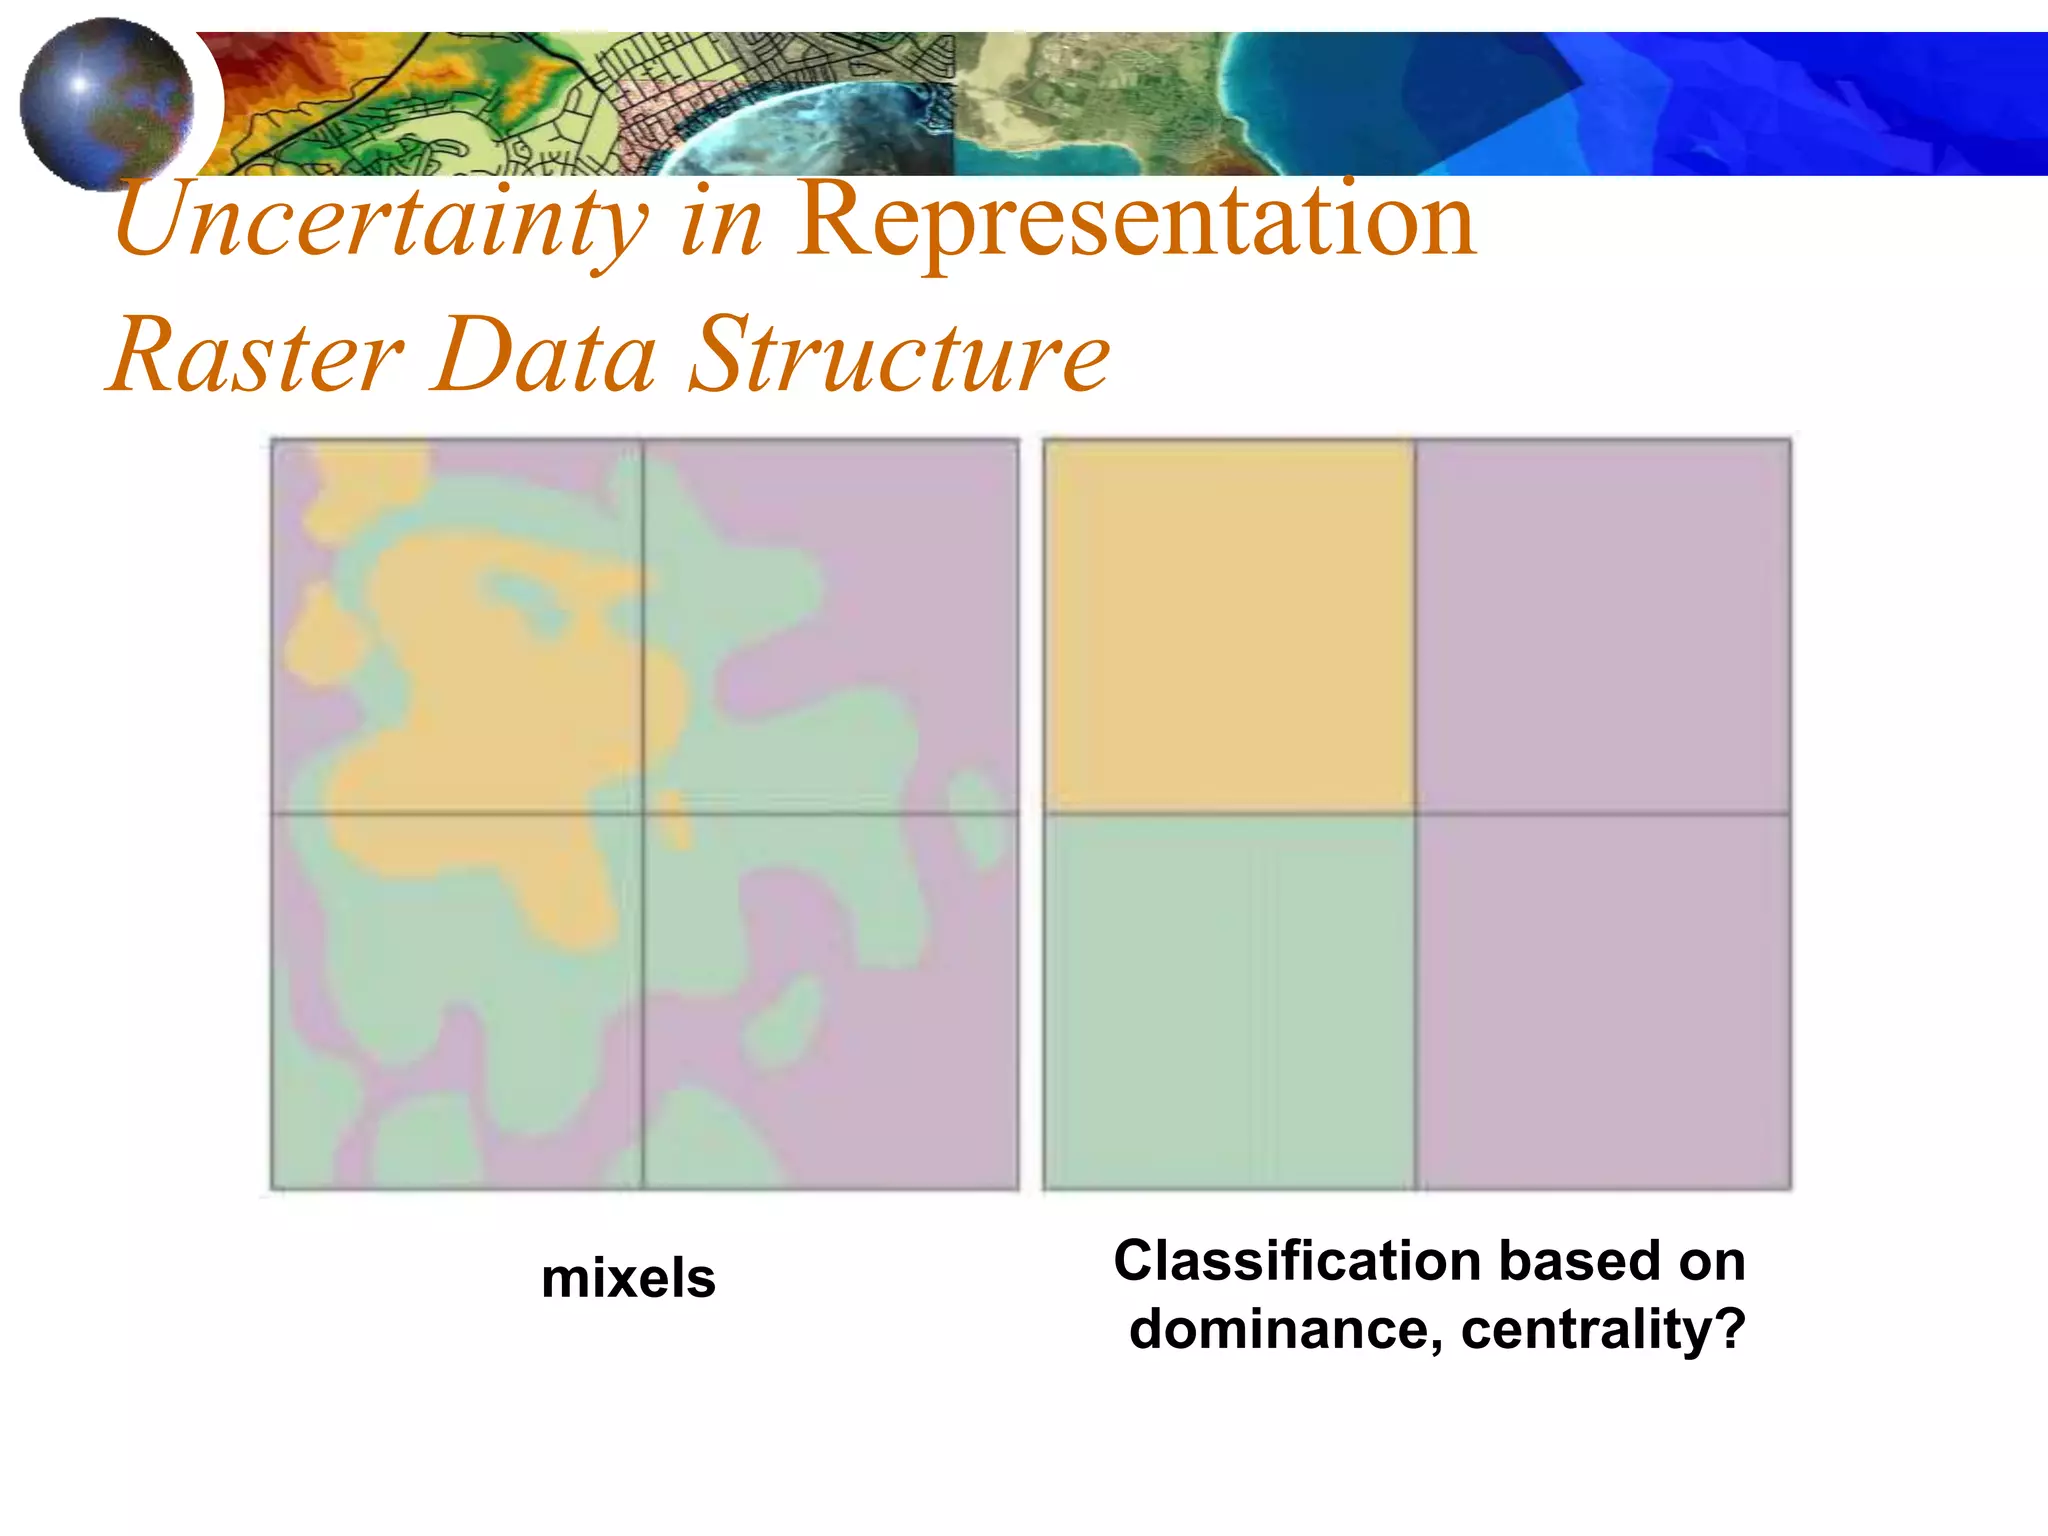
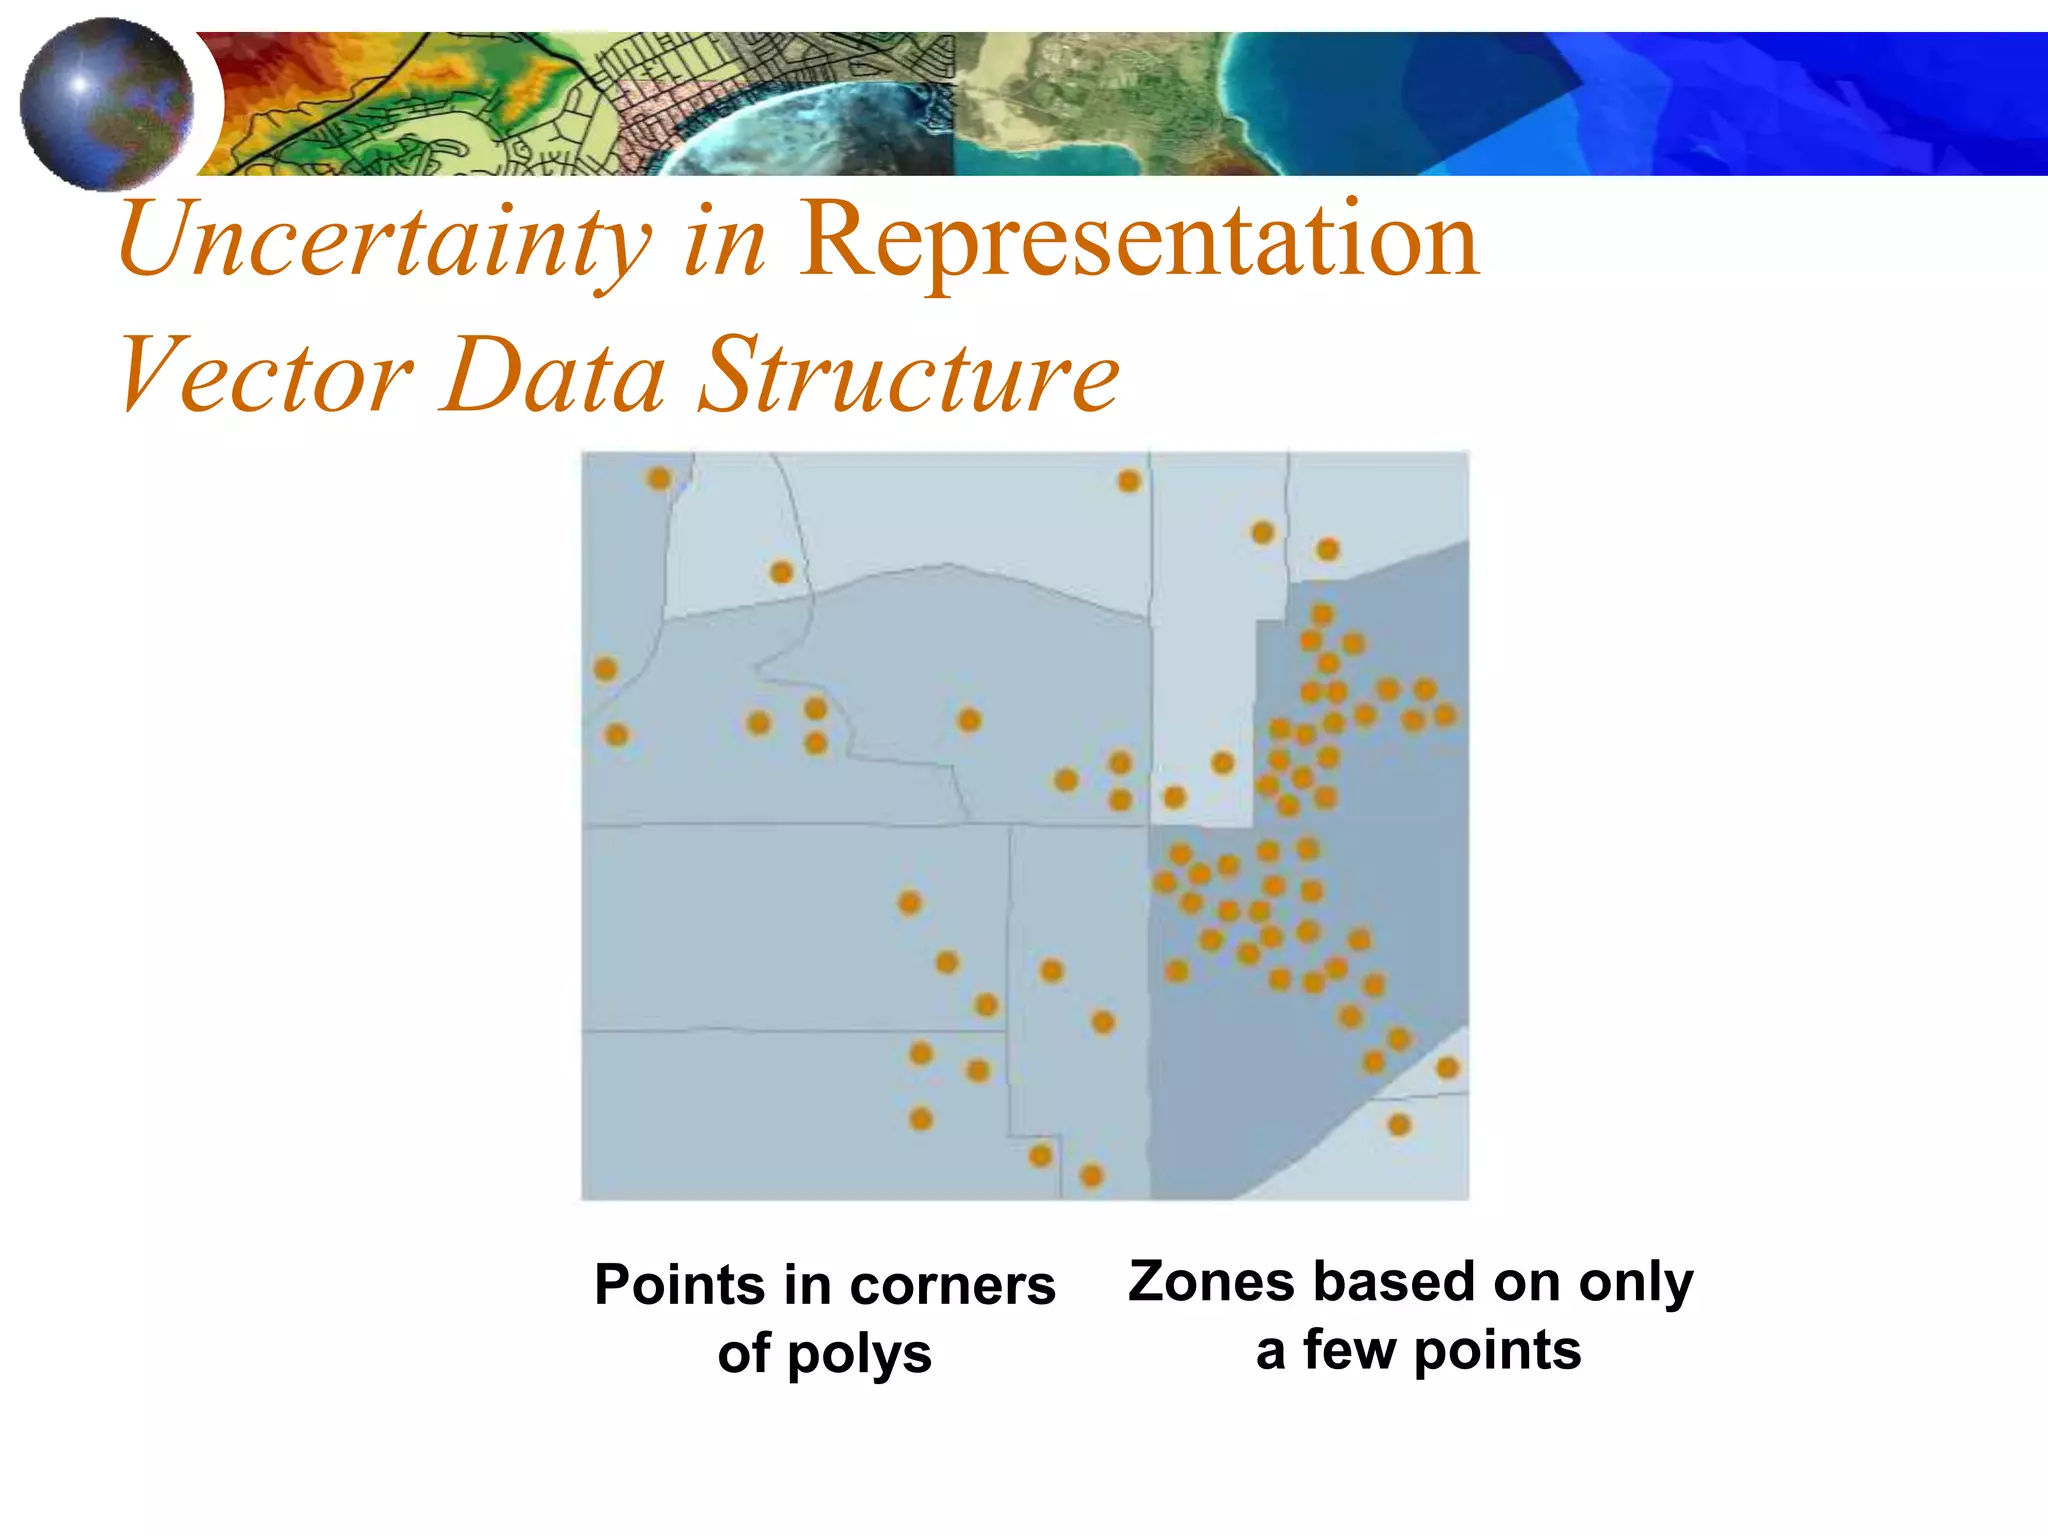
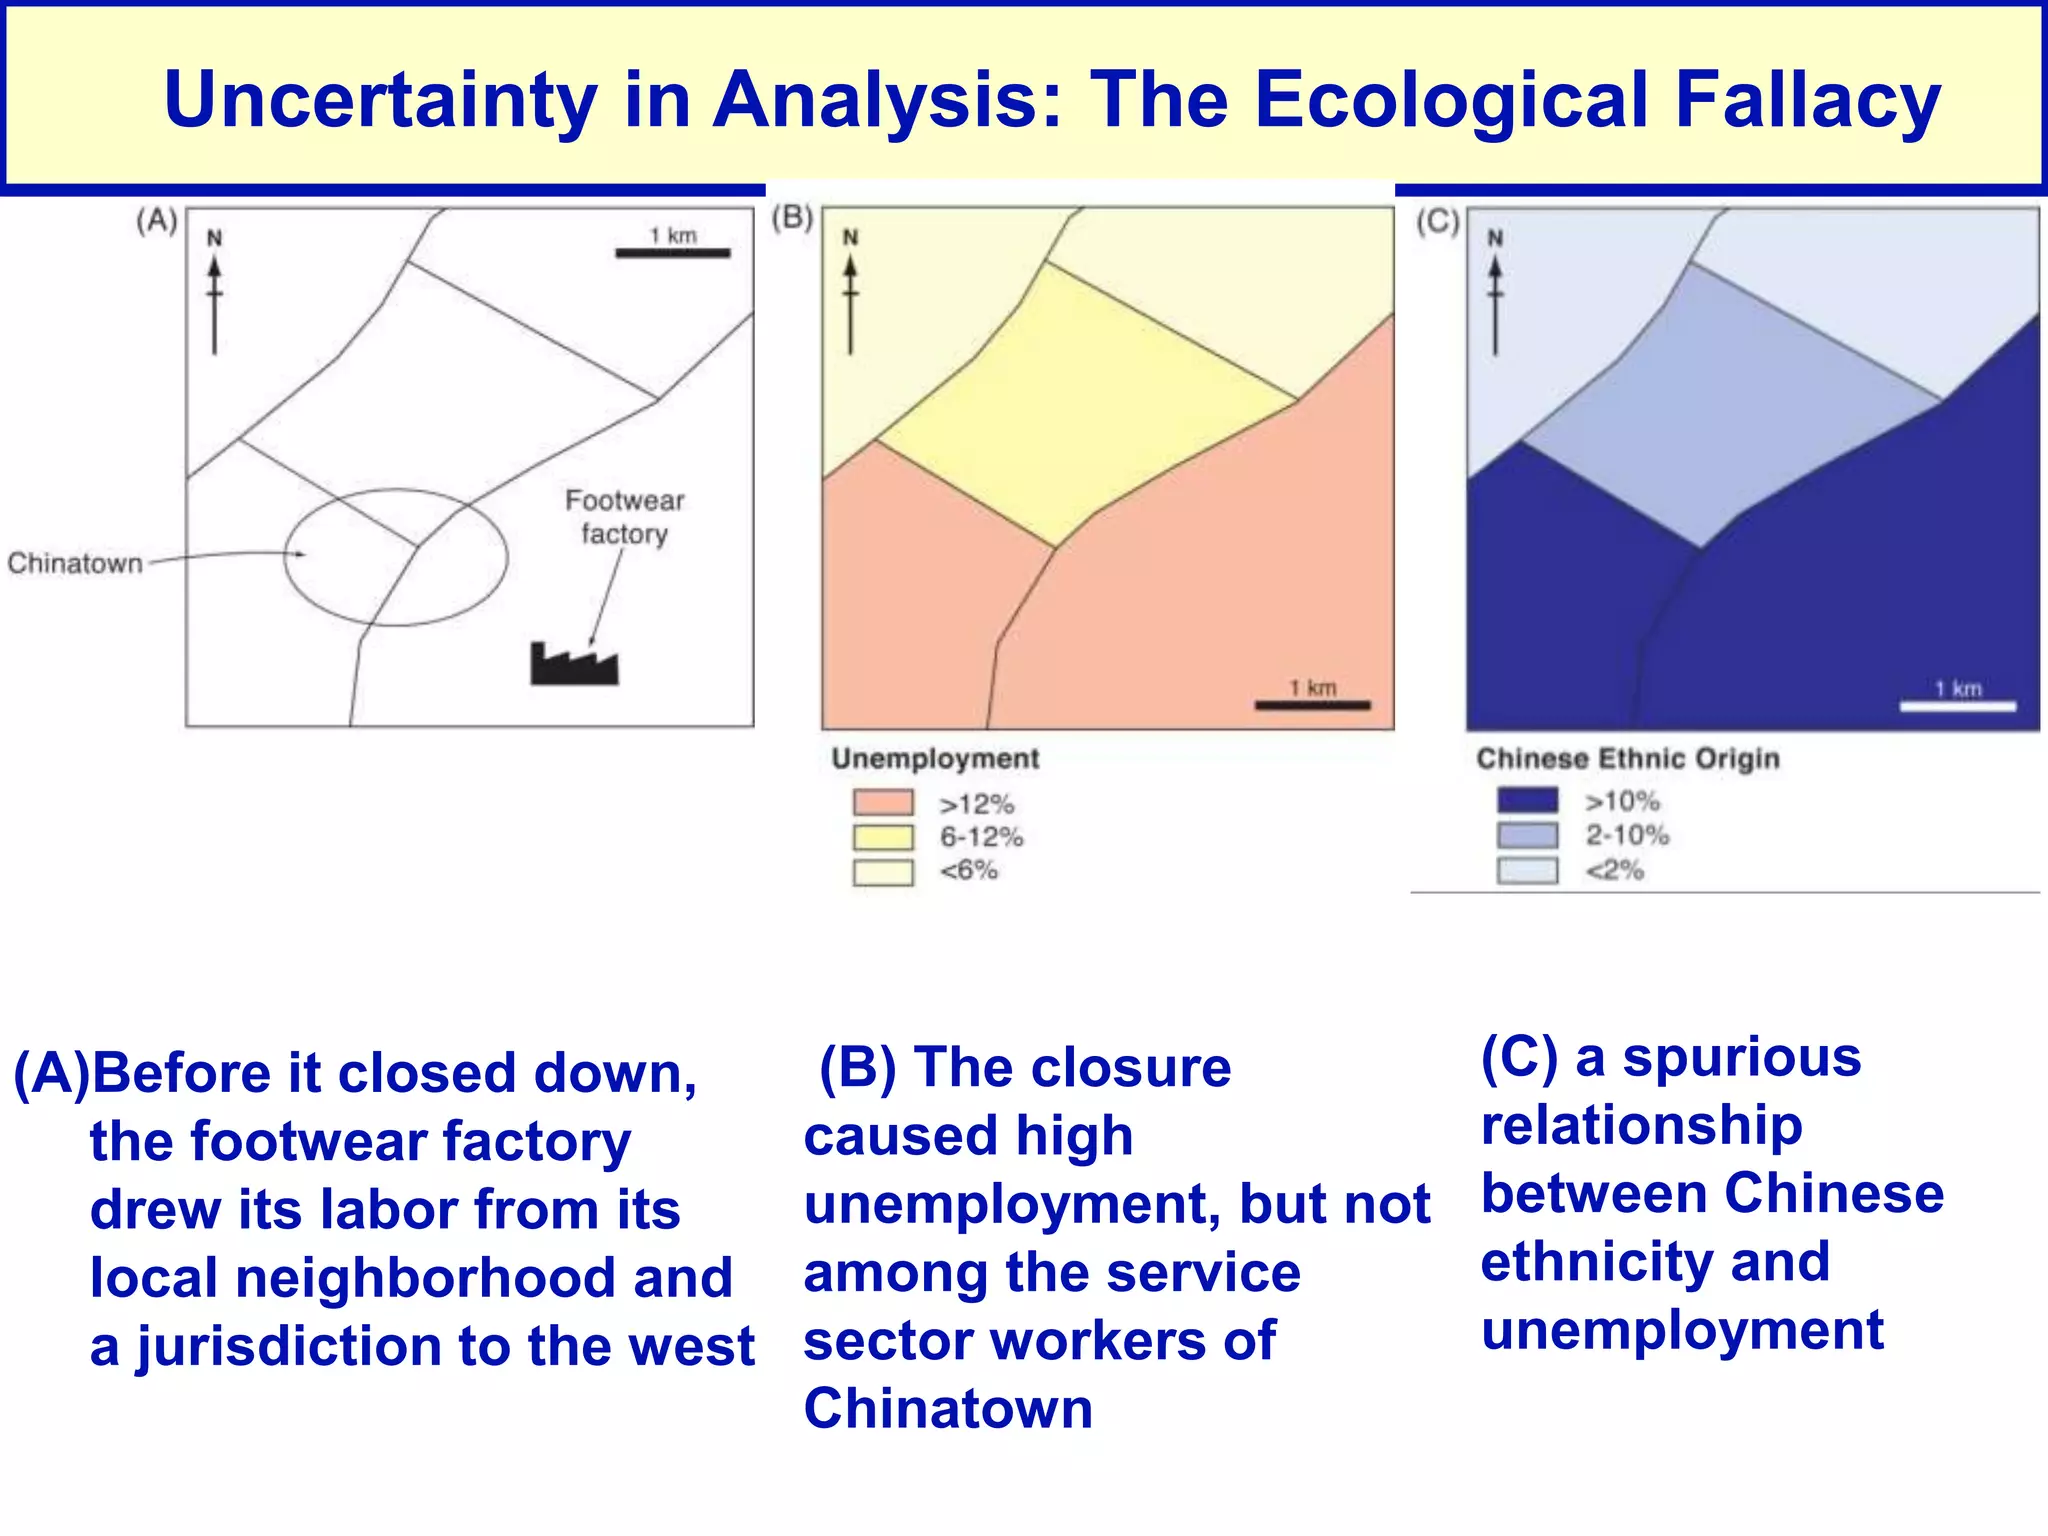
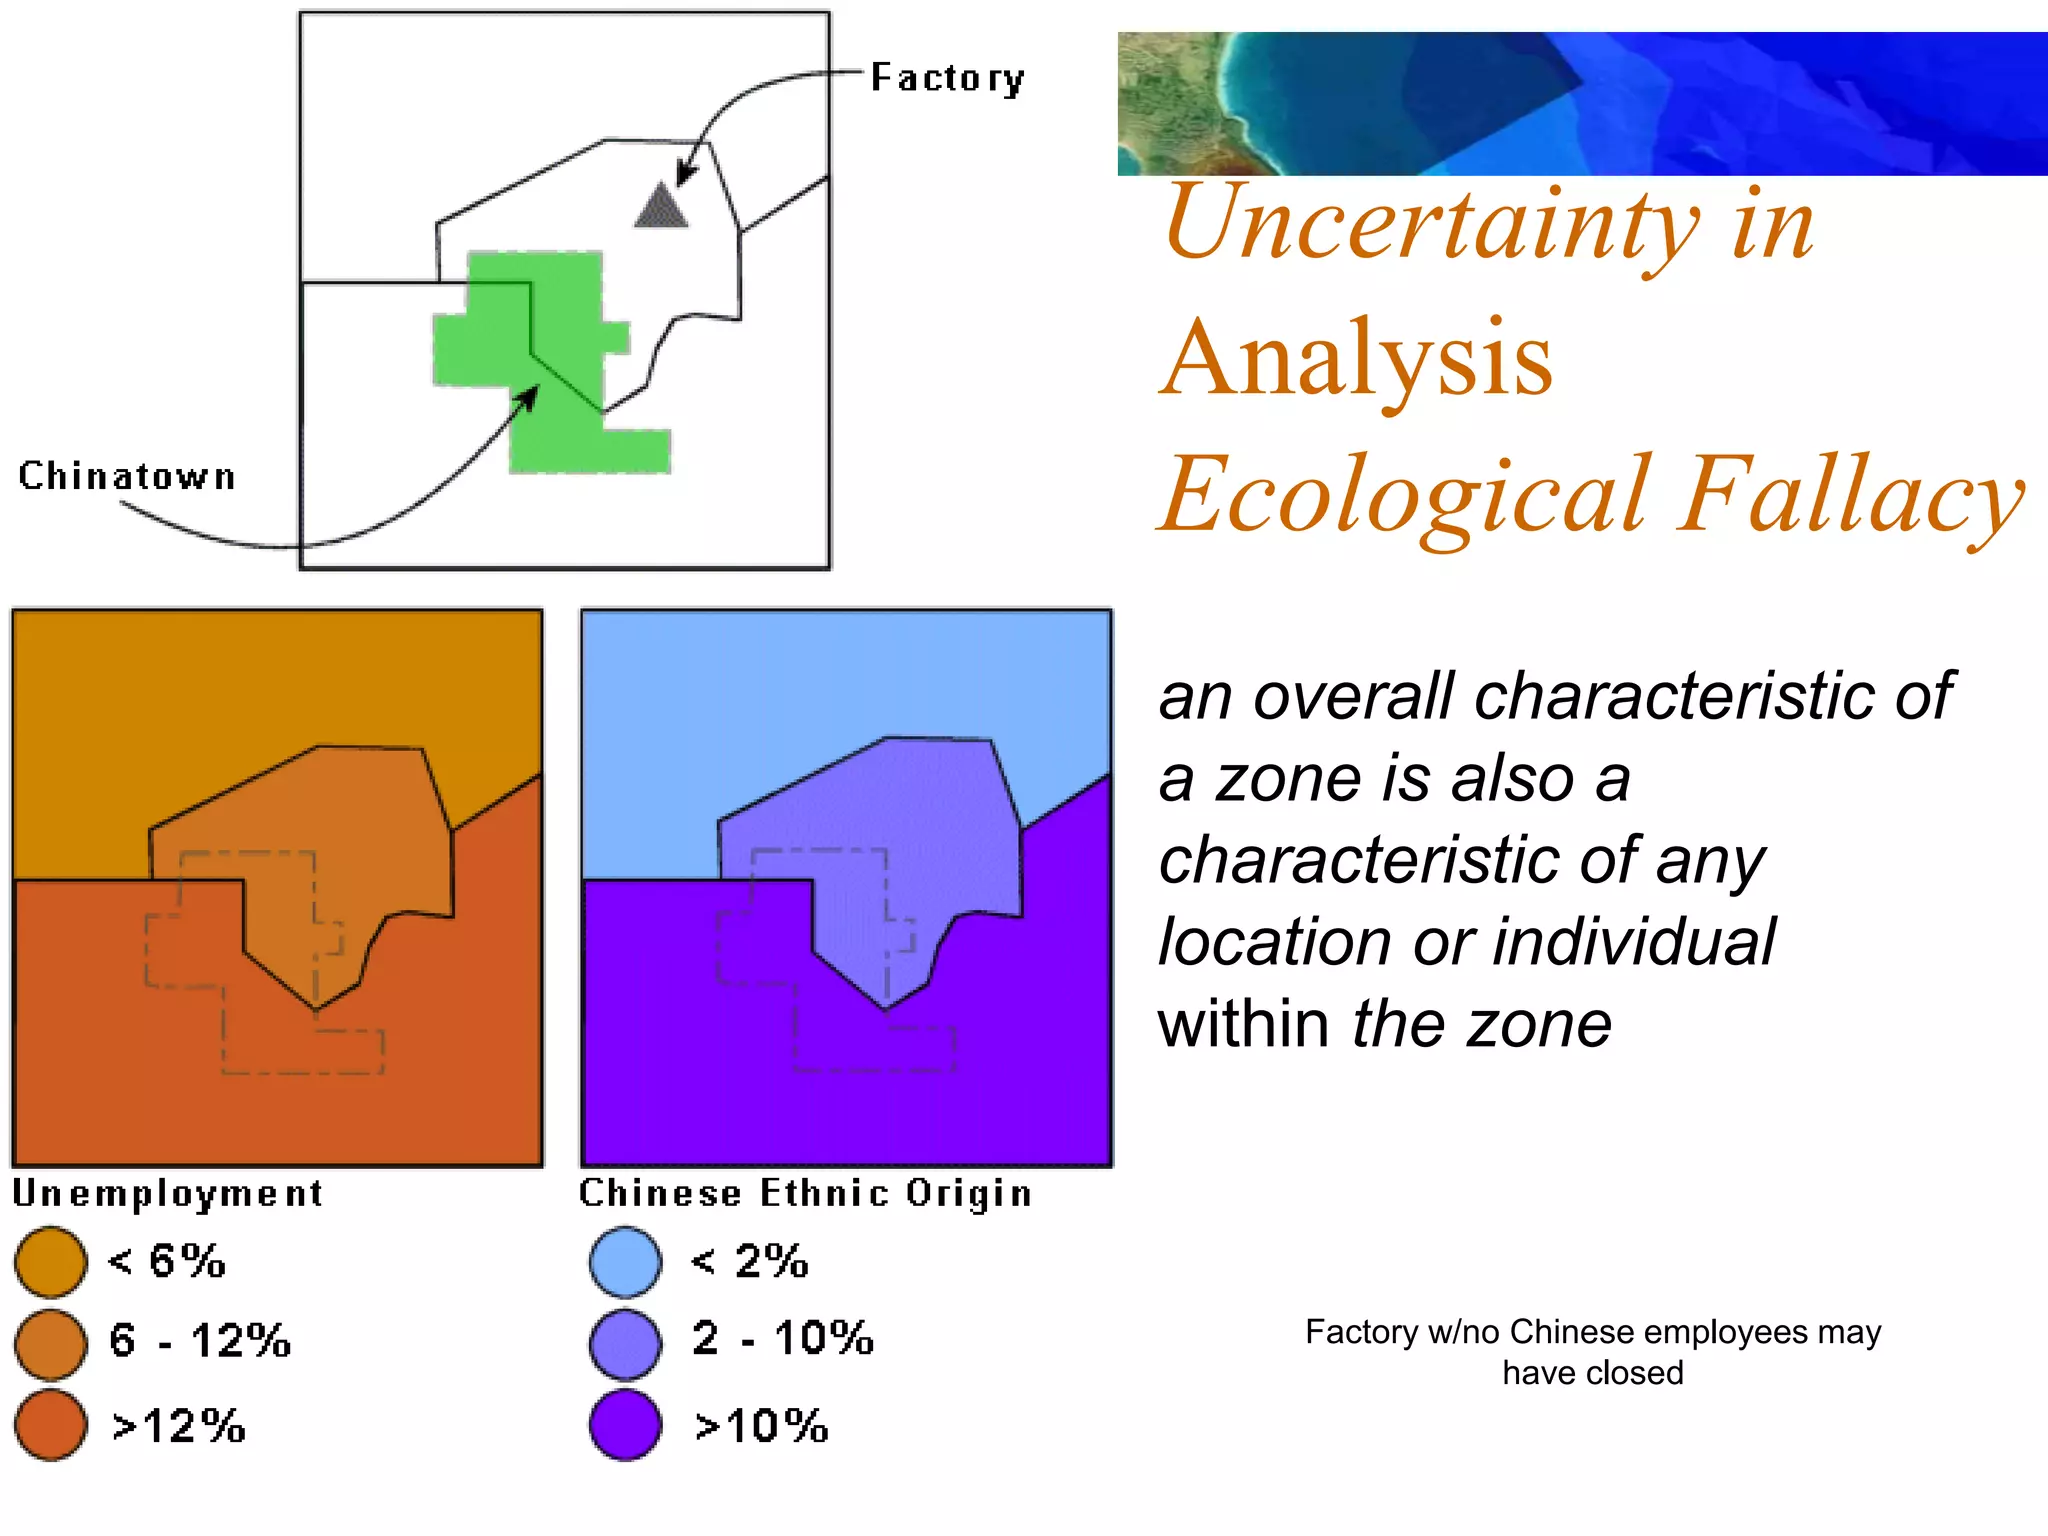
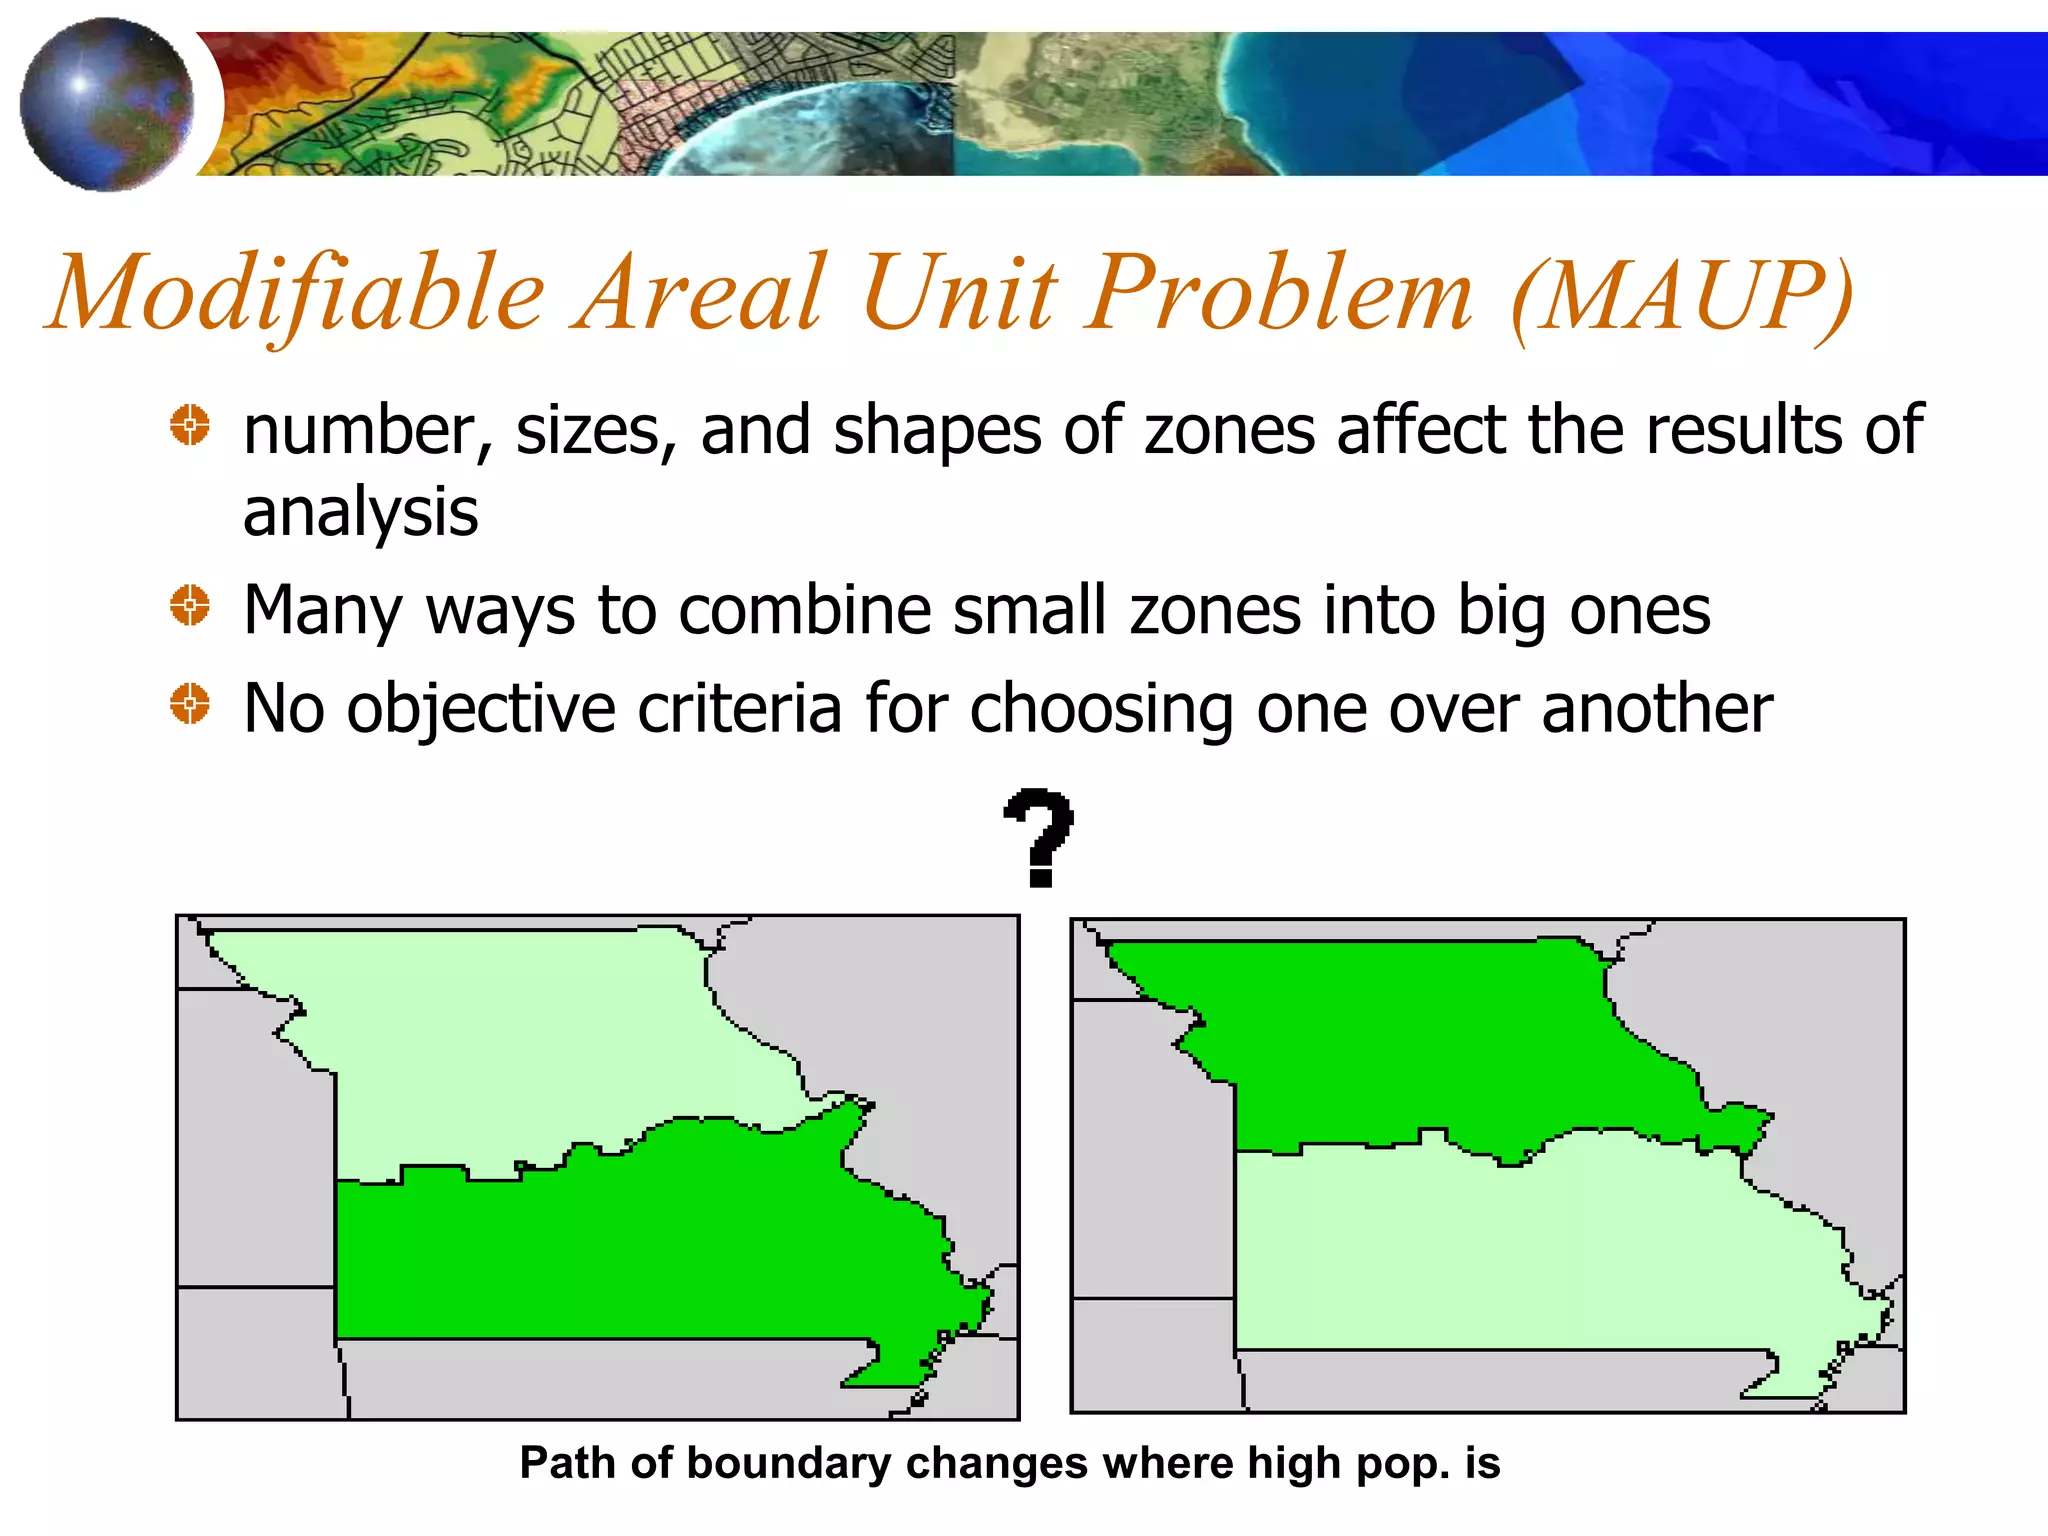
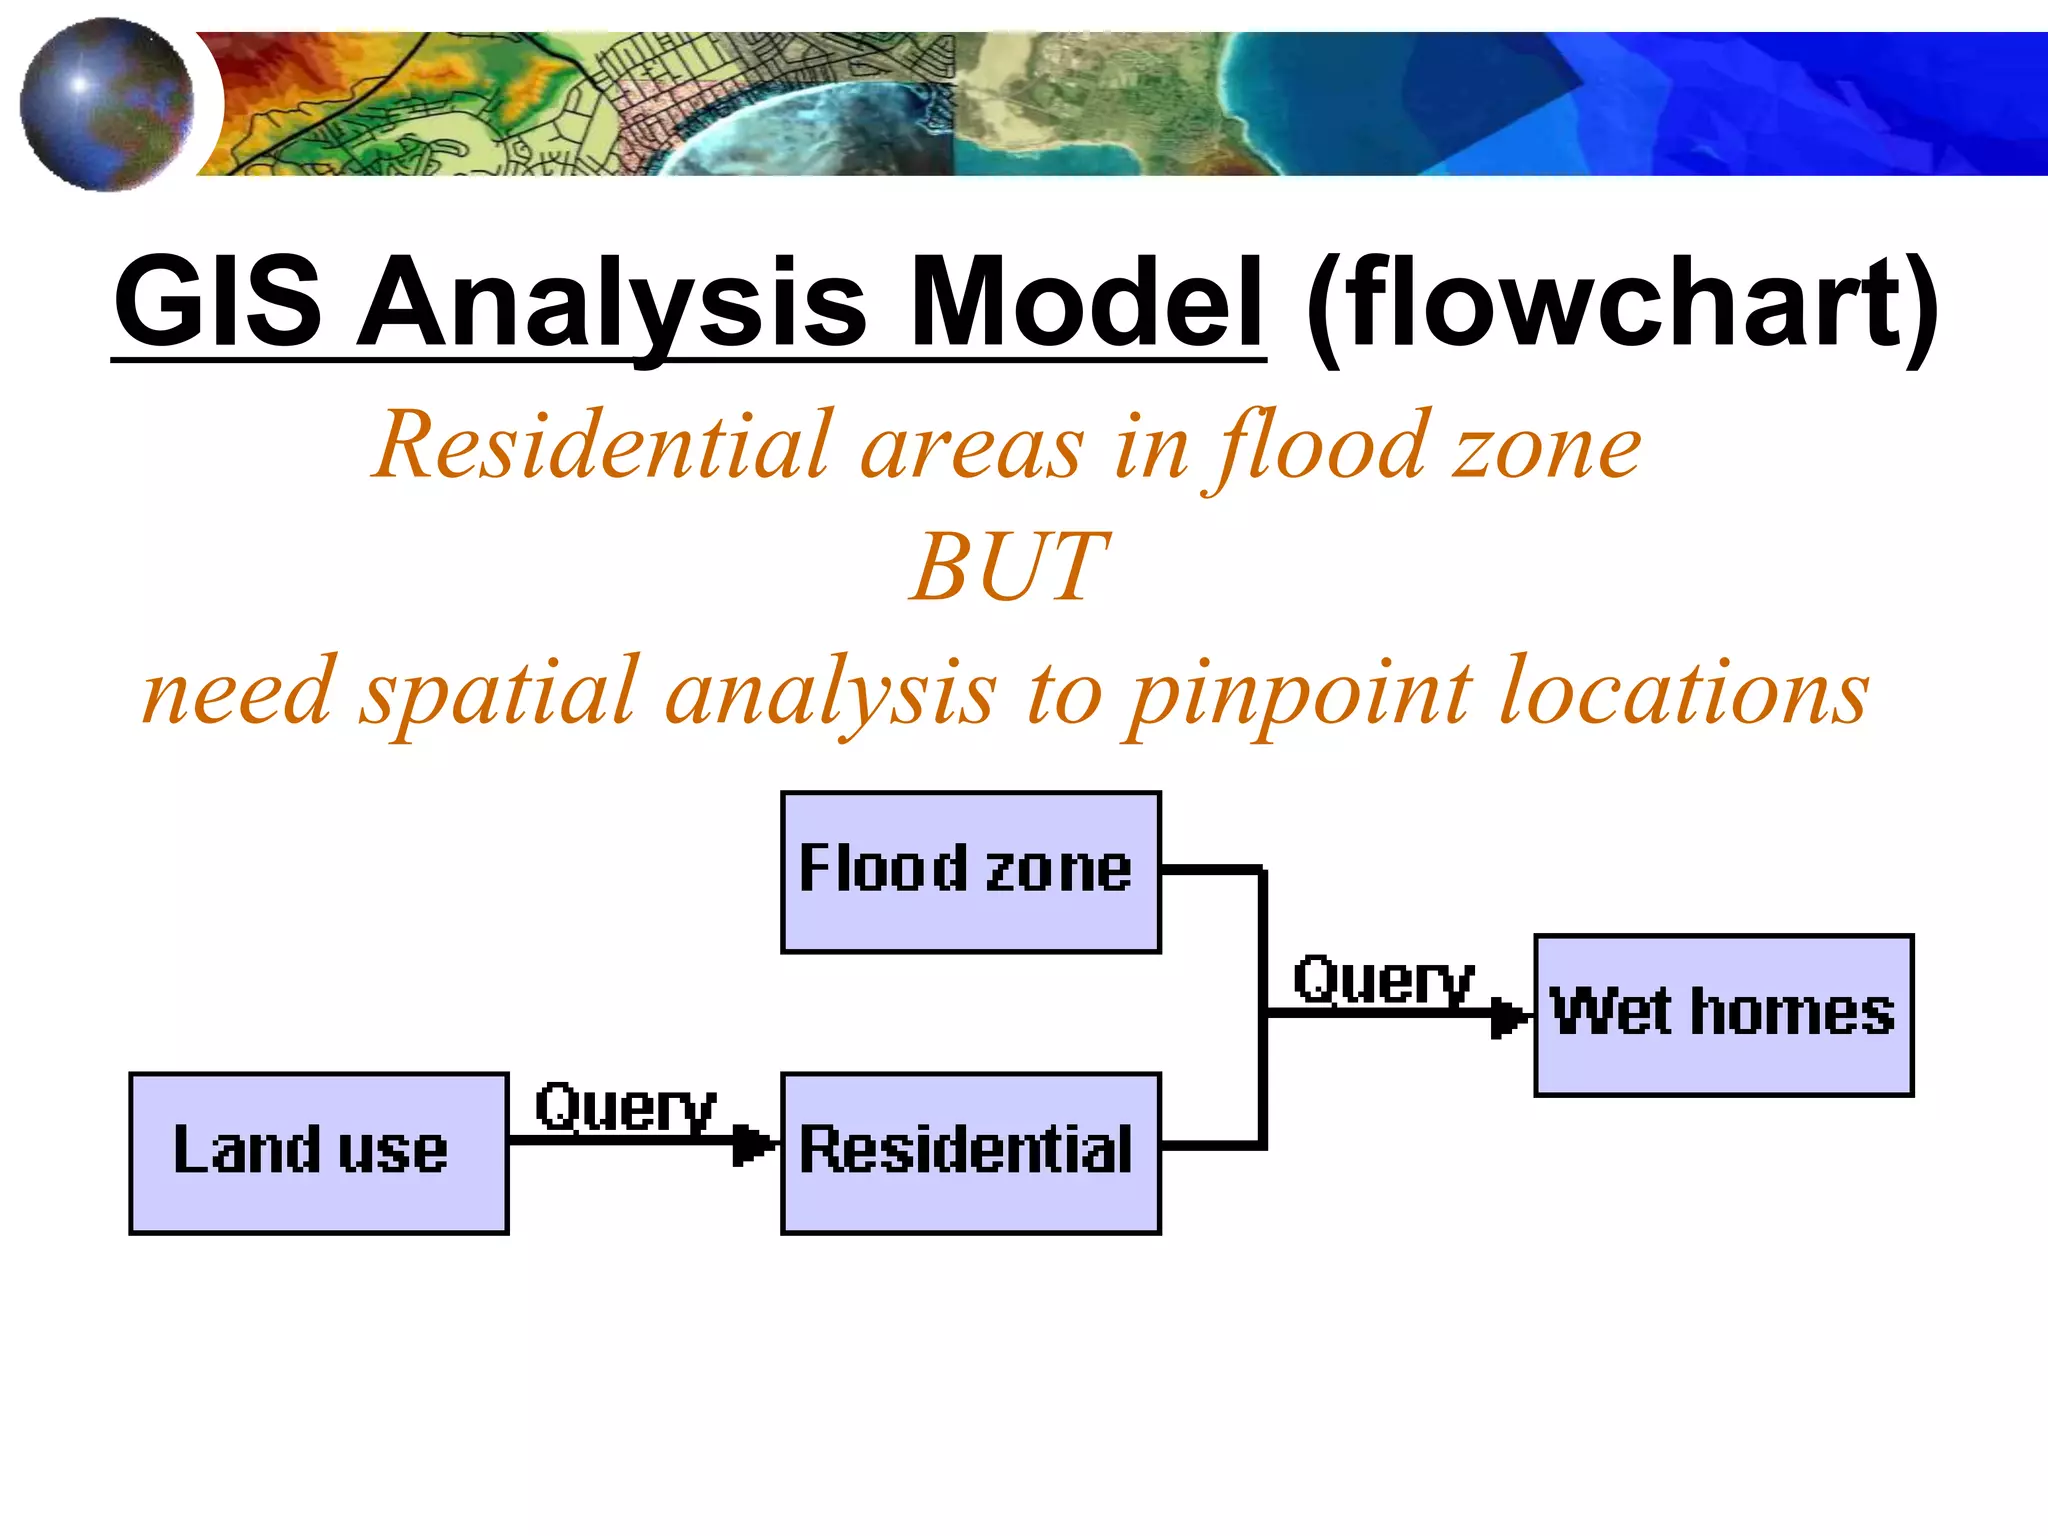
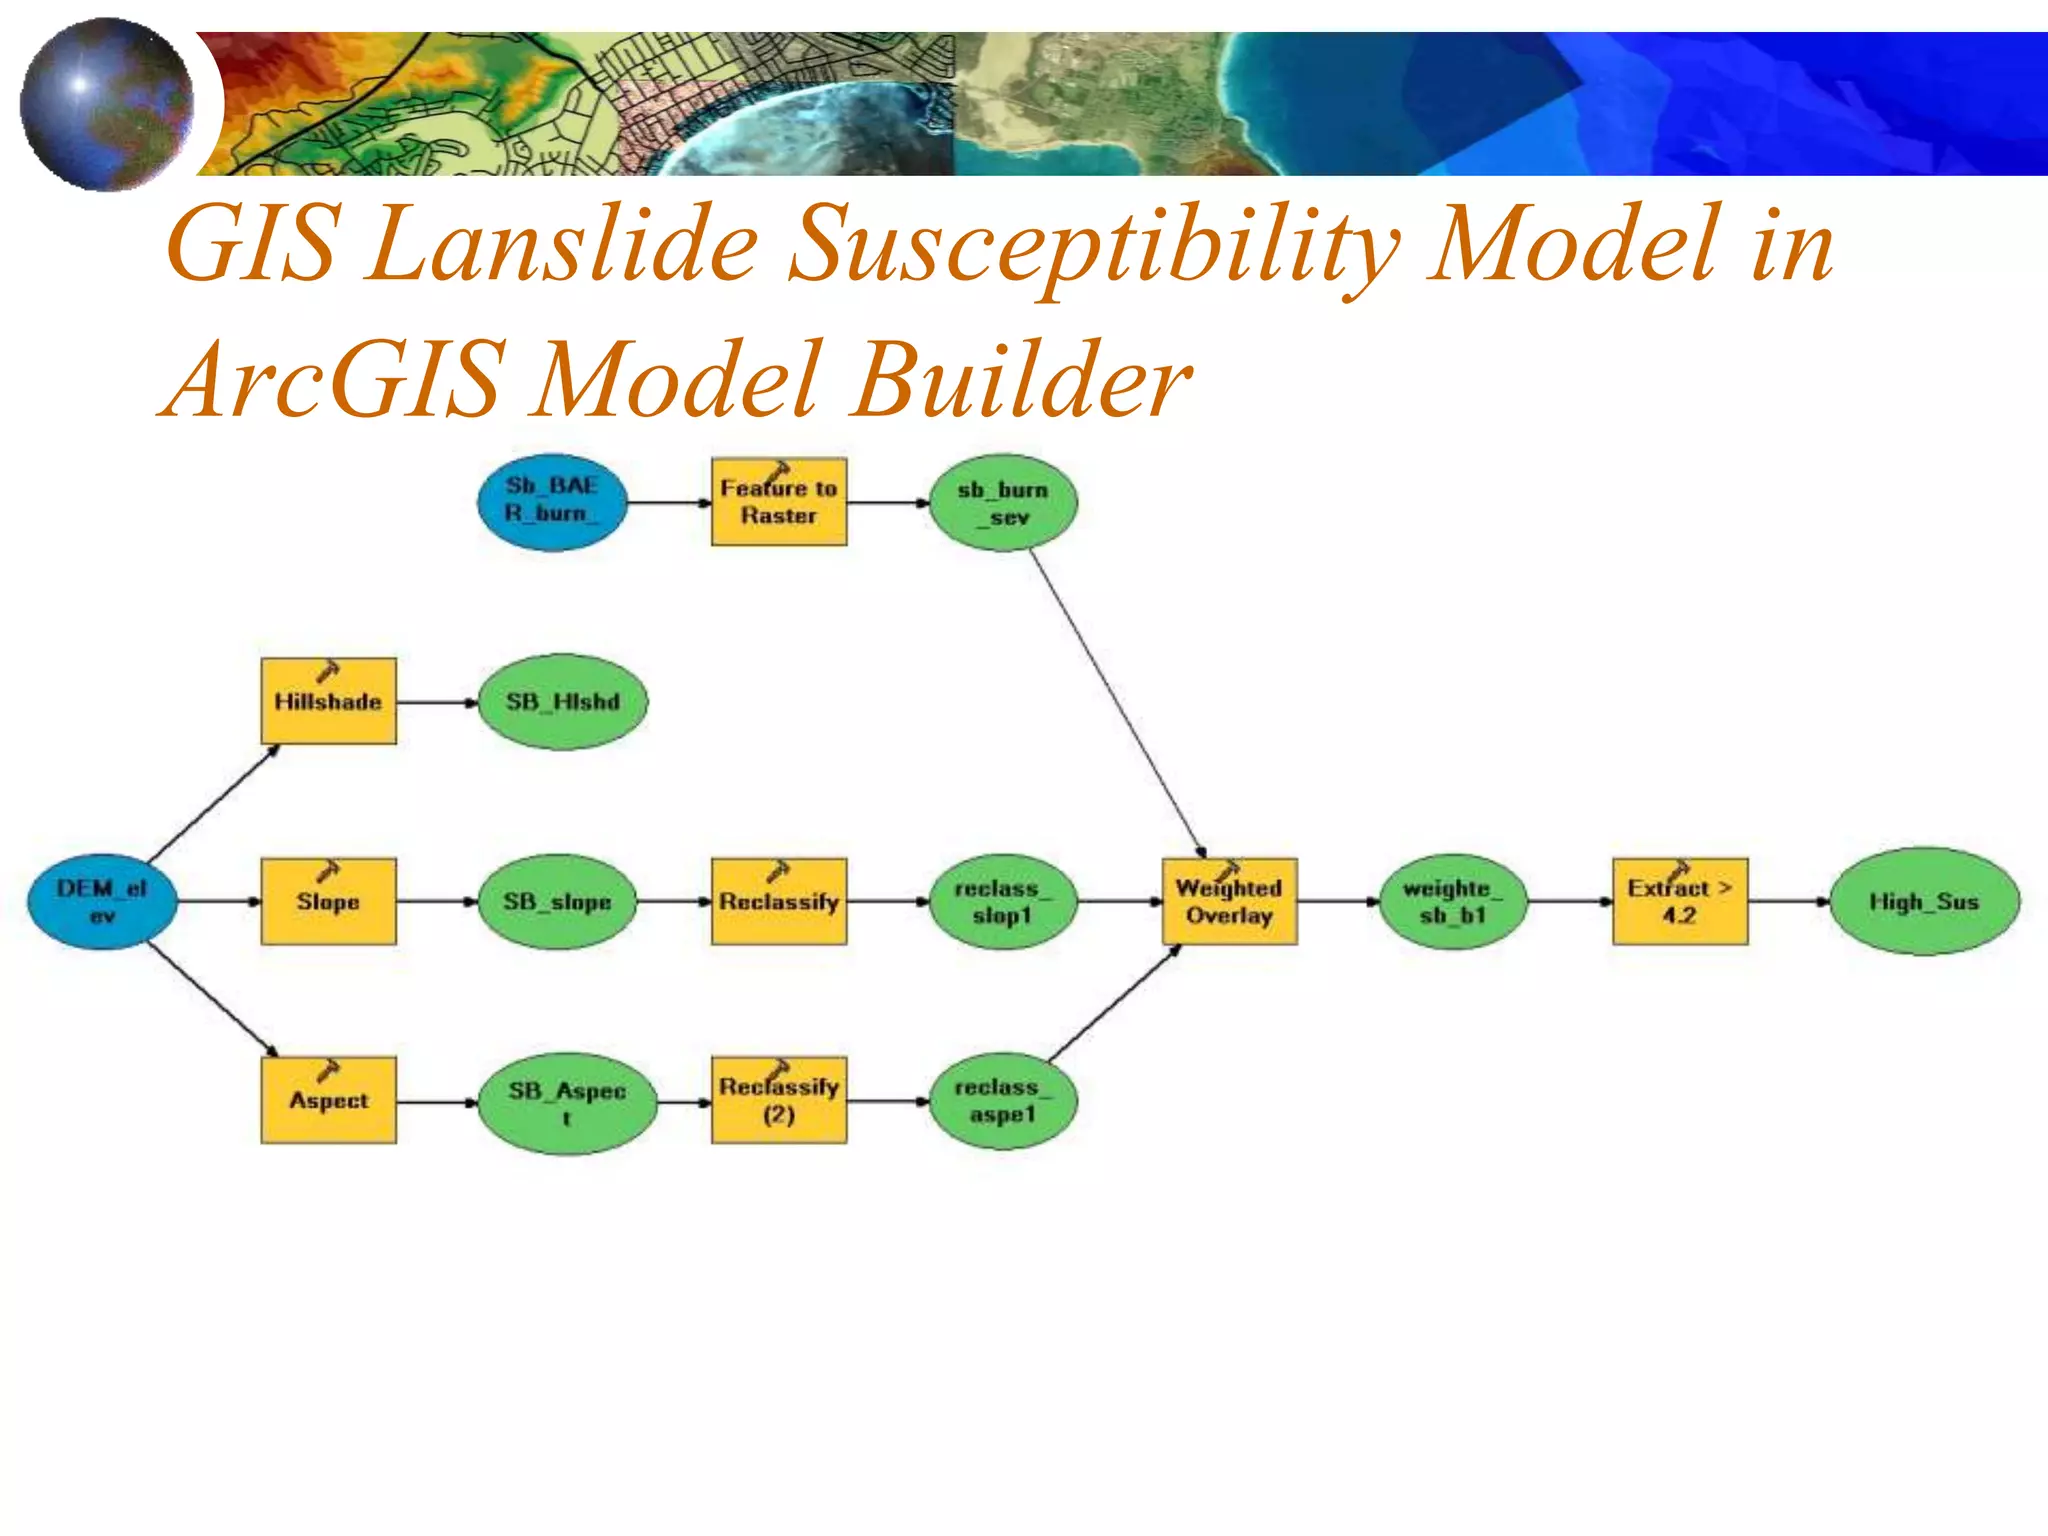
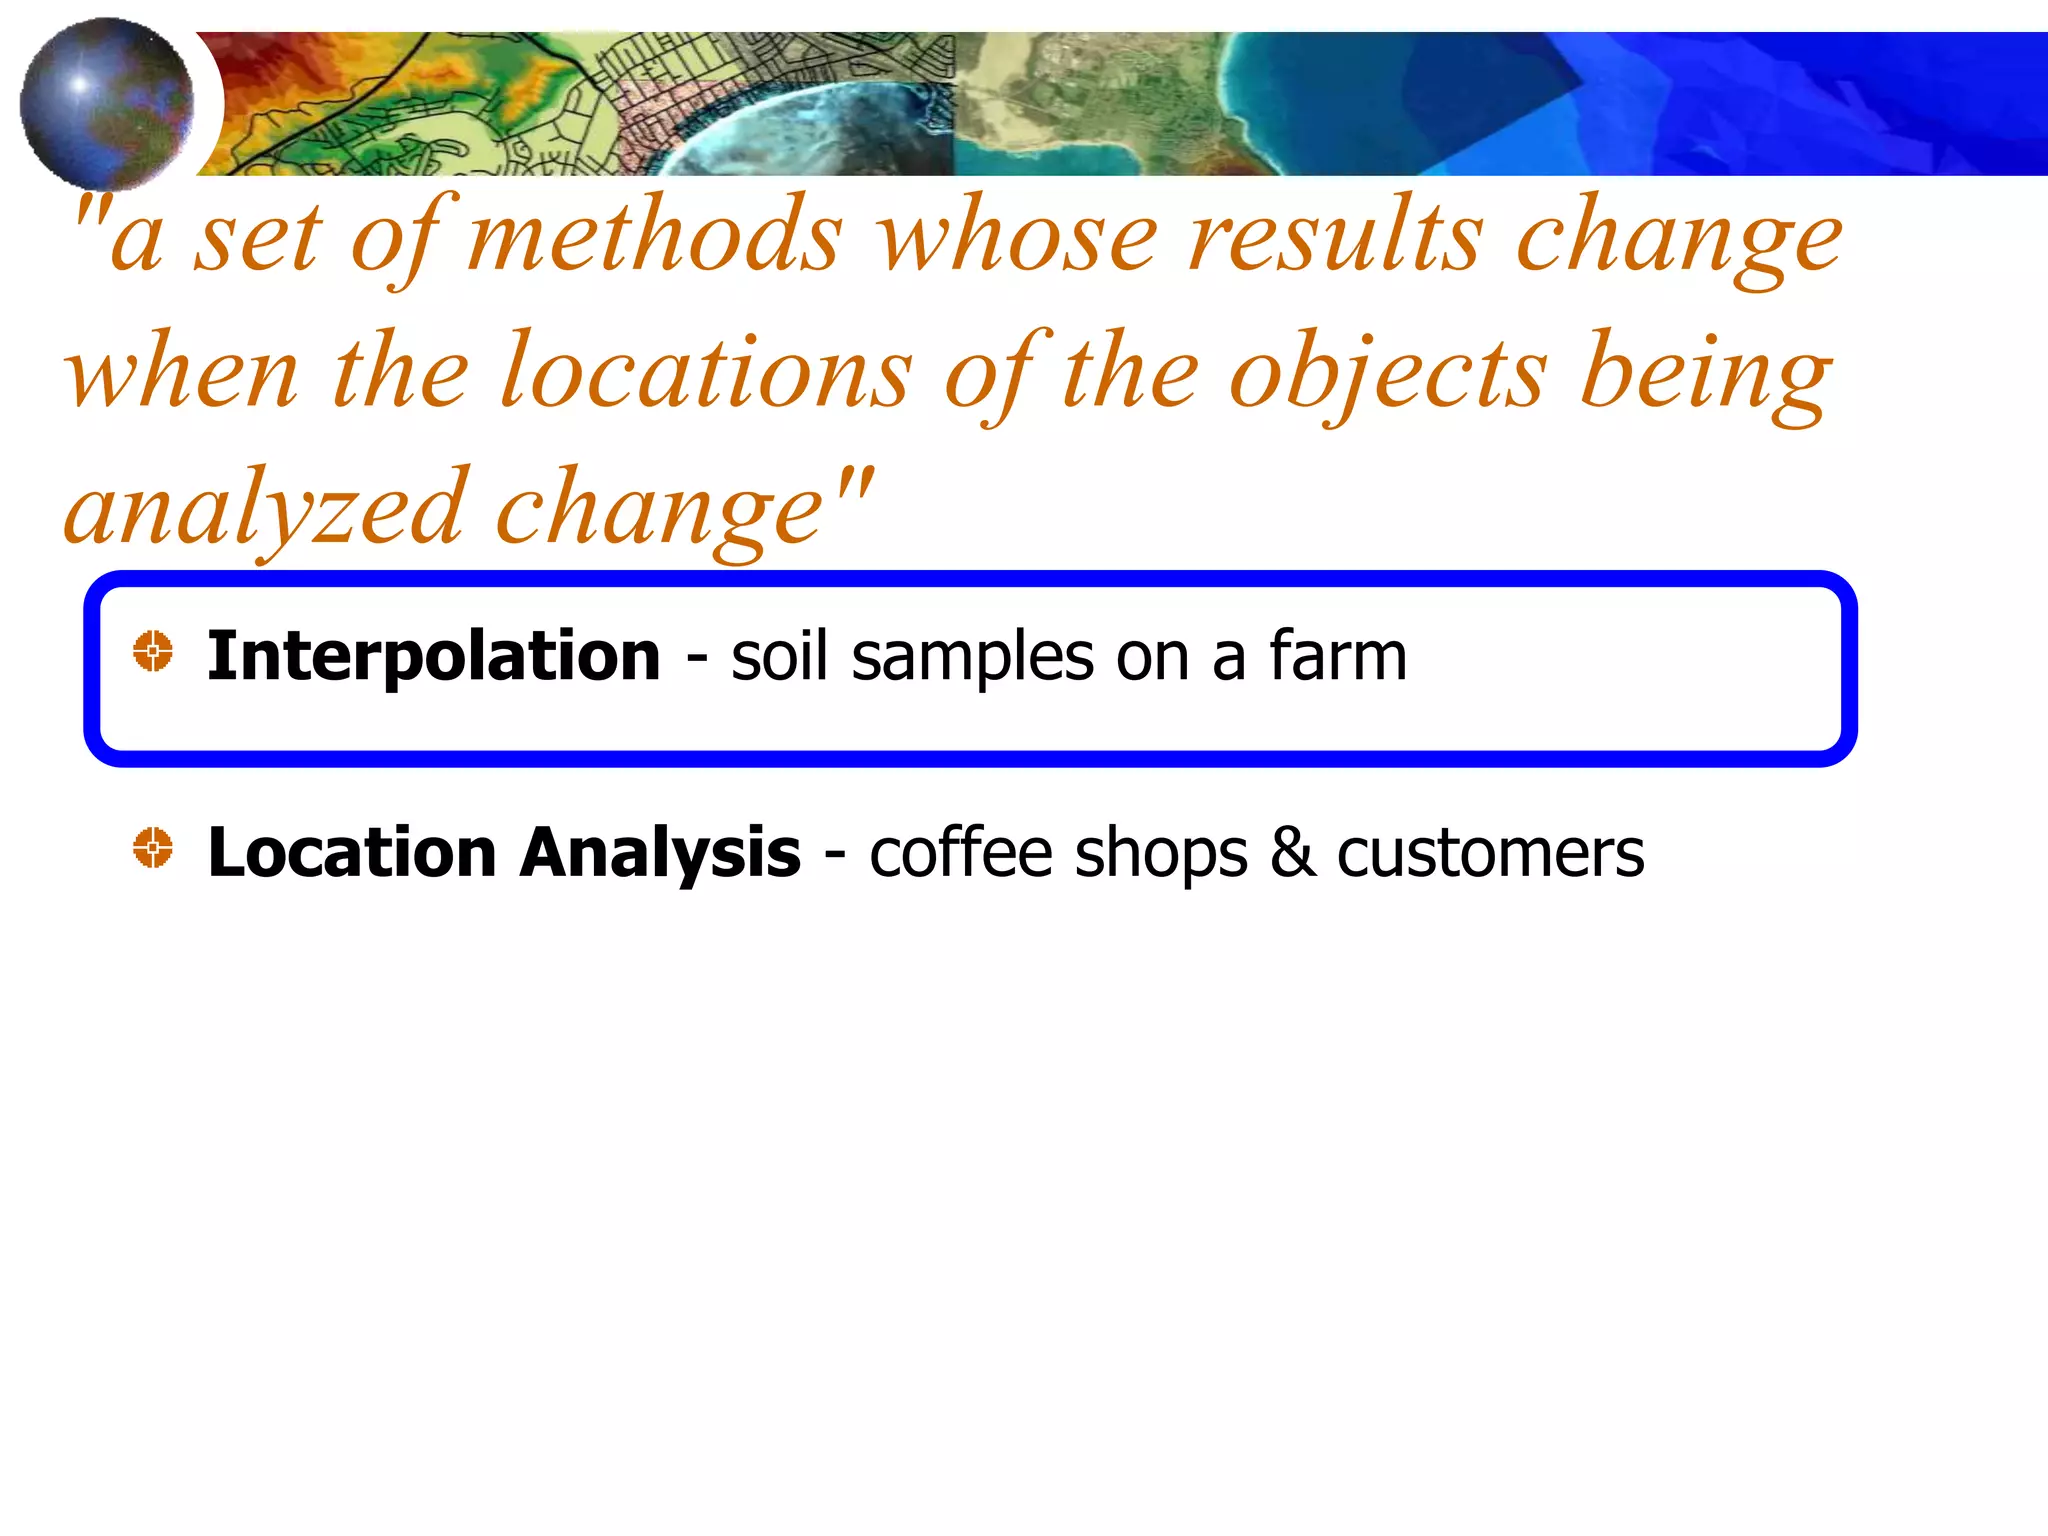
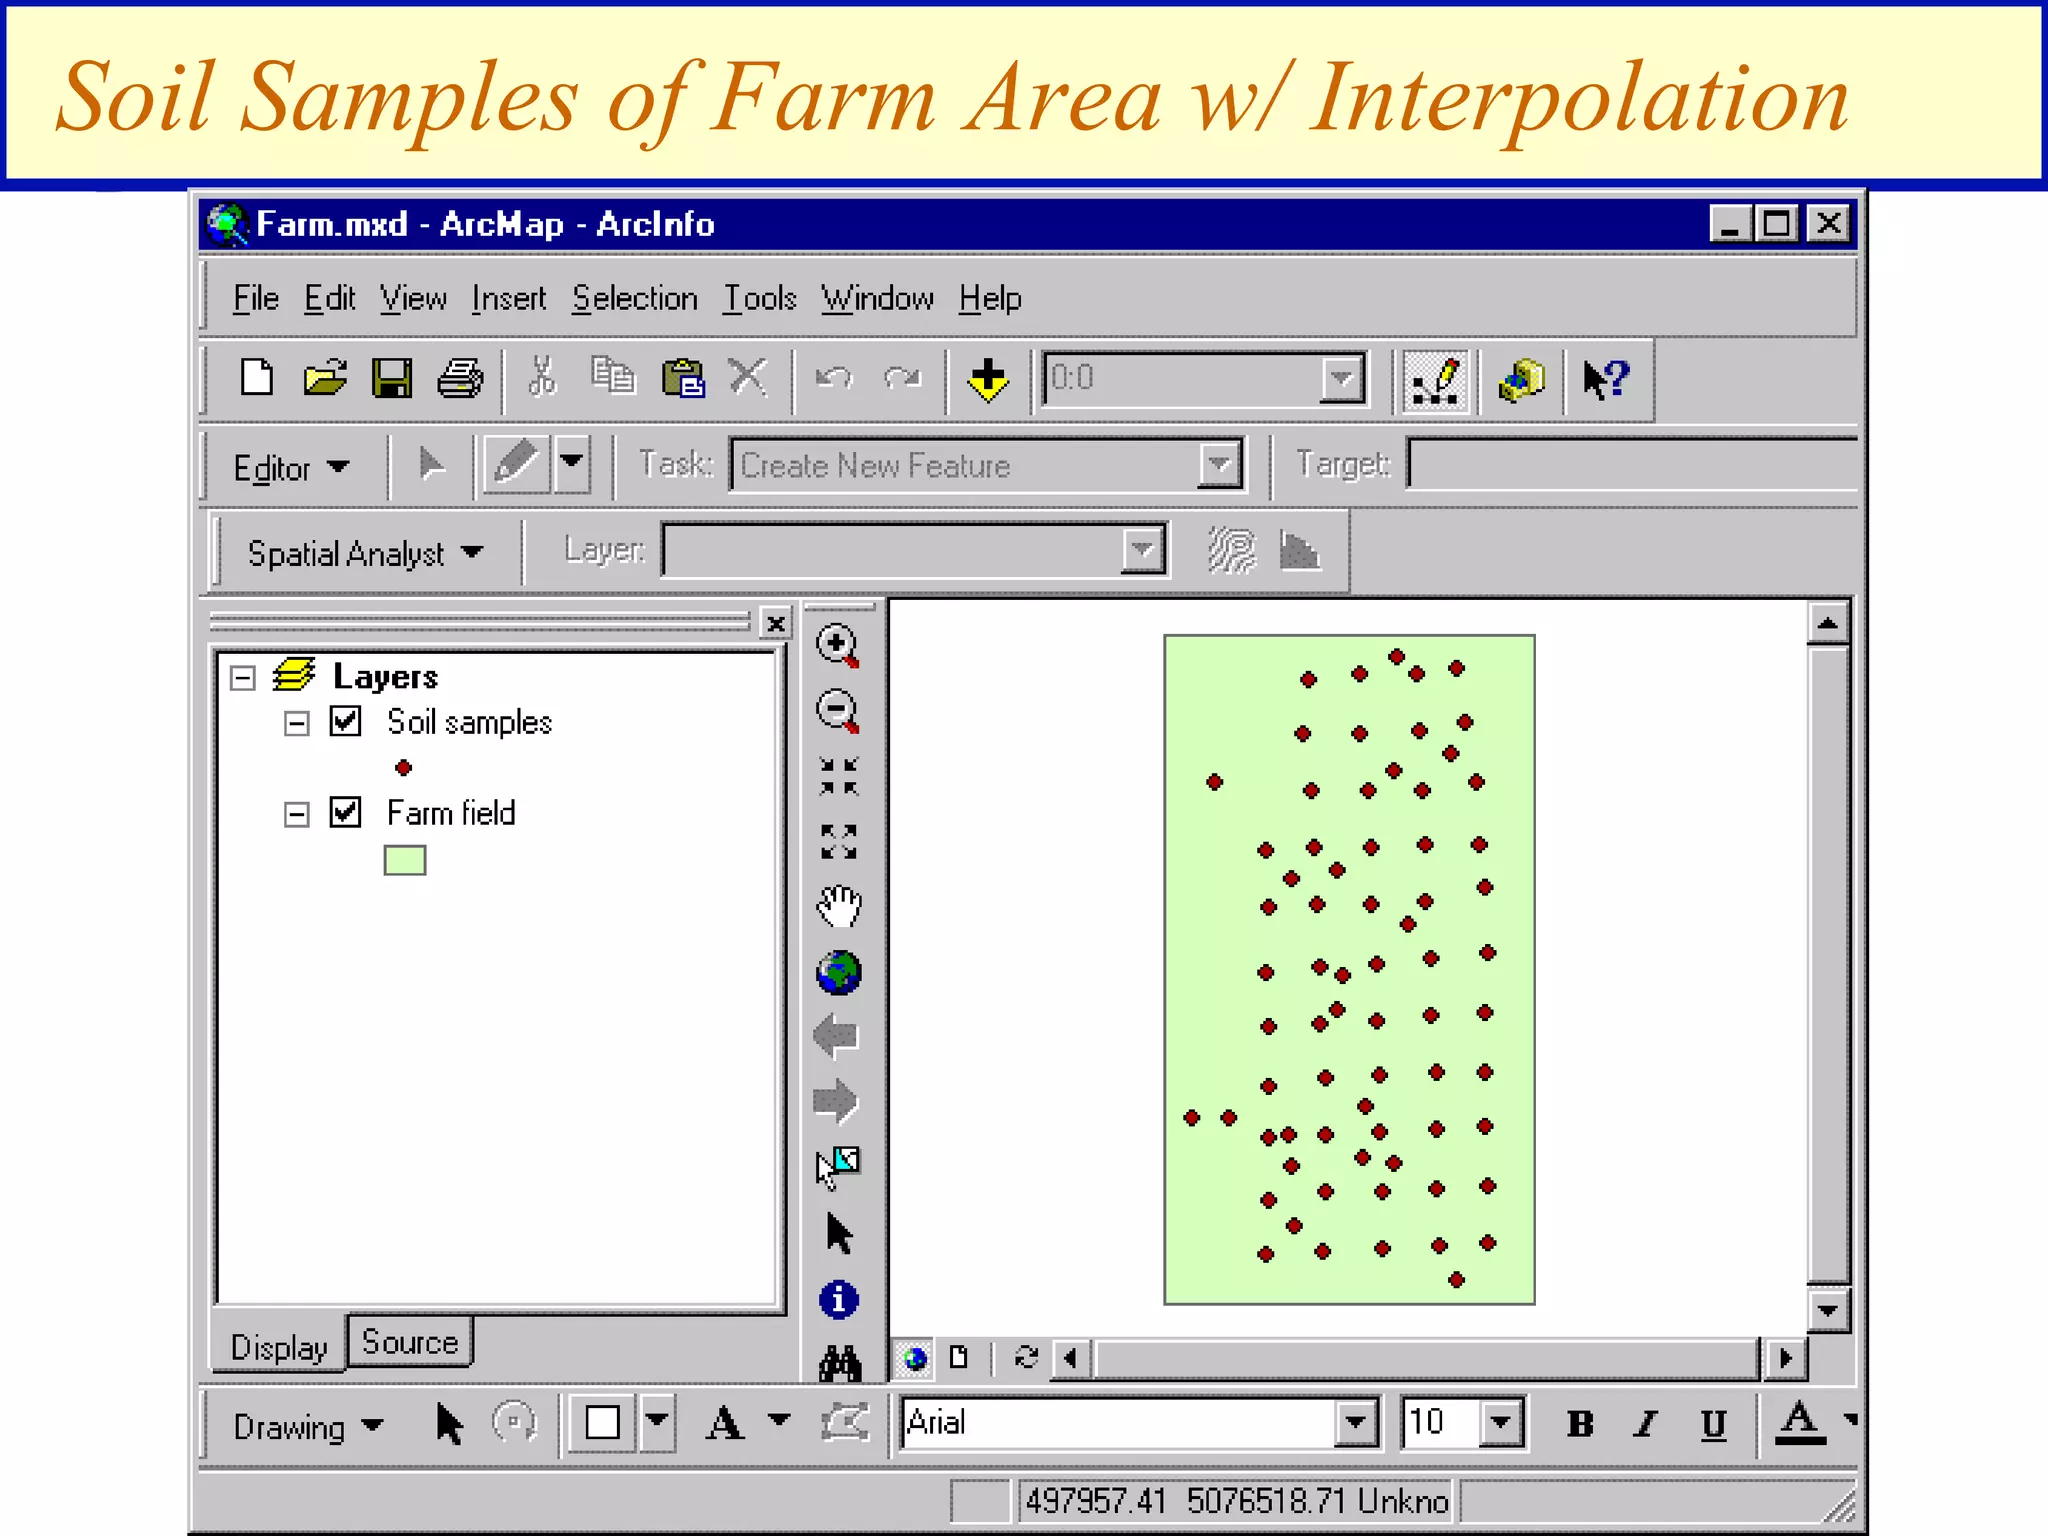
This document discusses spatial analysis and types of uncertainty in geographic data. It covers common spatial analysis techniques like overlays, buffering, and map algebra. It also addresses uncertainty in the conception, measurement, and representation of geographic phenomena stemming from issues like vagueness, measurement error, data structures, and the modifiable areal unit problem. Examples demonstrate interpolation of soil samples and coffee shop location analysis using spatial techniques in GIS.
![2 Analysis Examples from ArcGIS
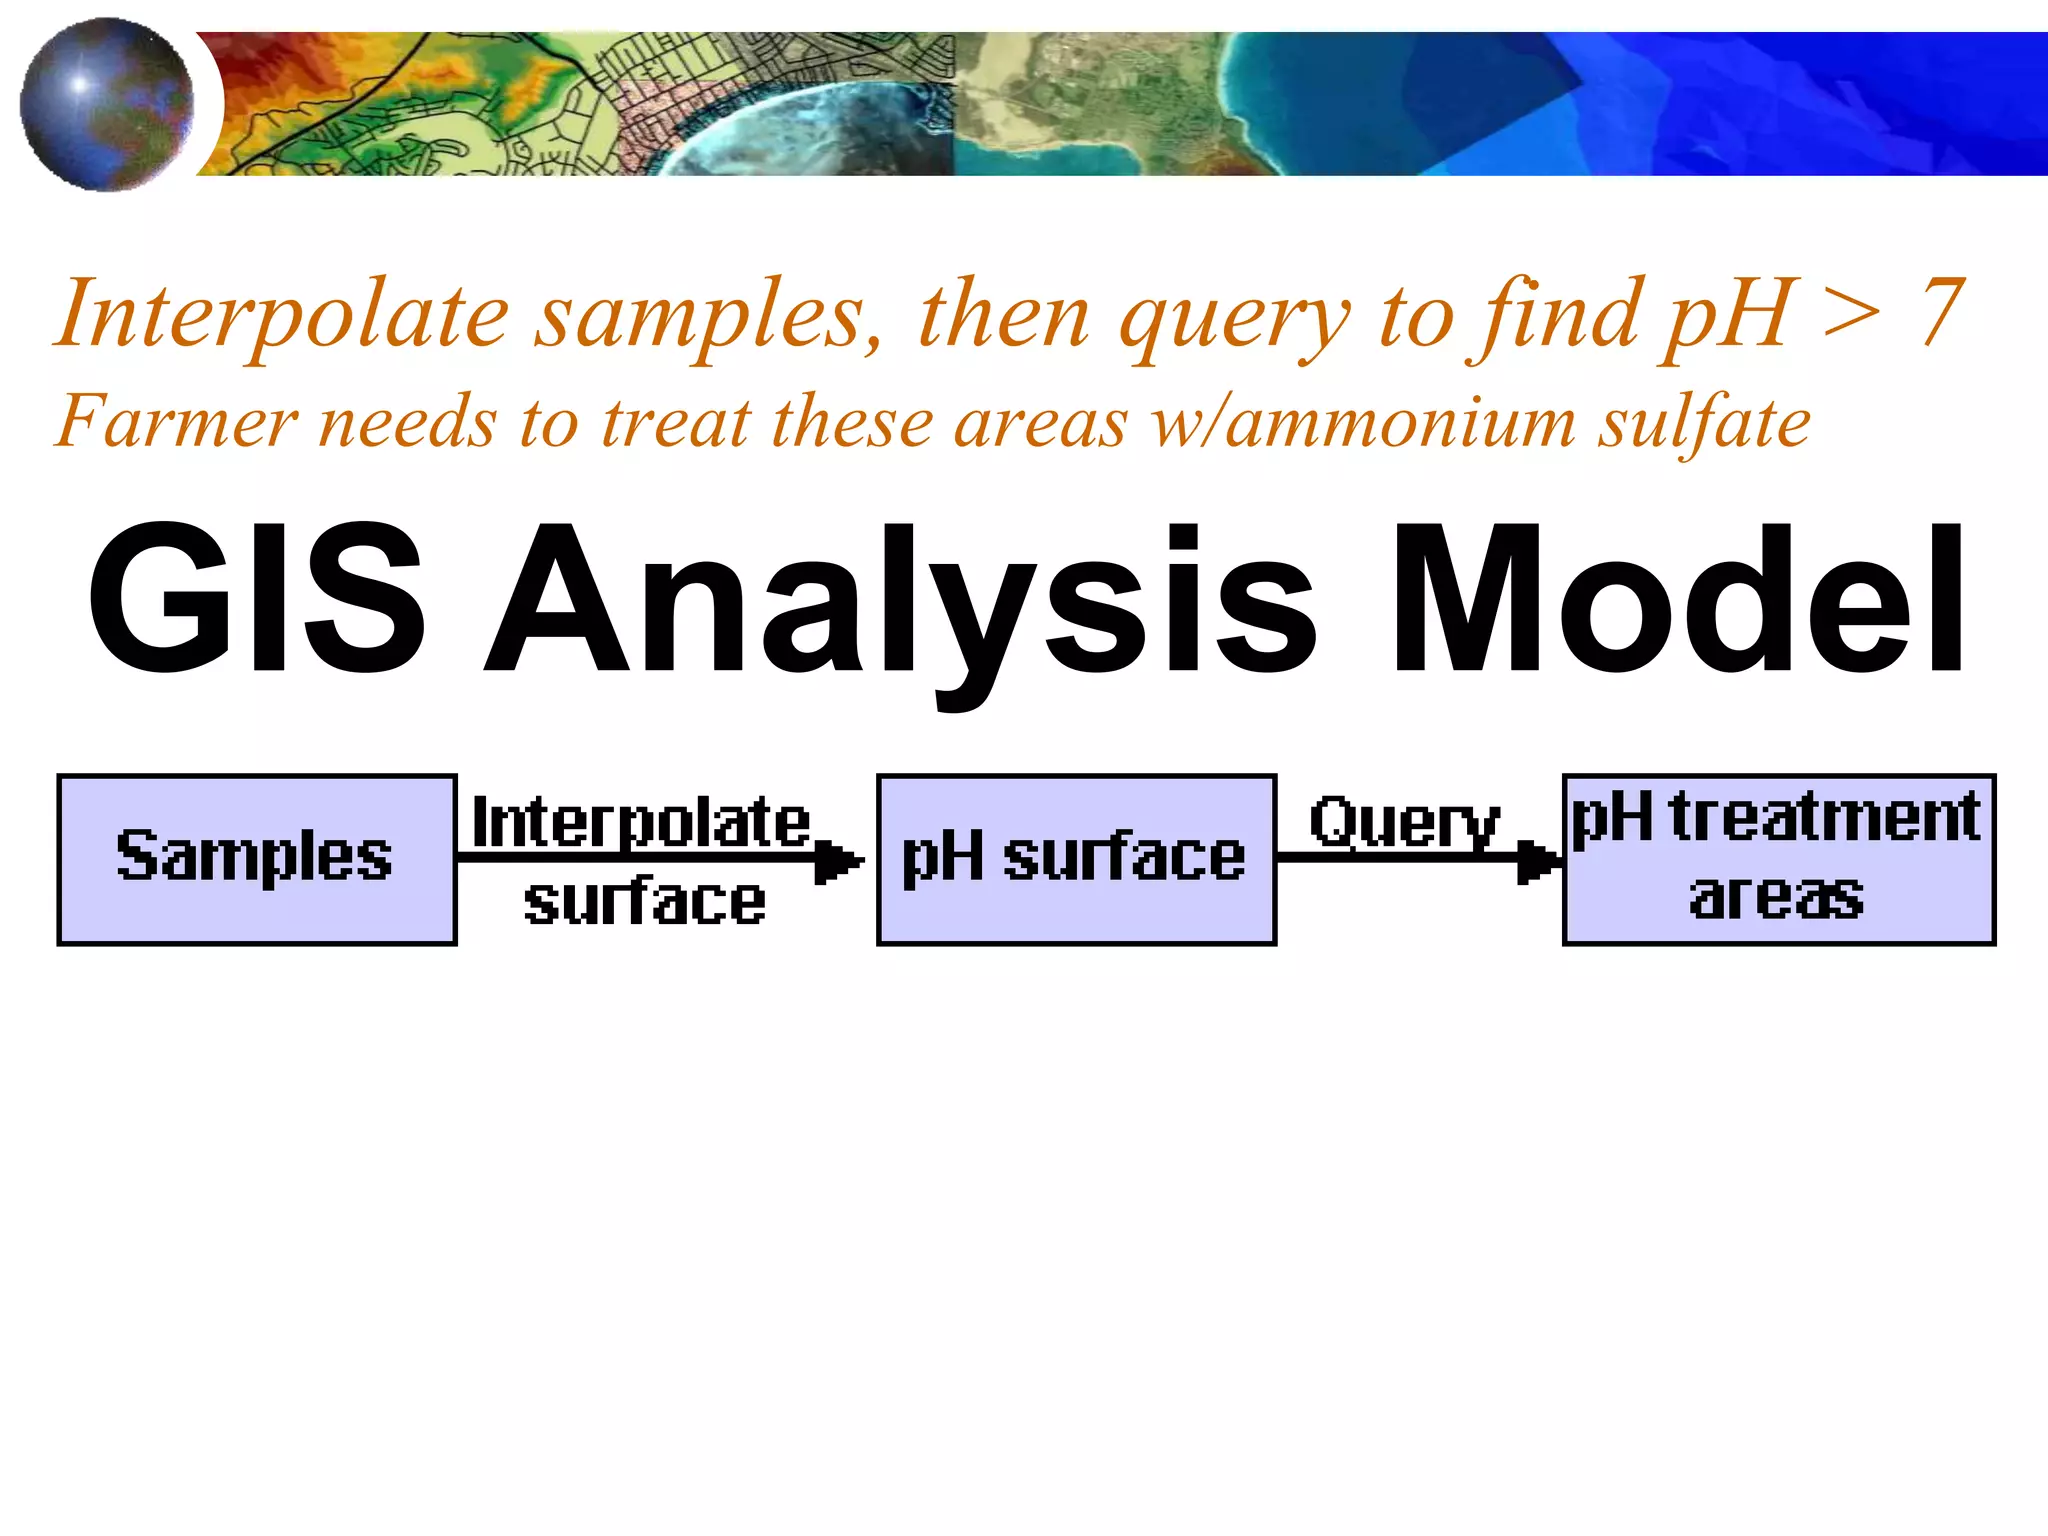
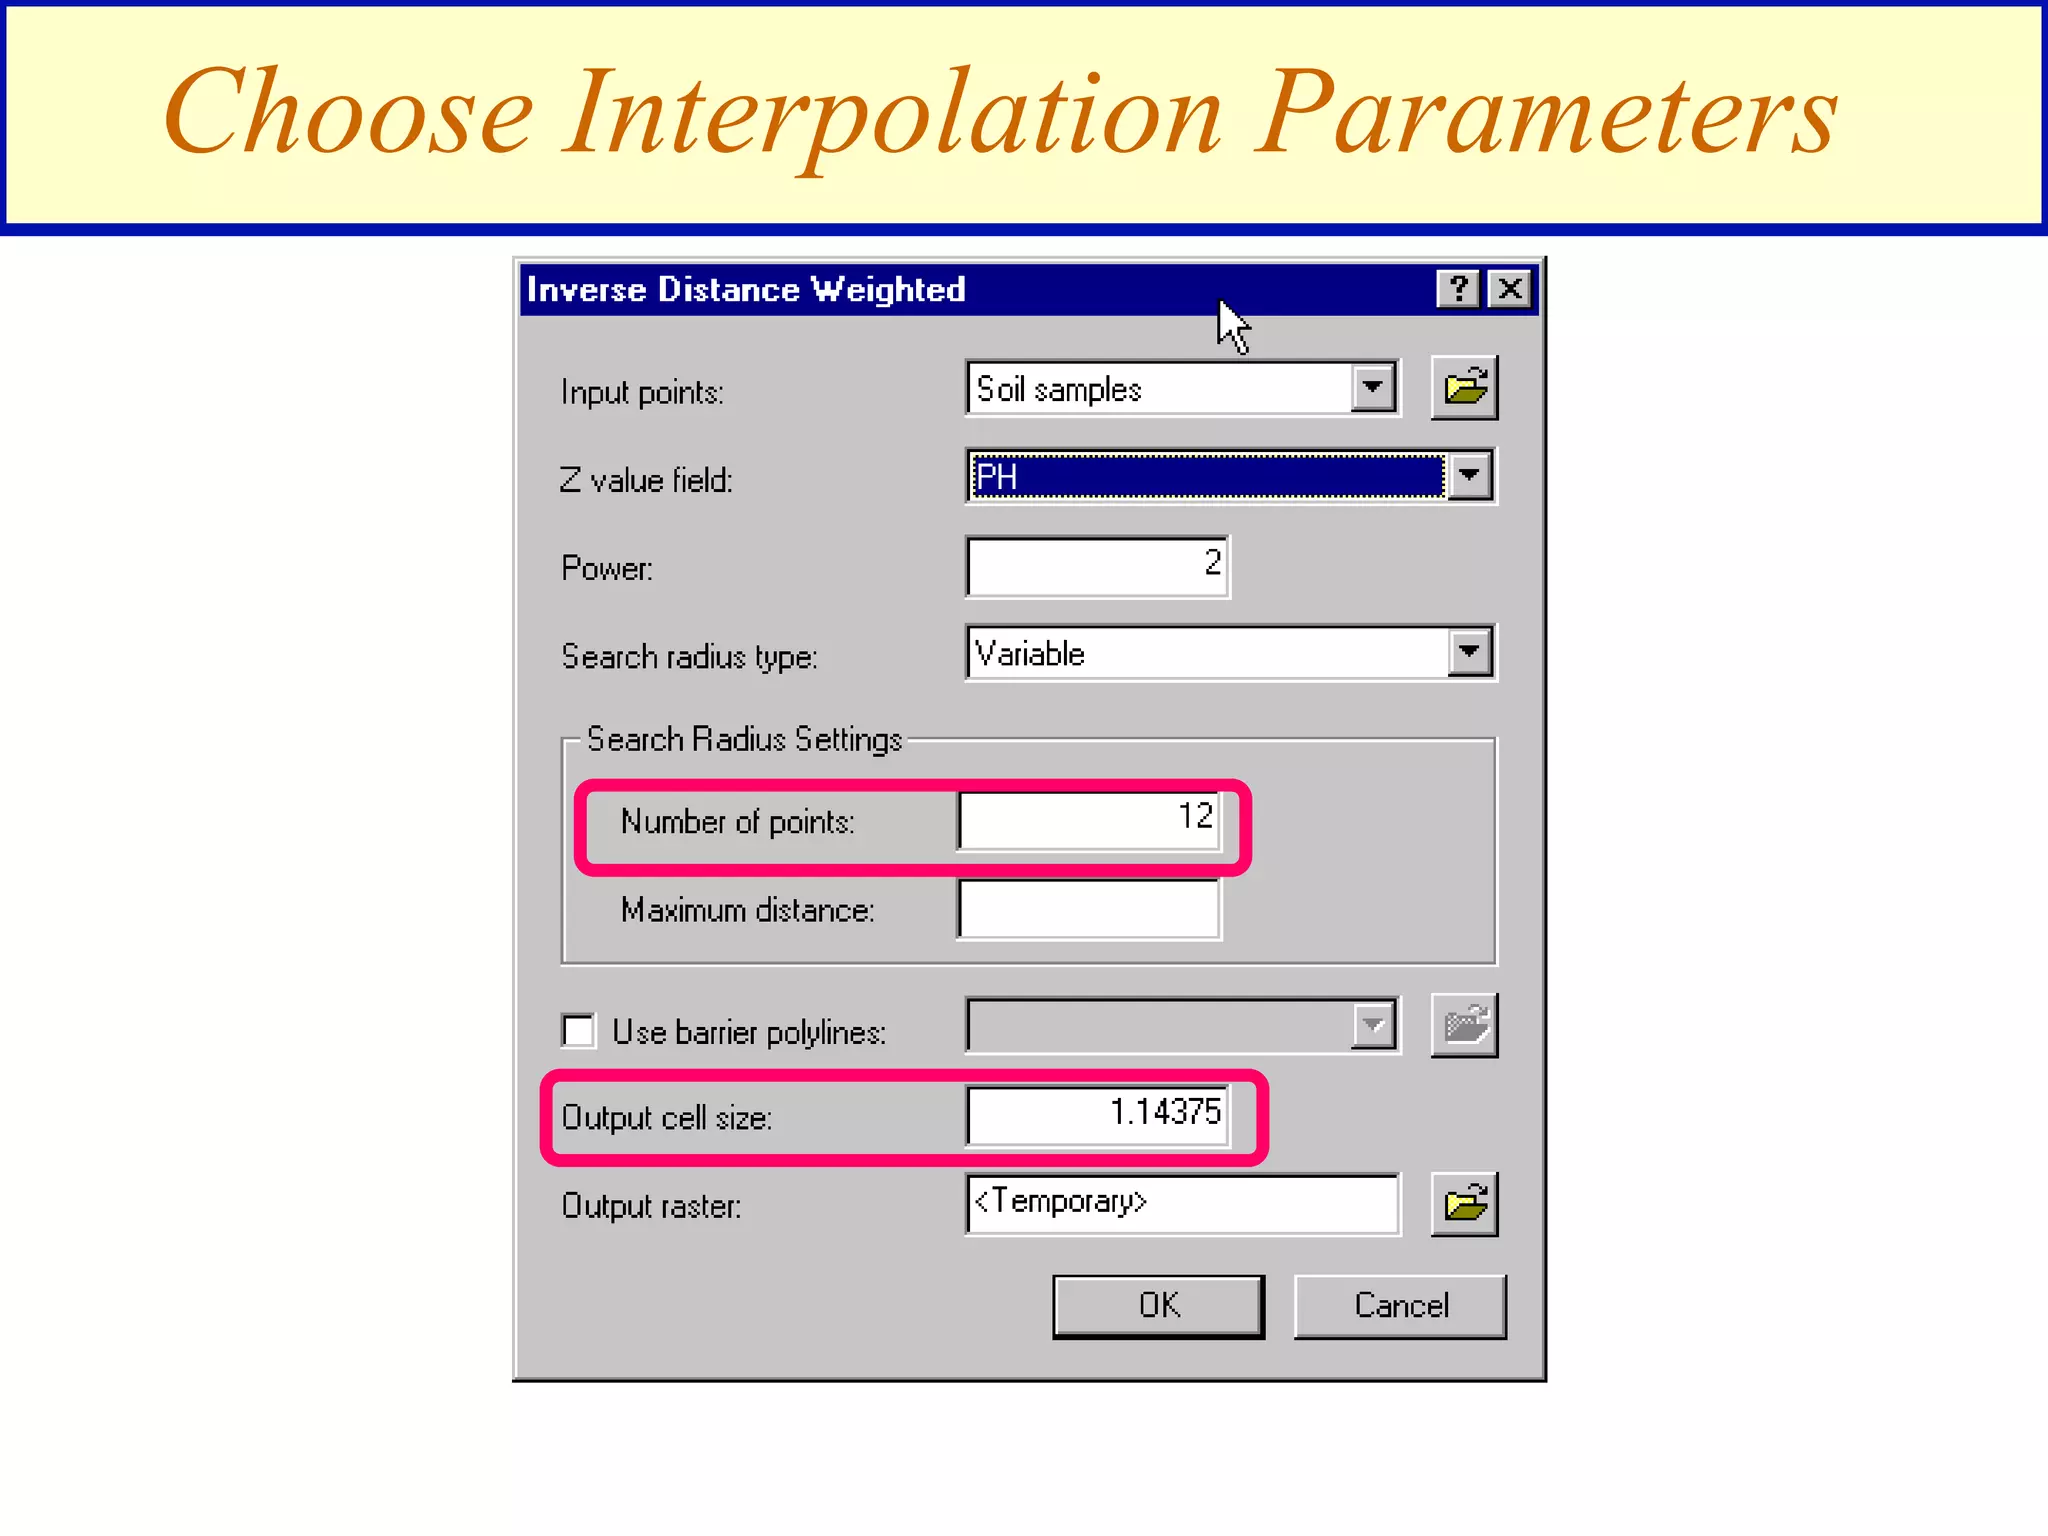
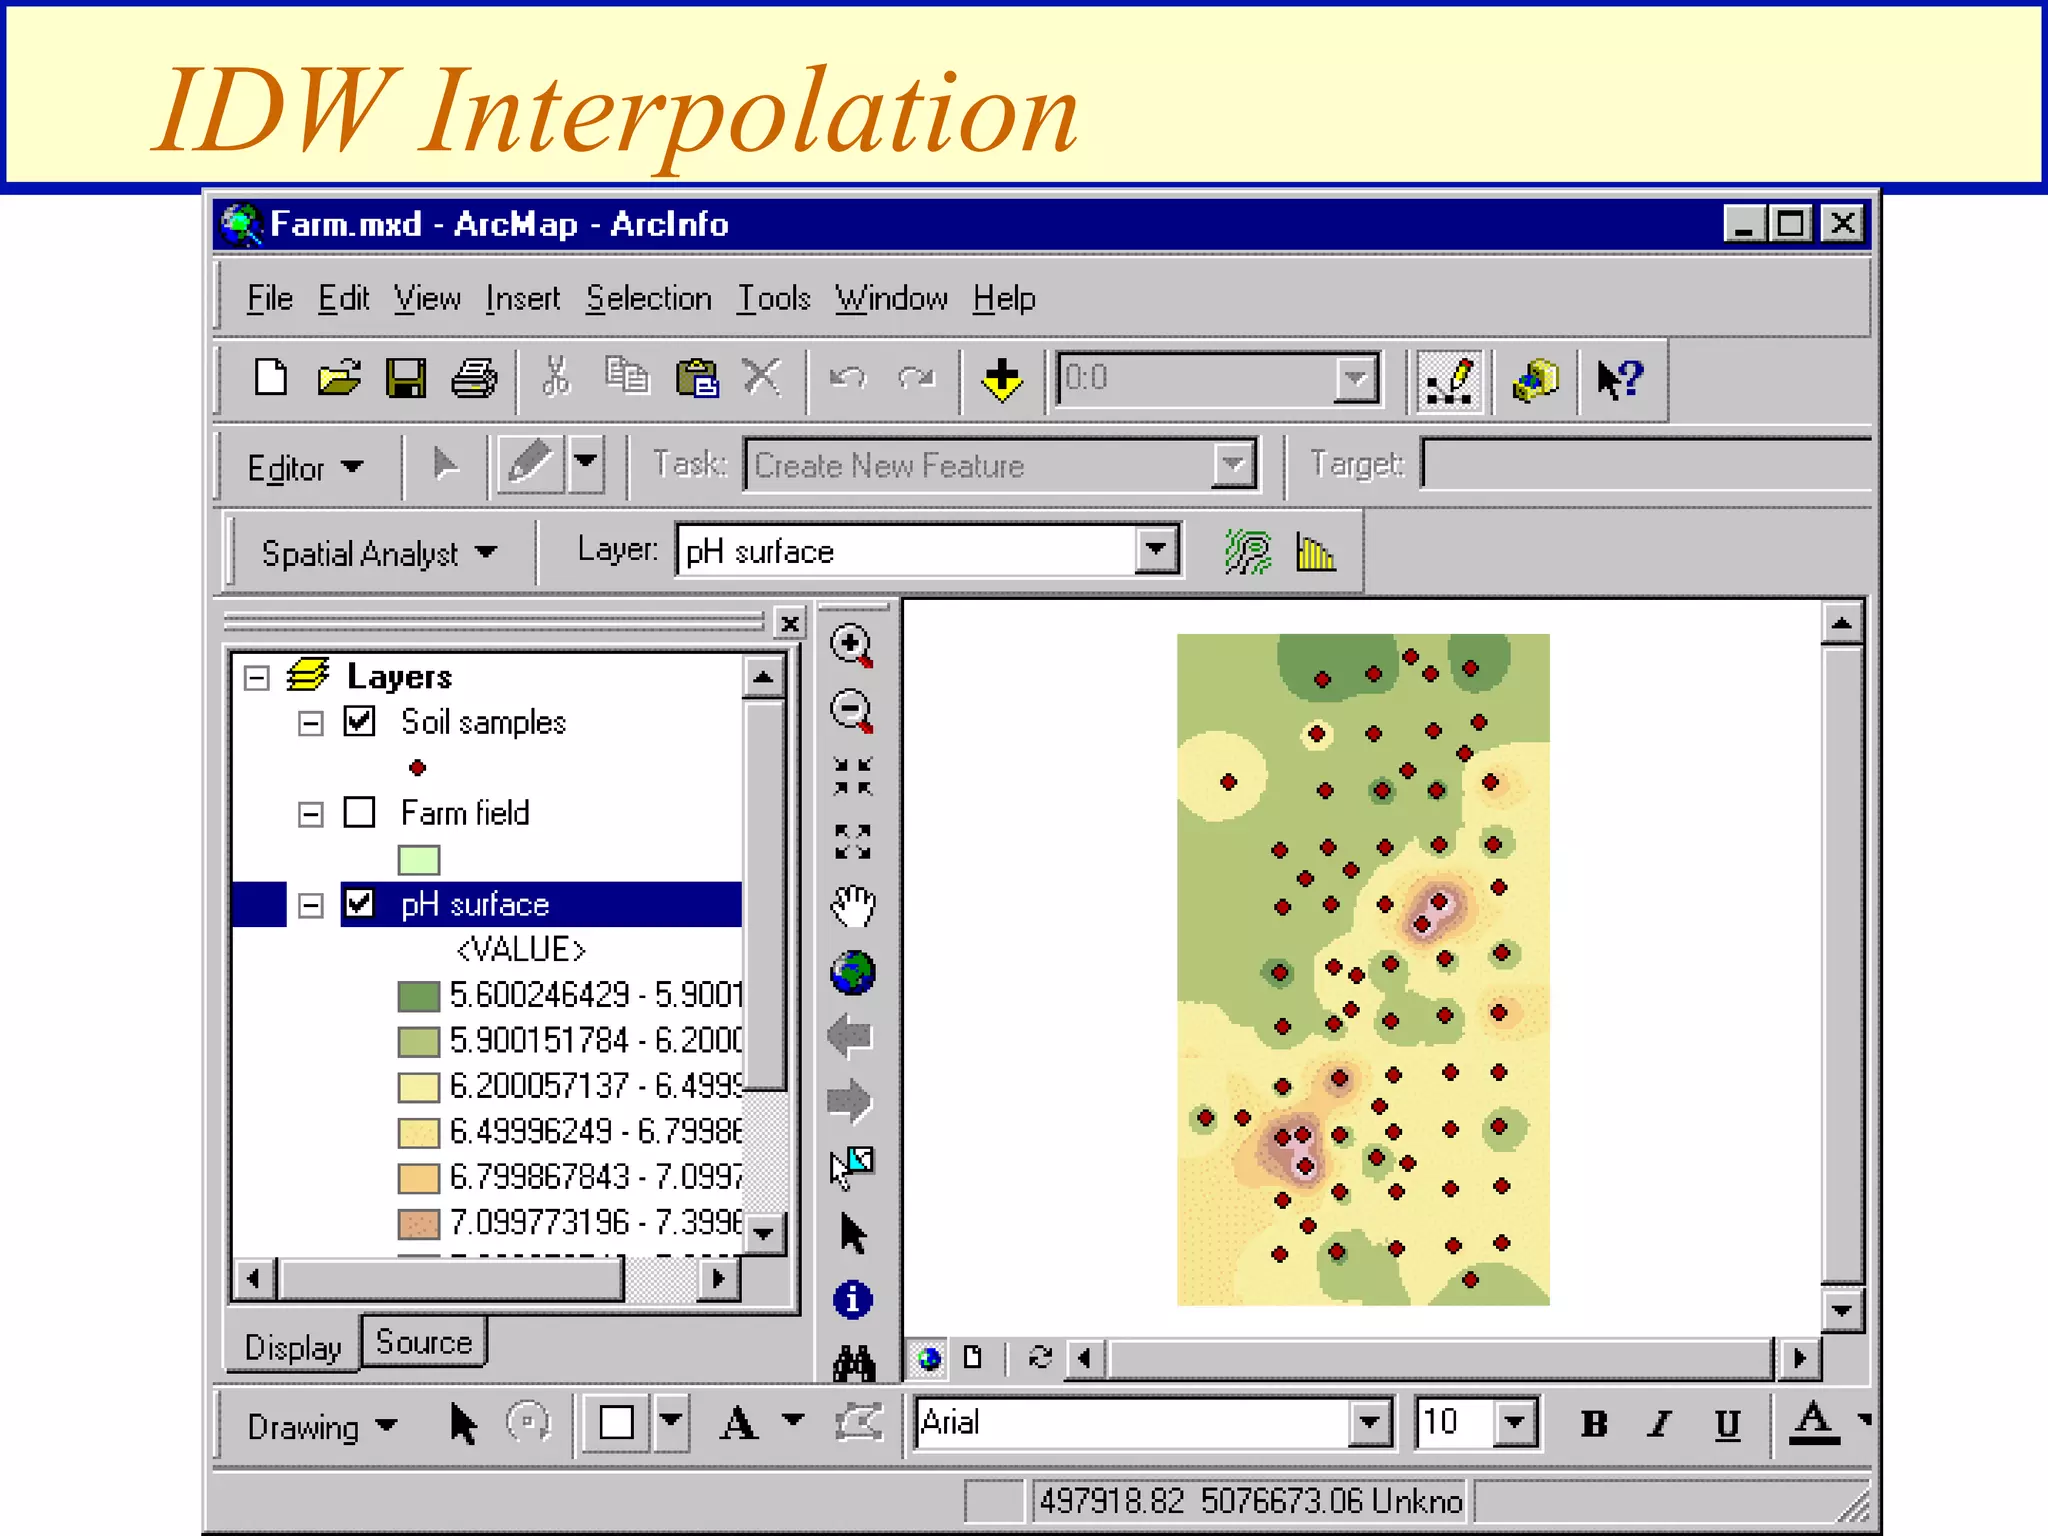
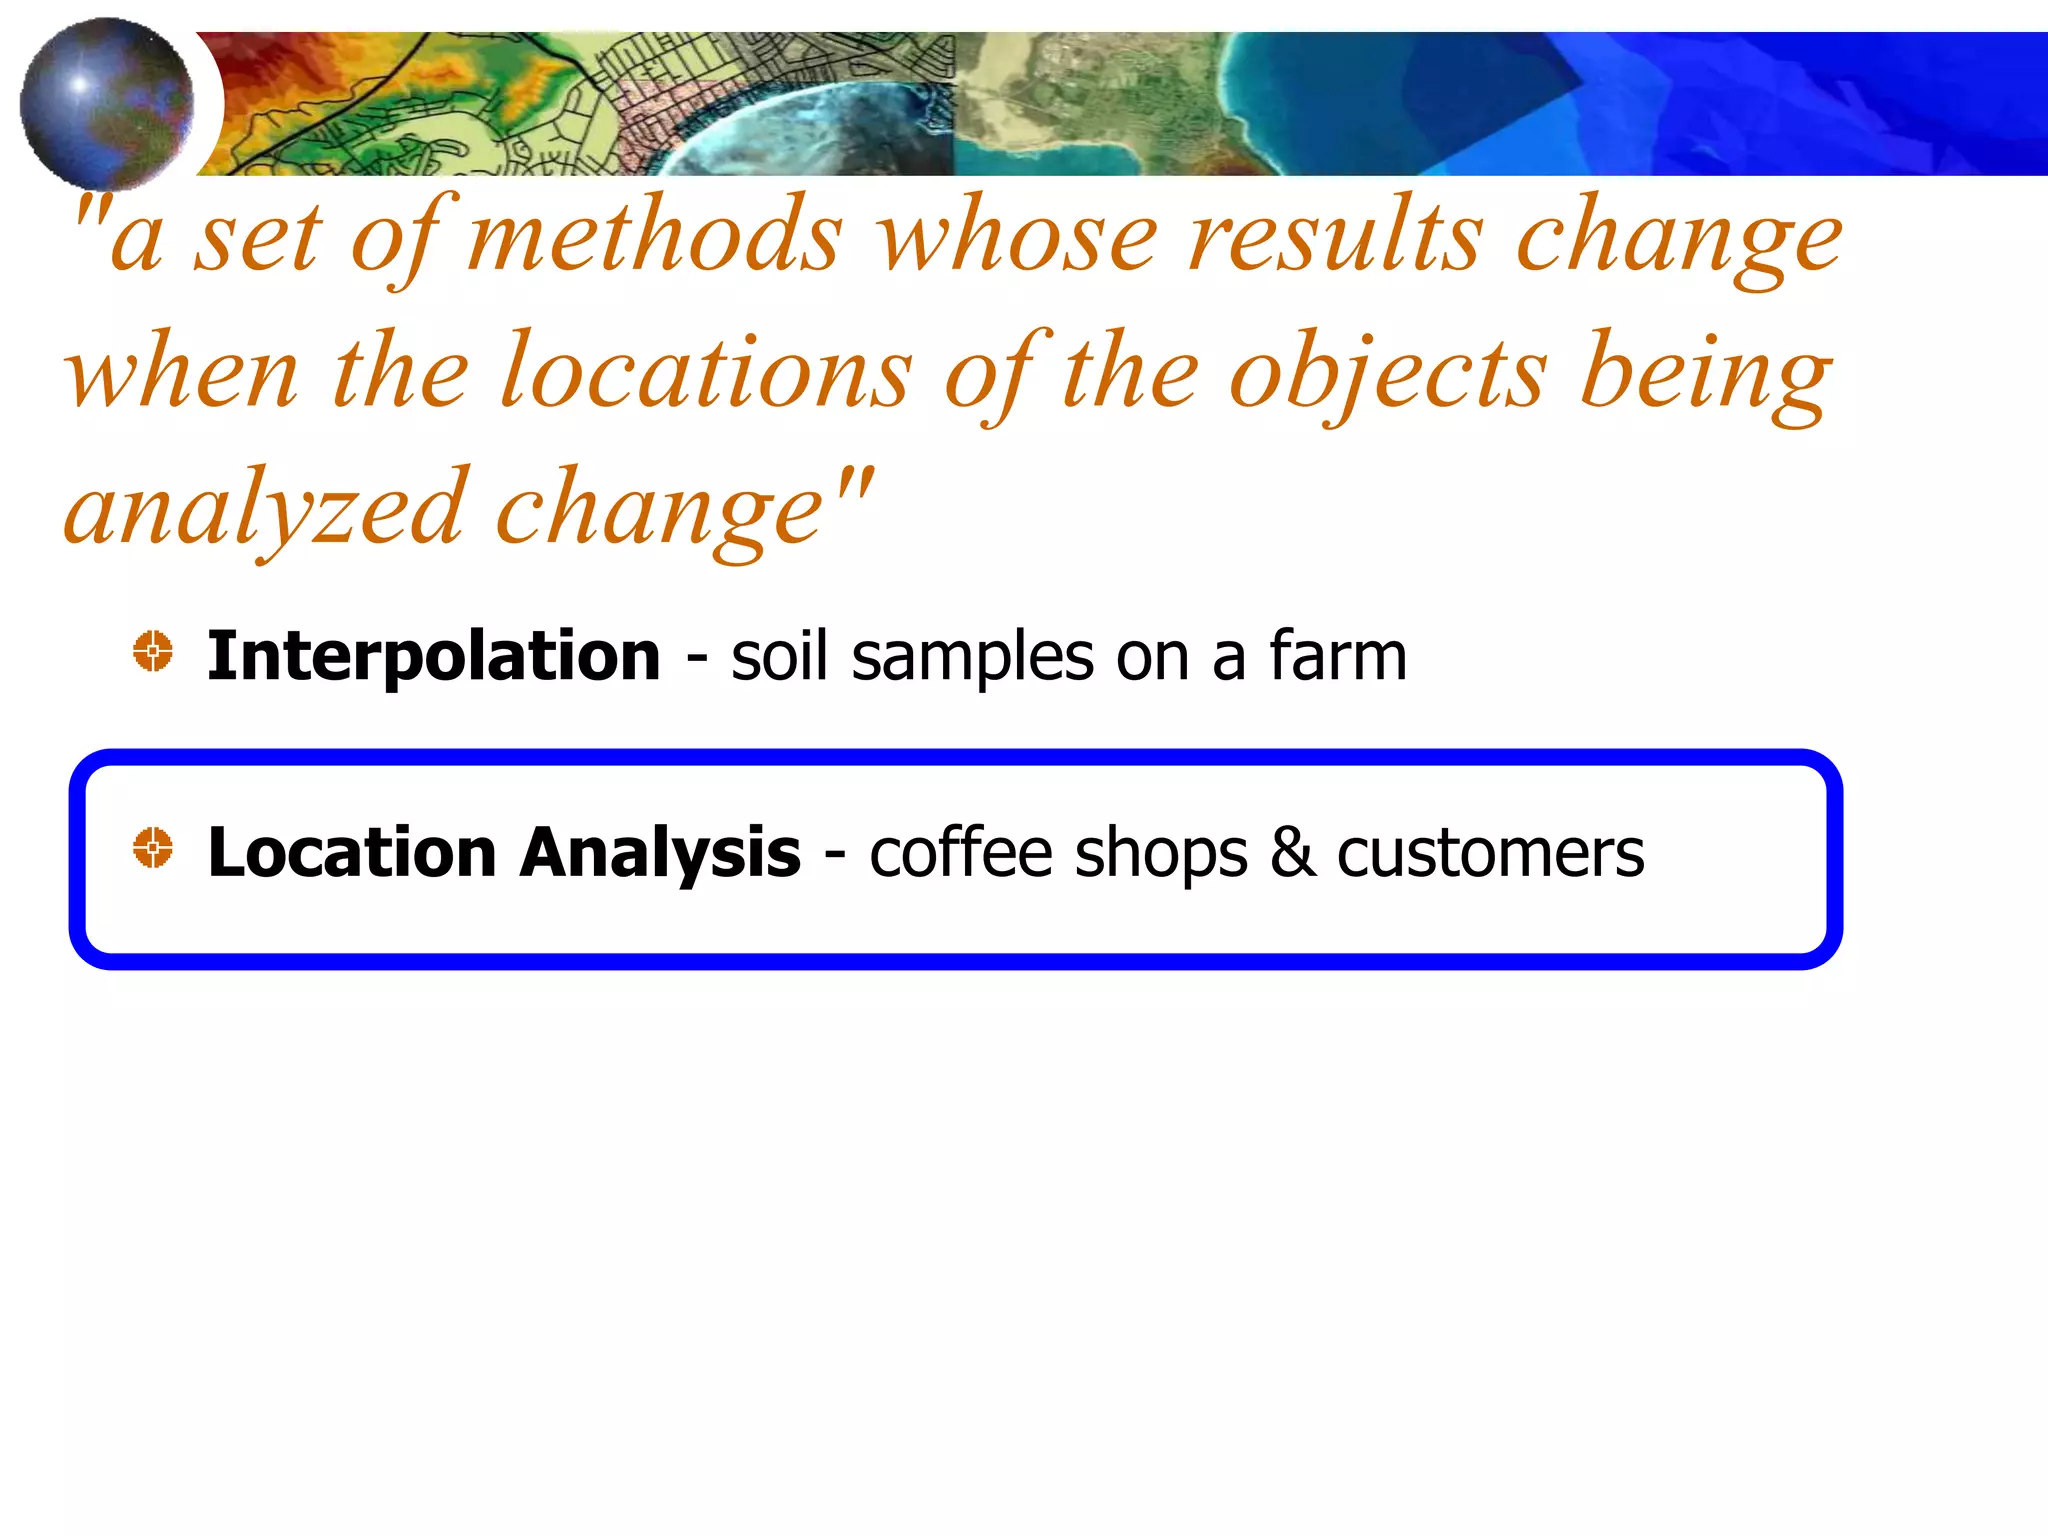
Interpolation - soil samples on a farm
[transformation]
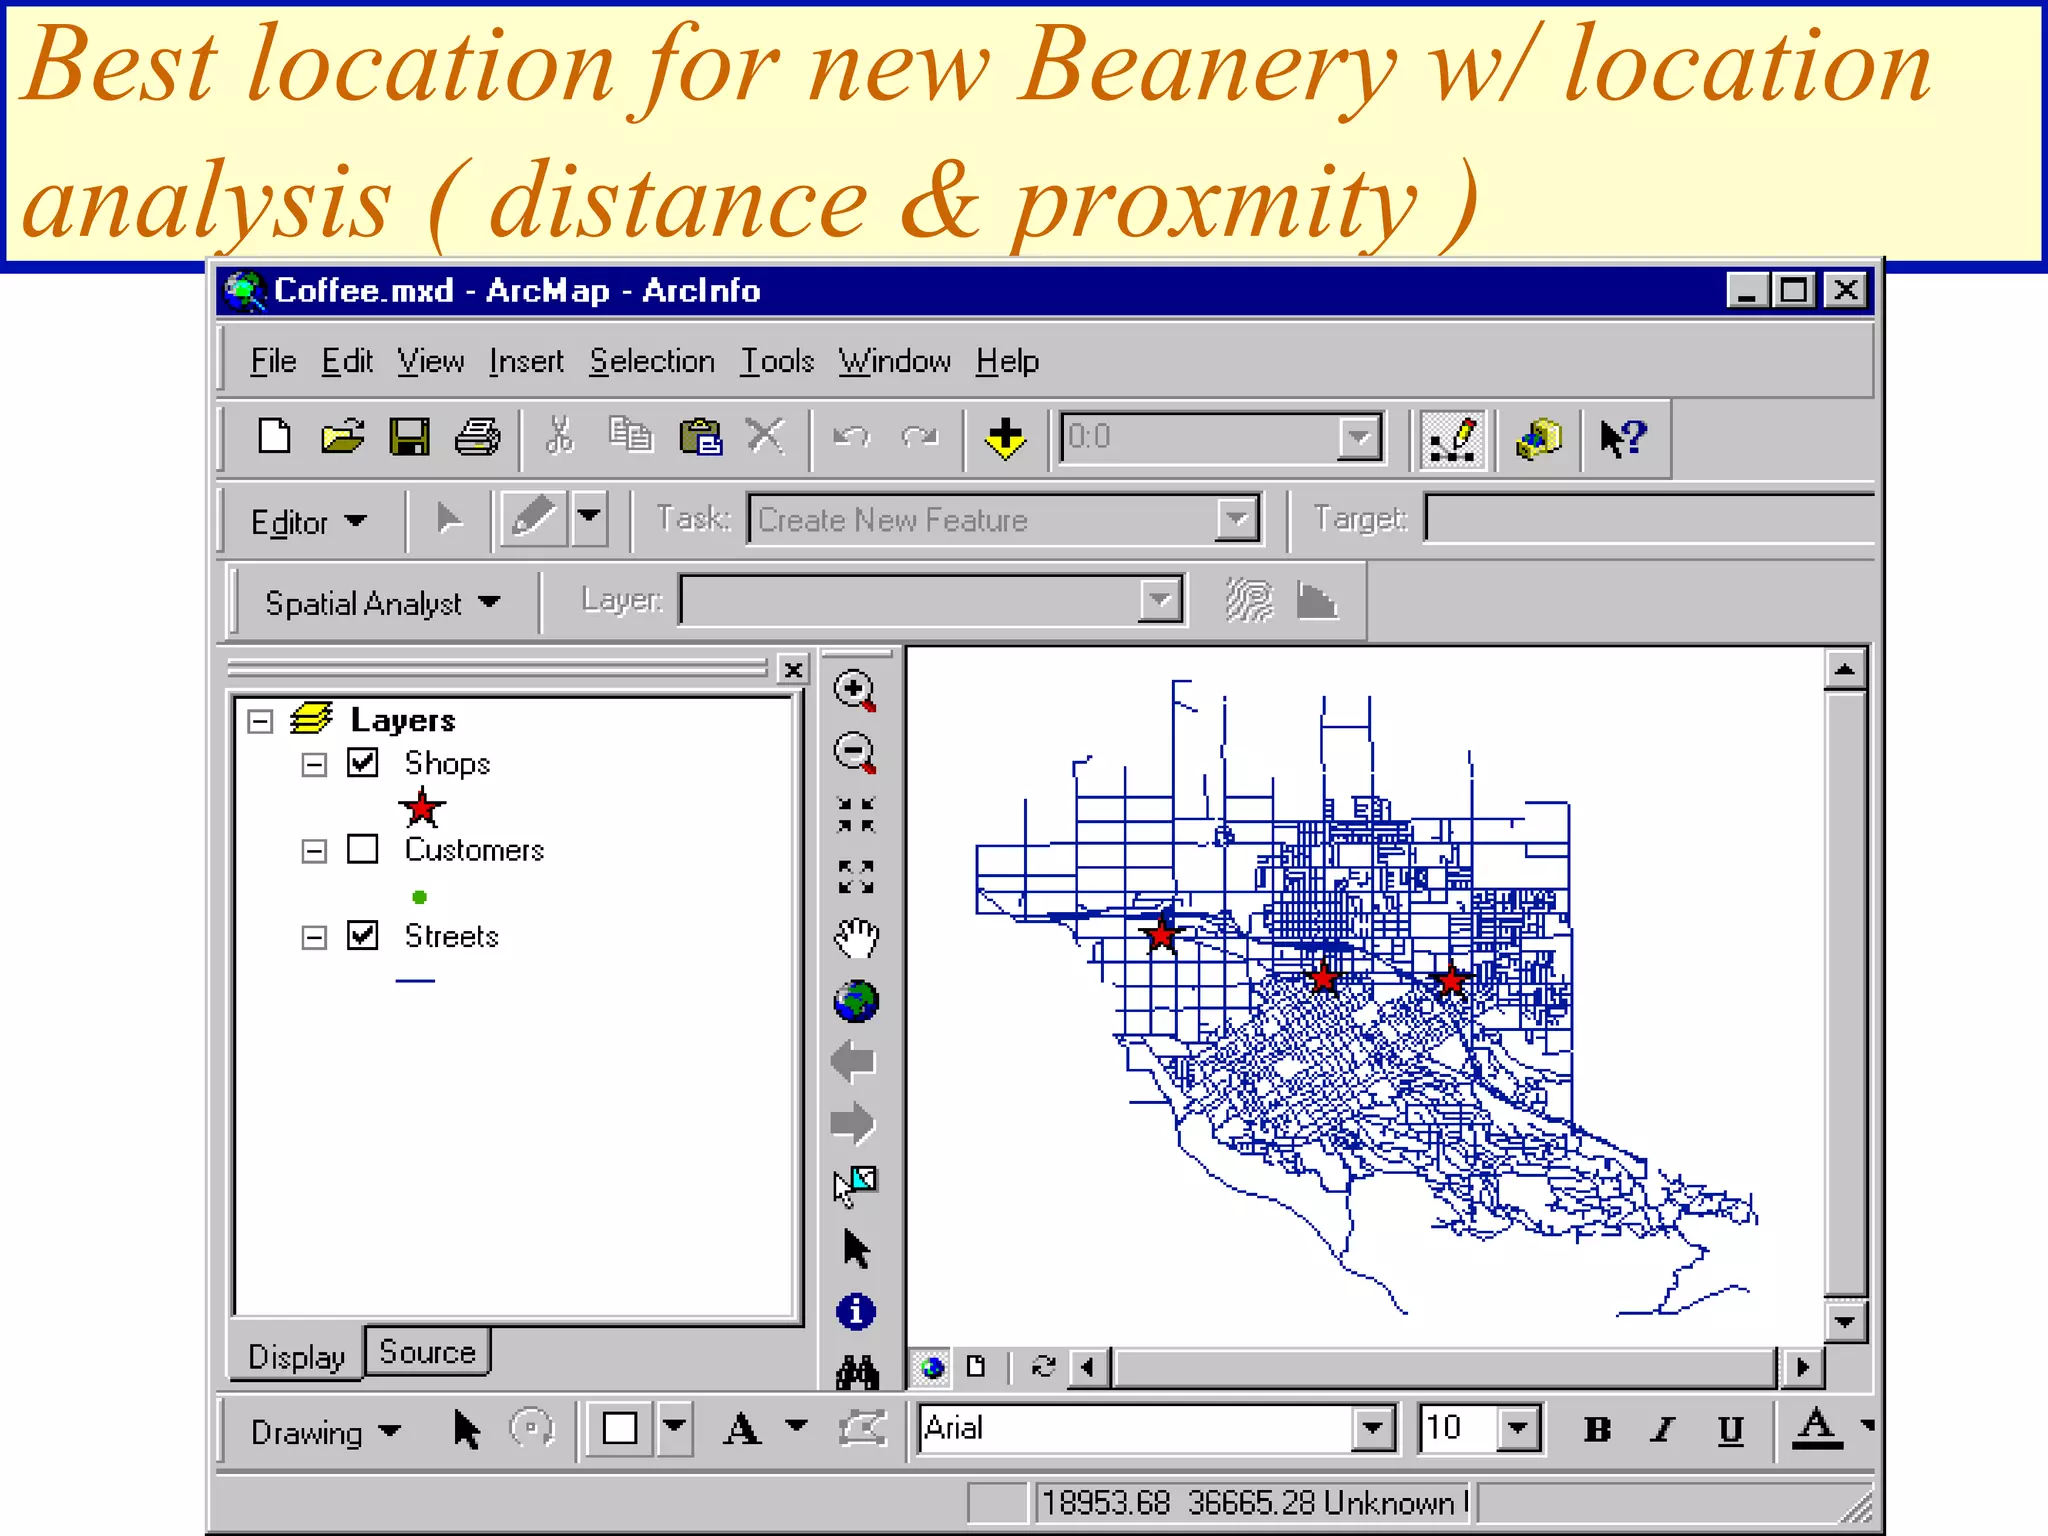
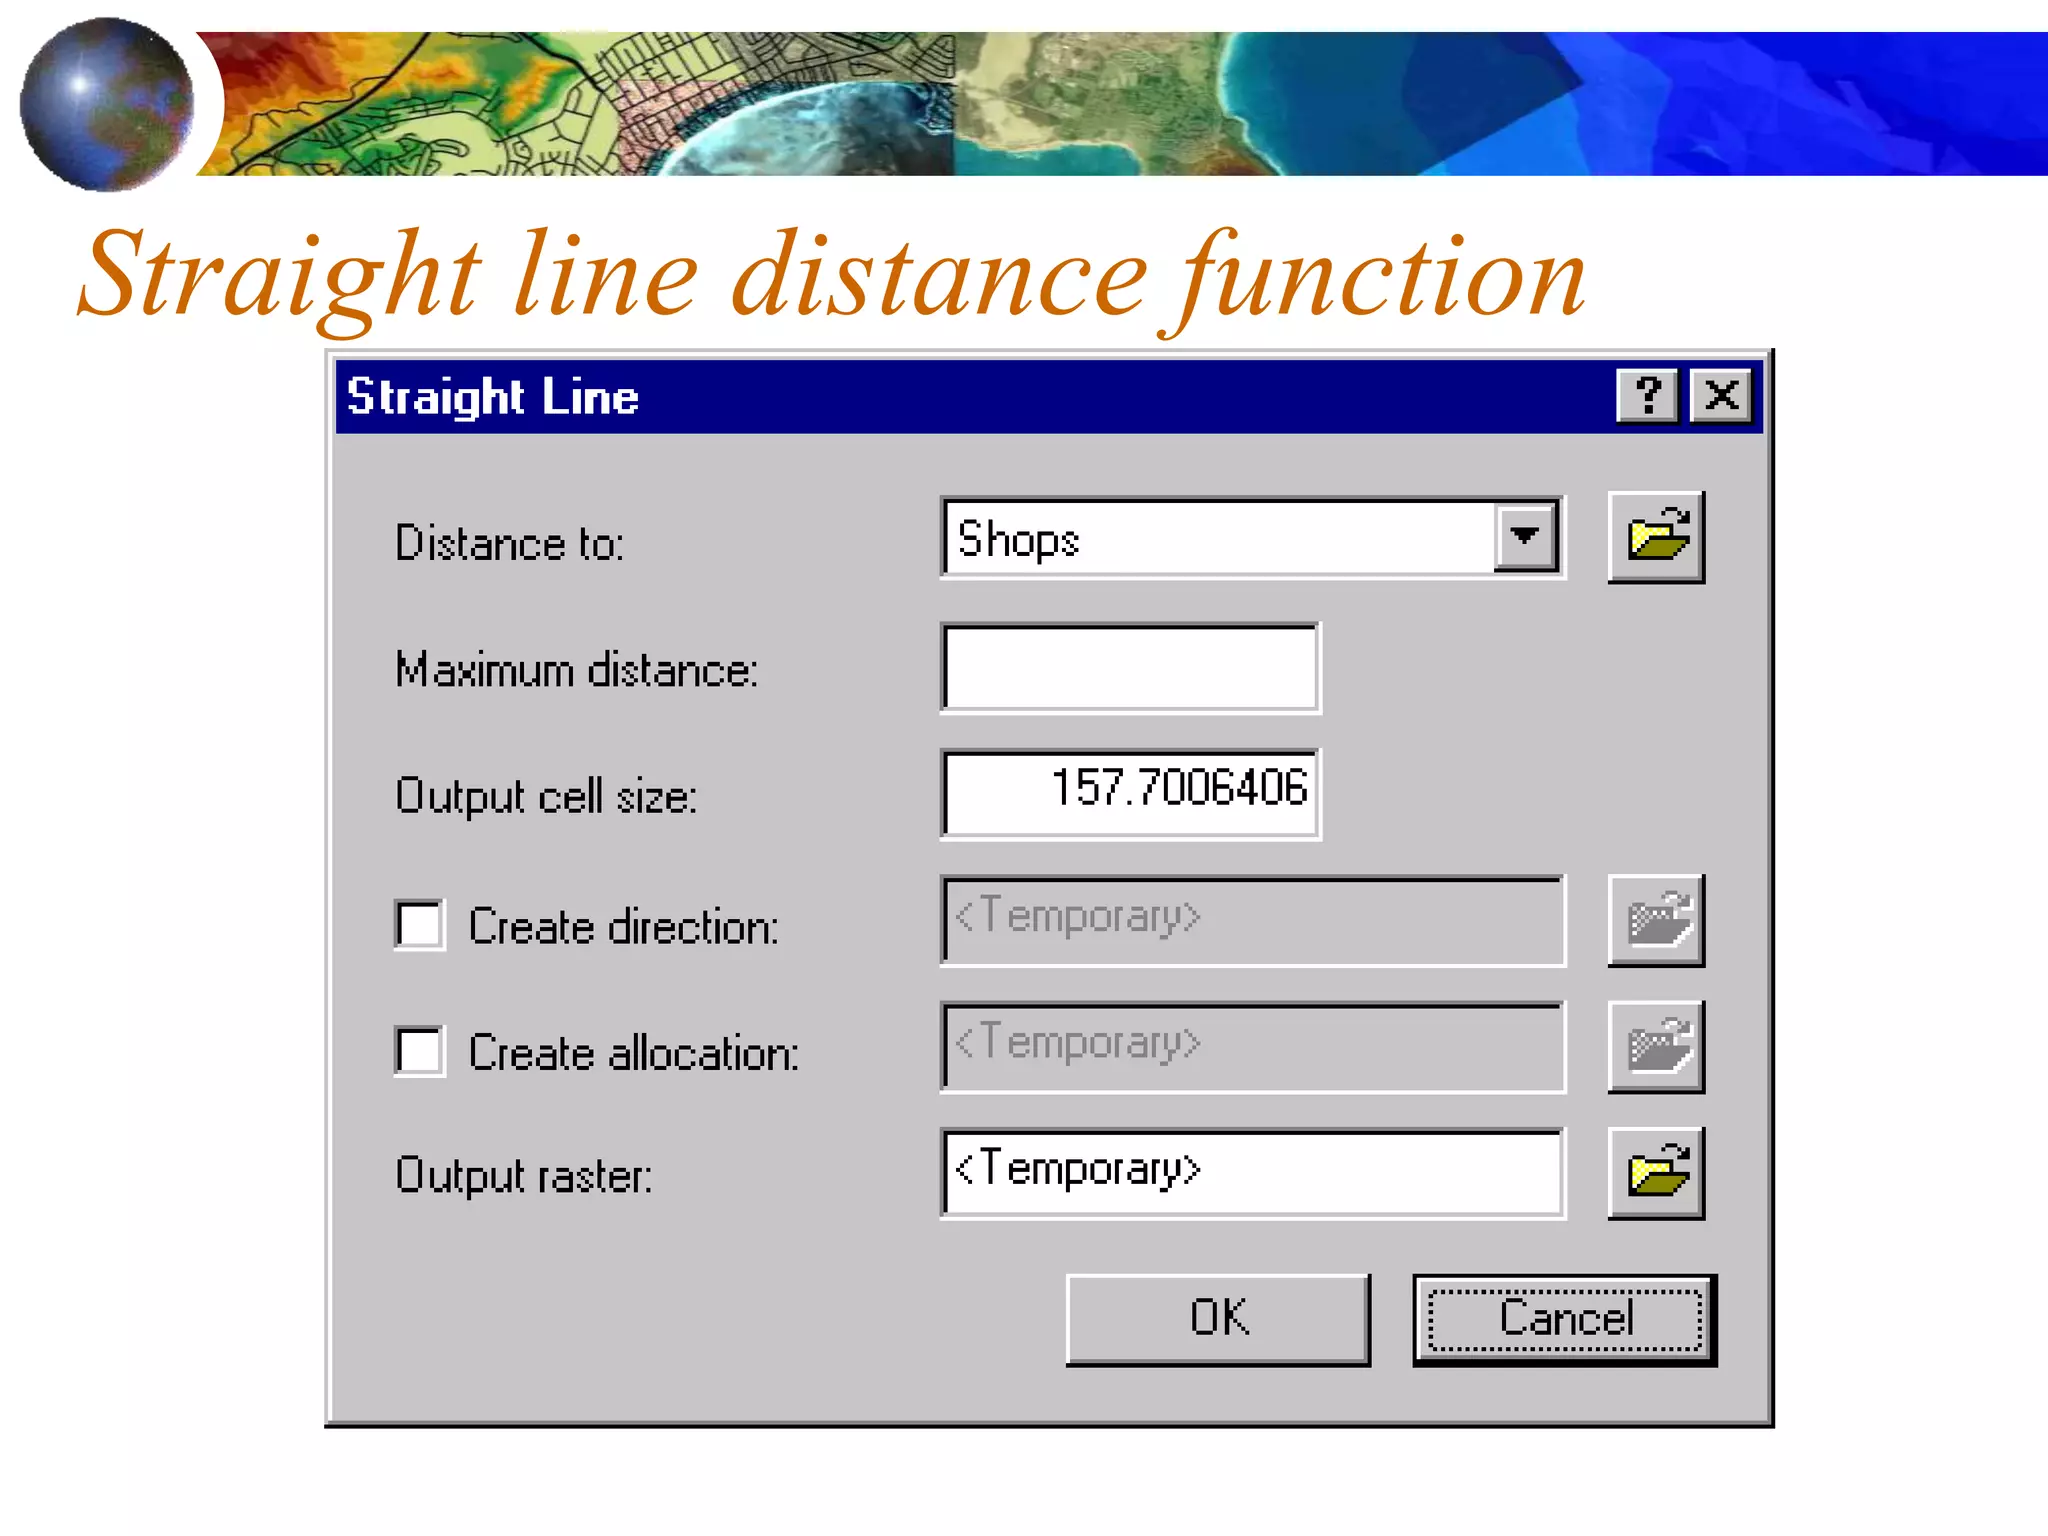
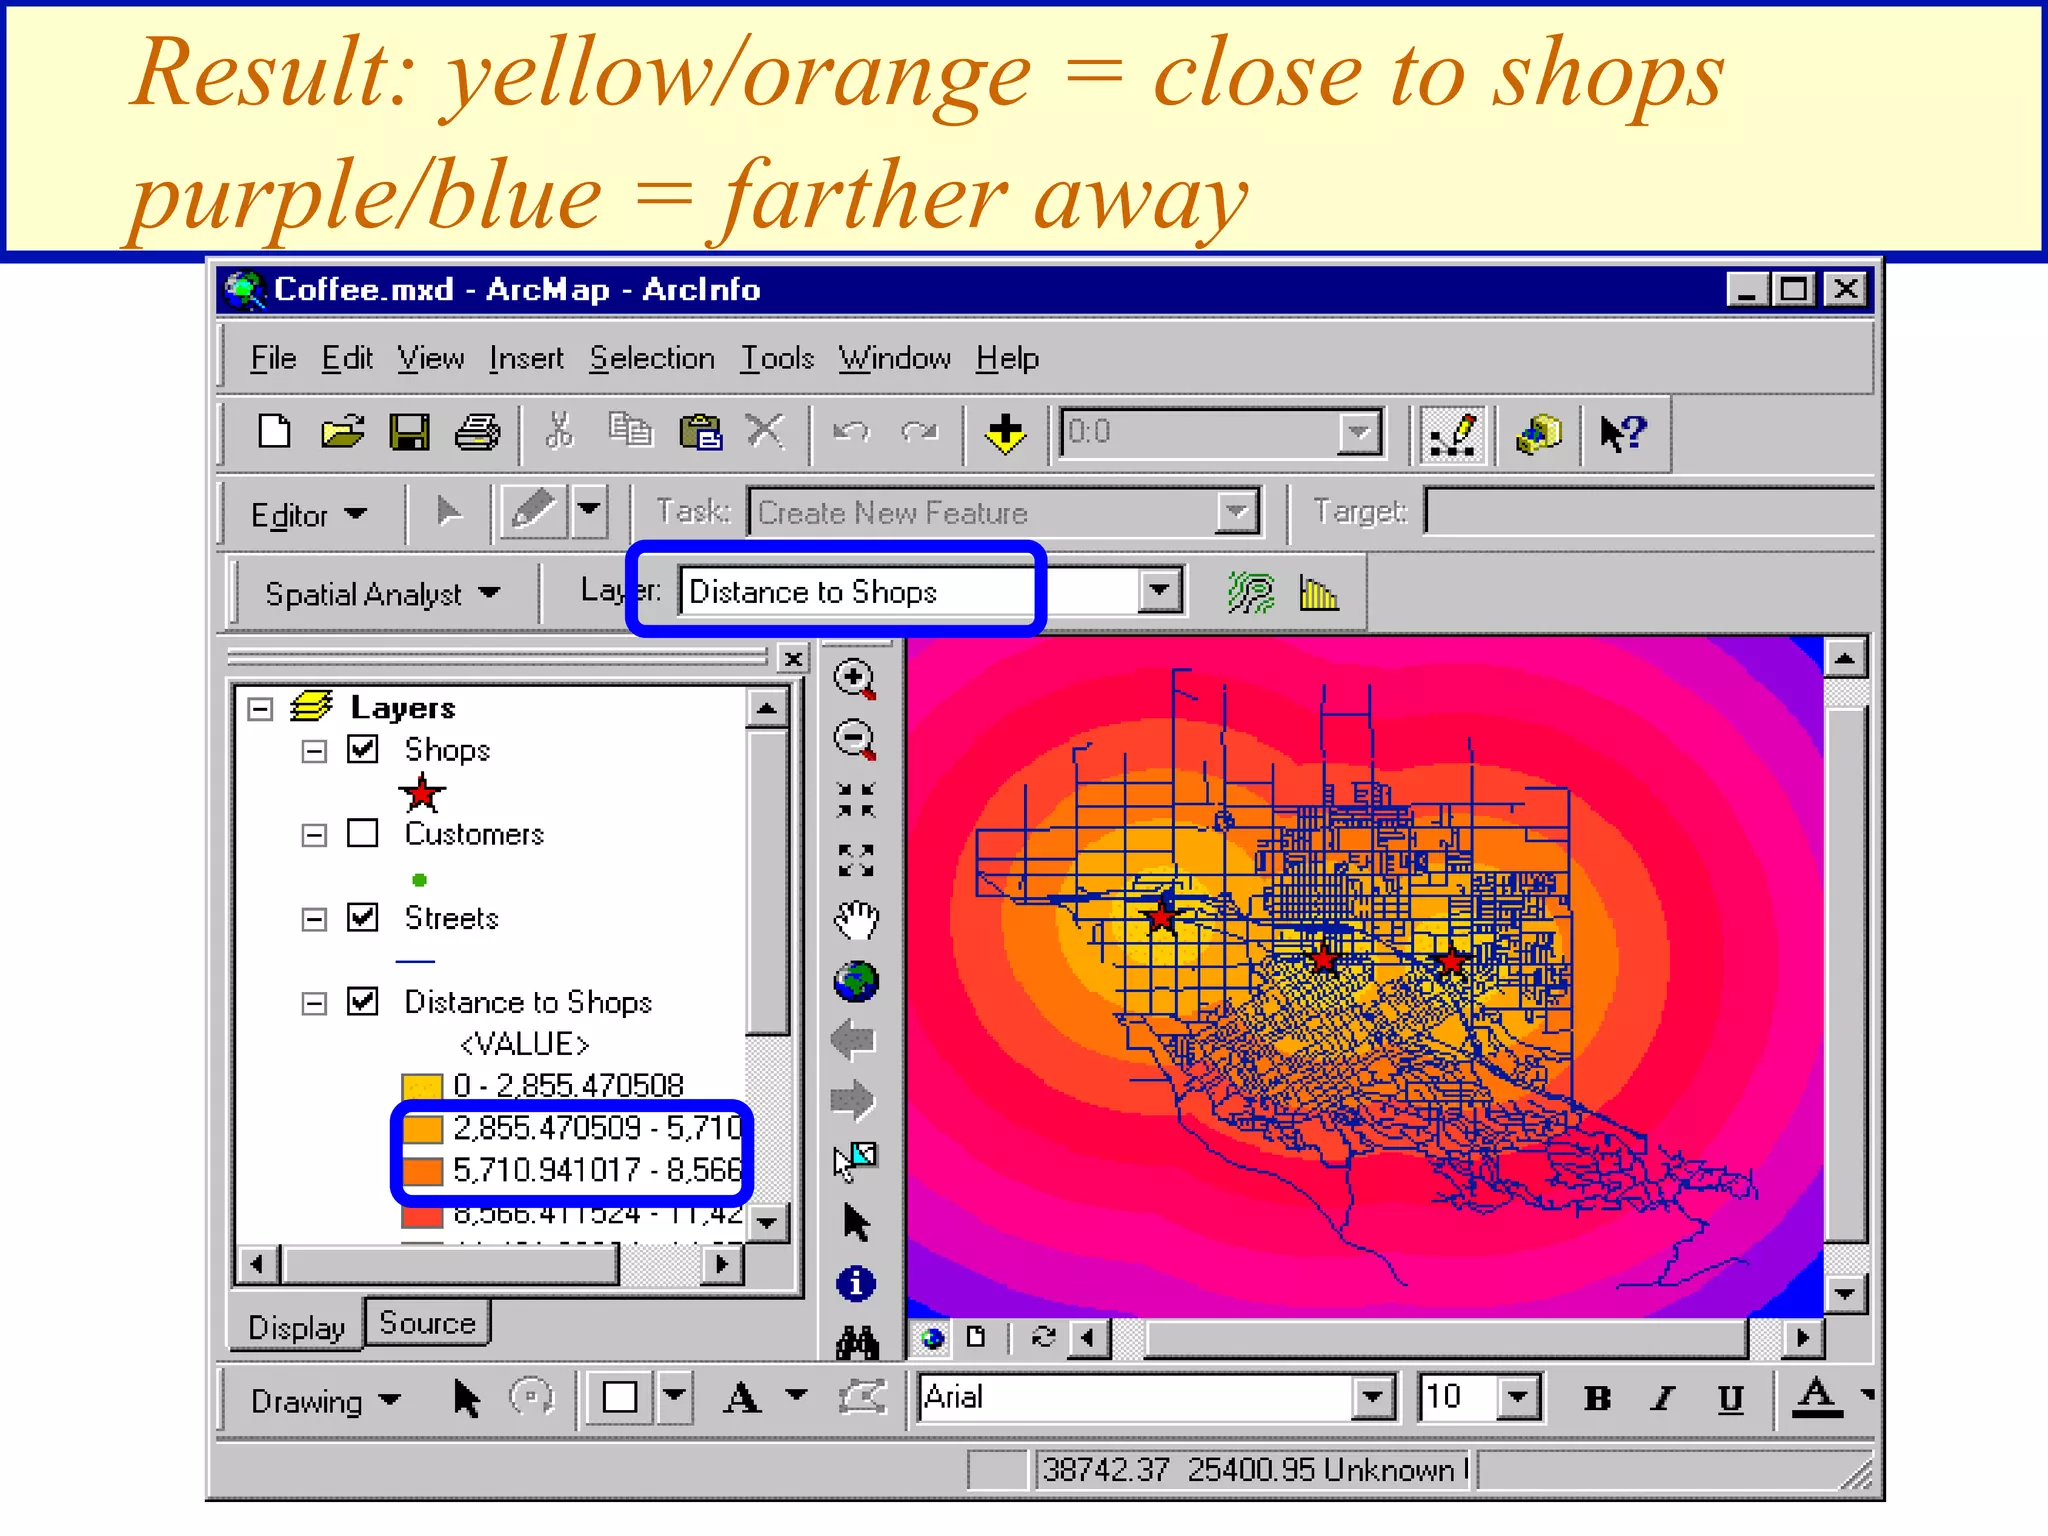
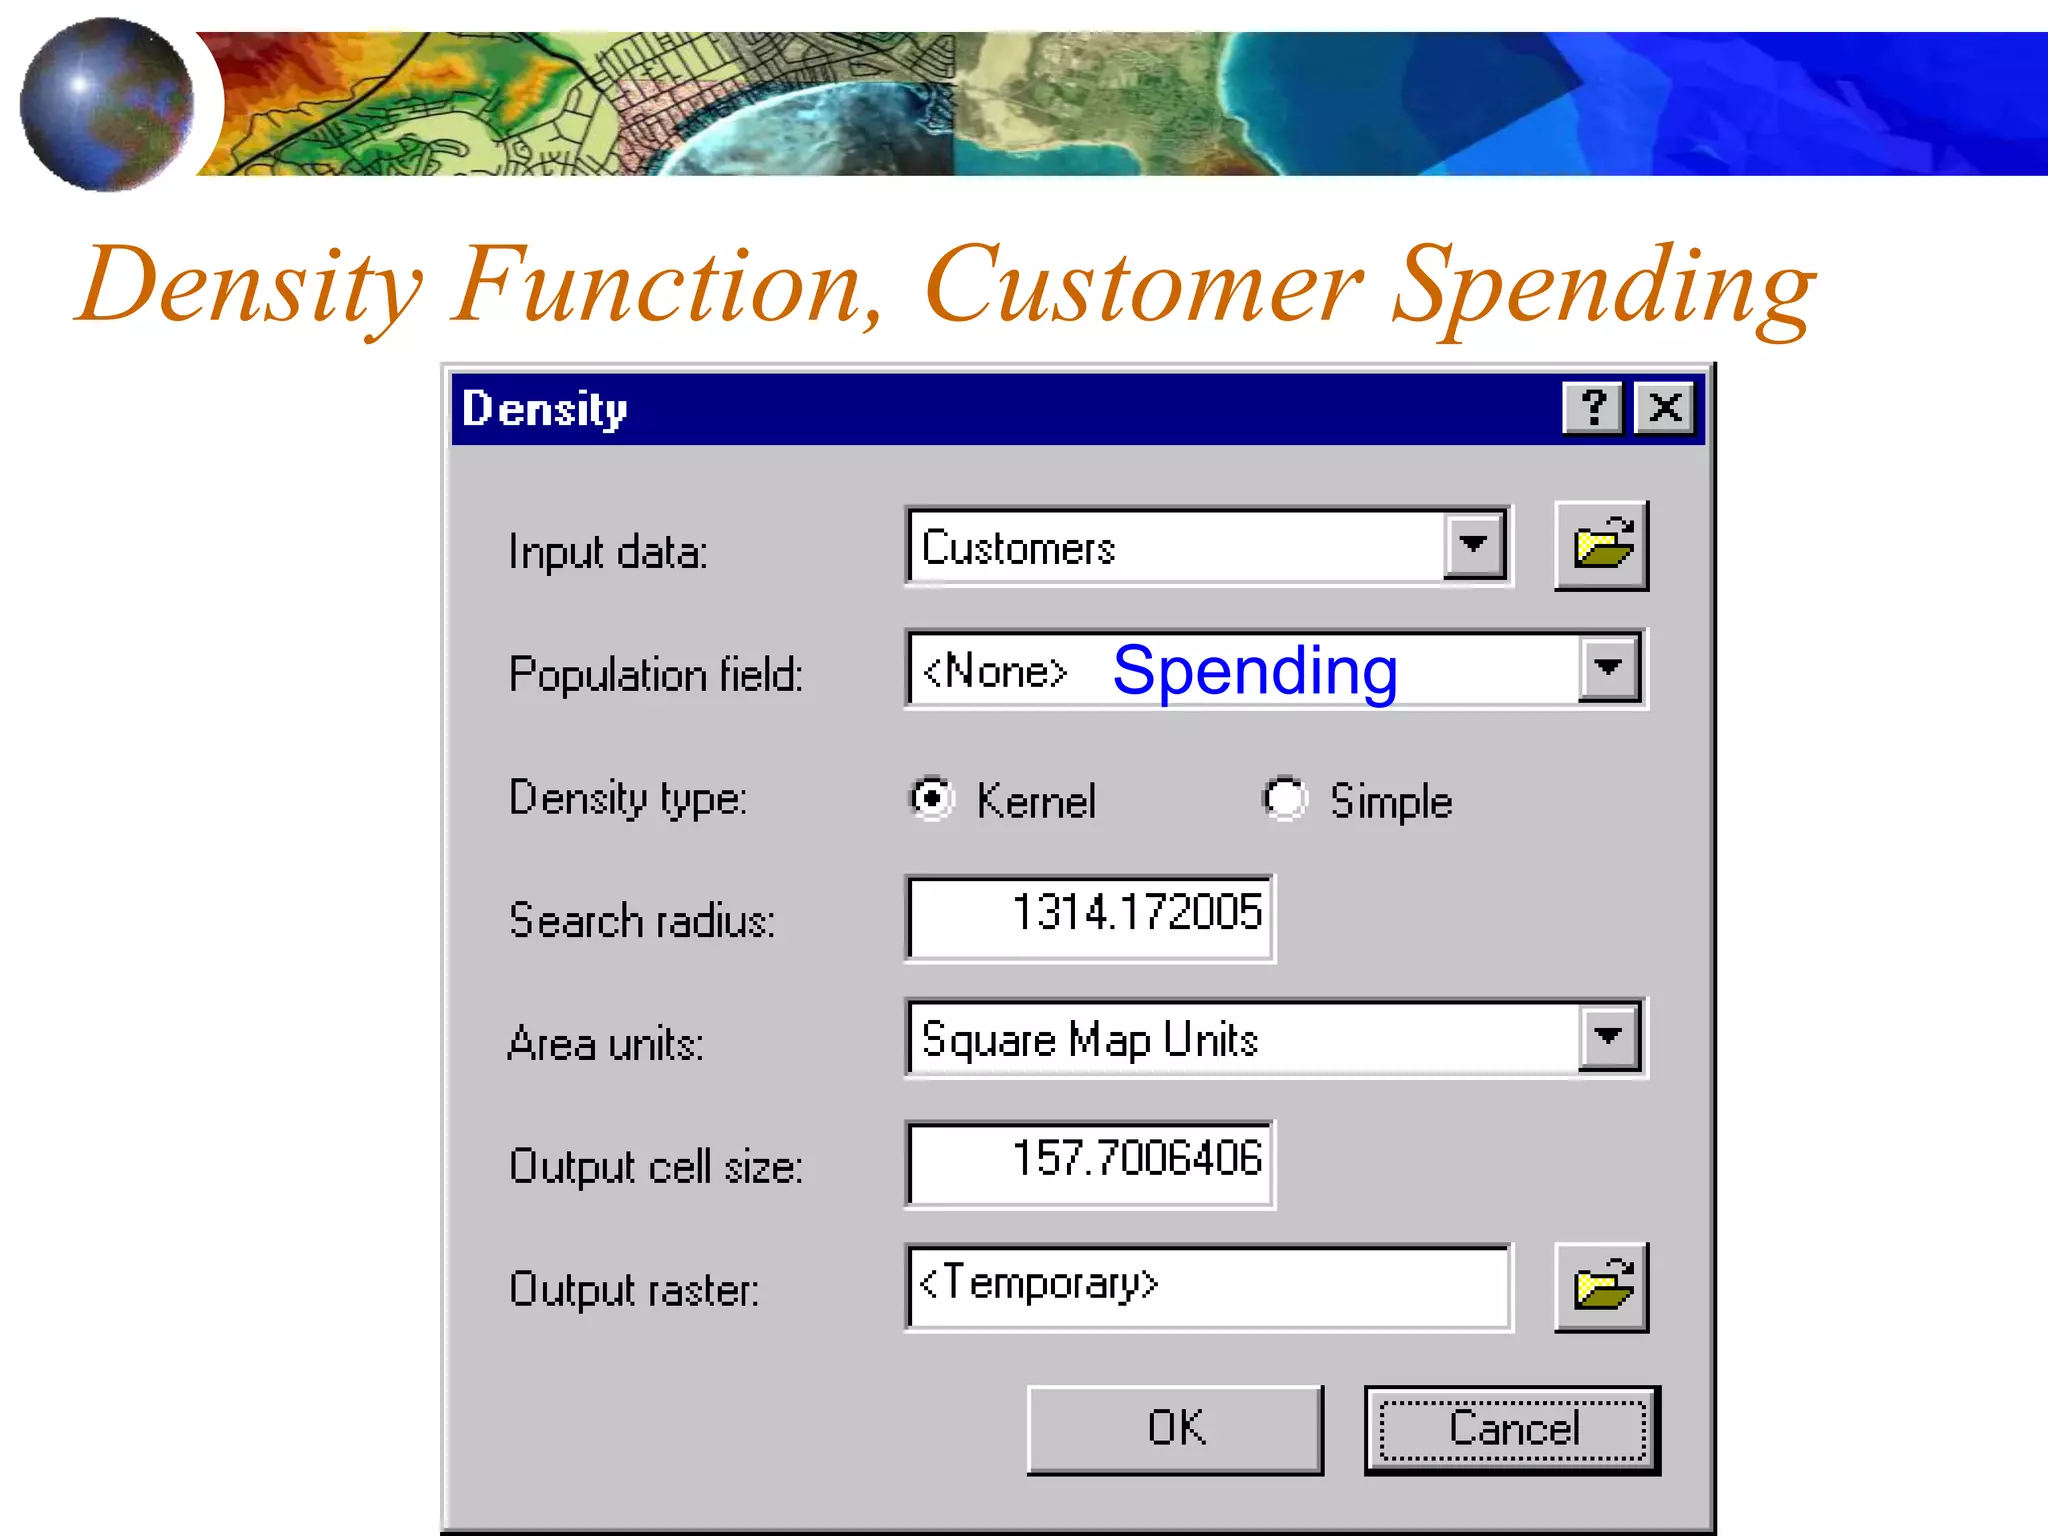
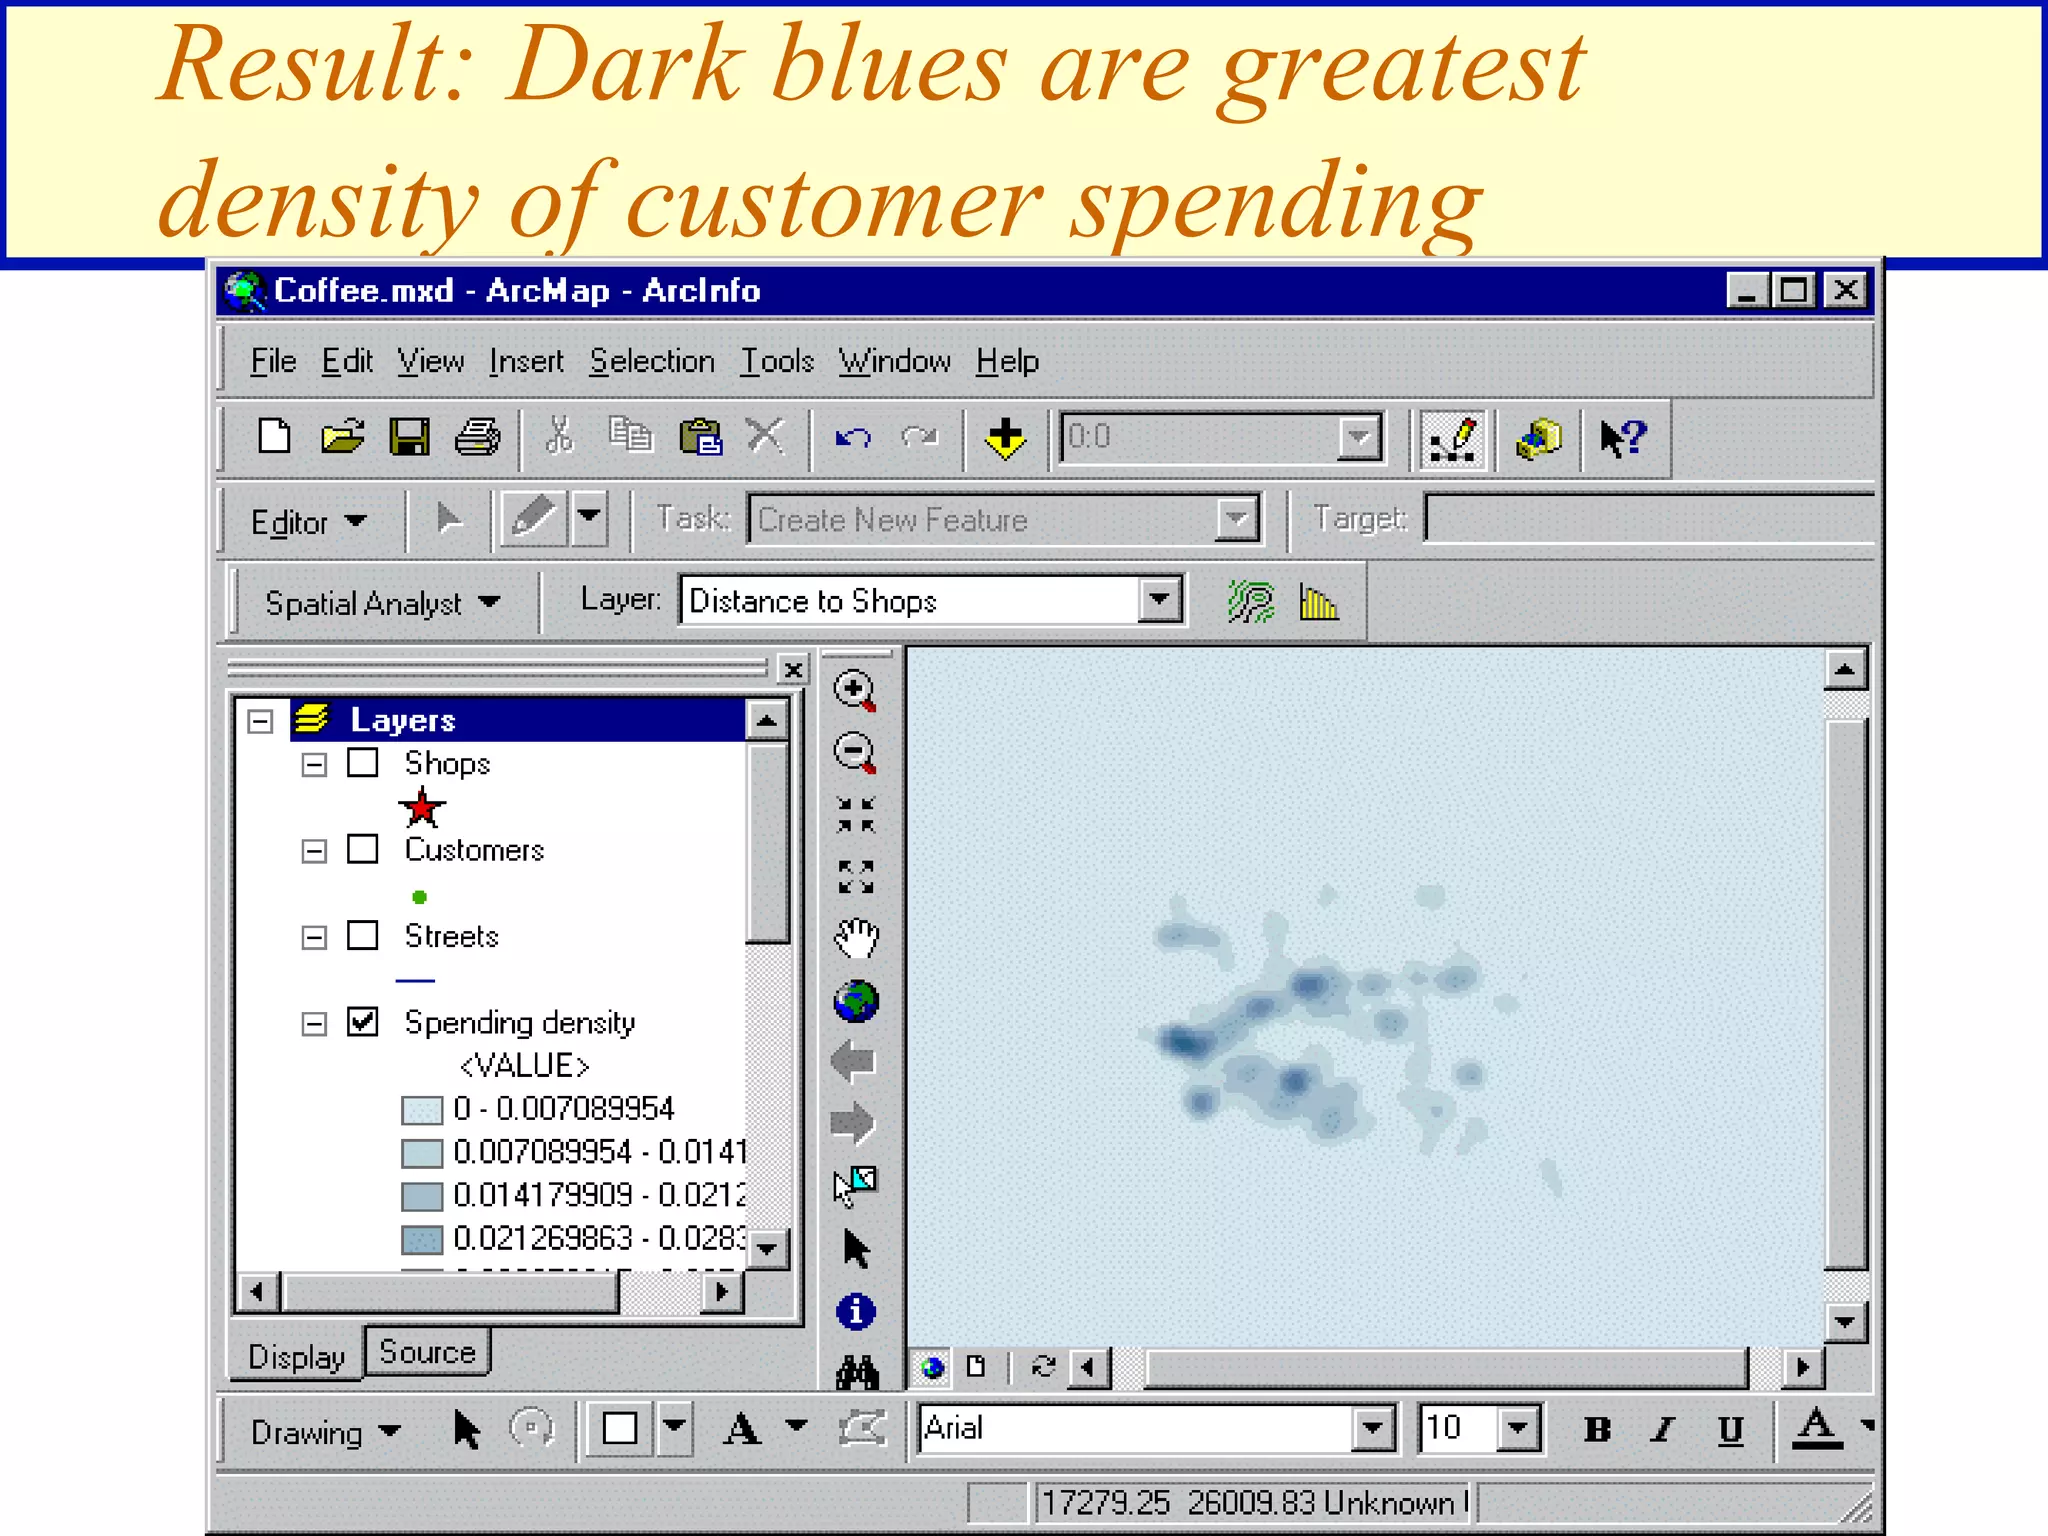
Location Analysis - coffee shops &
customers [optimization]](https://image.slidesharecdn.com/1112spatanalysis11-230519062204-2c087b21/75/spatial-analysis-8-2048.jpg)
![Instead of hillshade, use raster calculator
[pH surface] > 7
pH surface](https://image.slidesharecdn.com/1112spatanalysis11-230519062204-2c087b21/75/spatial-analysis-14-2048.jpg)

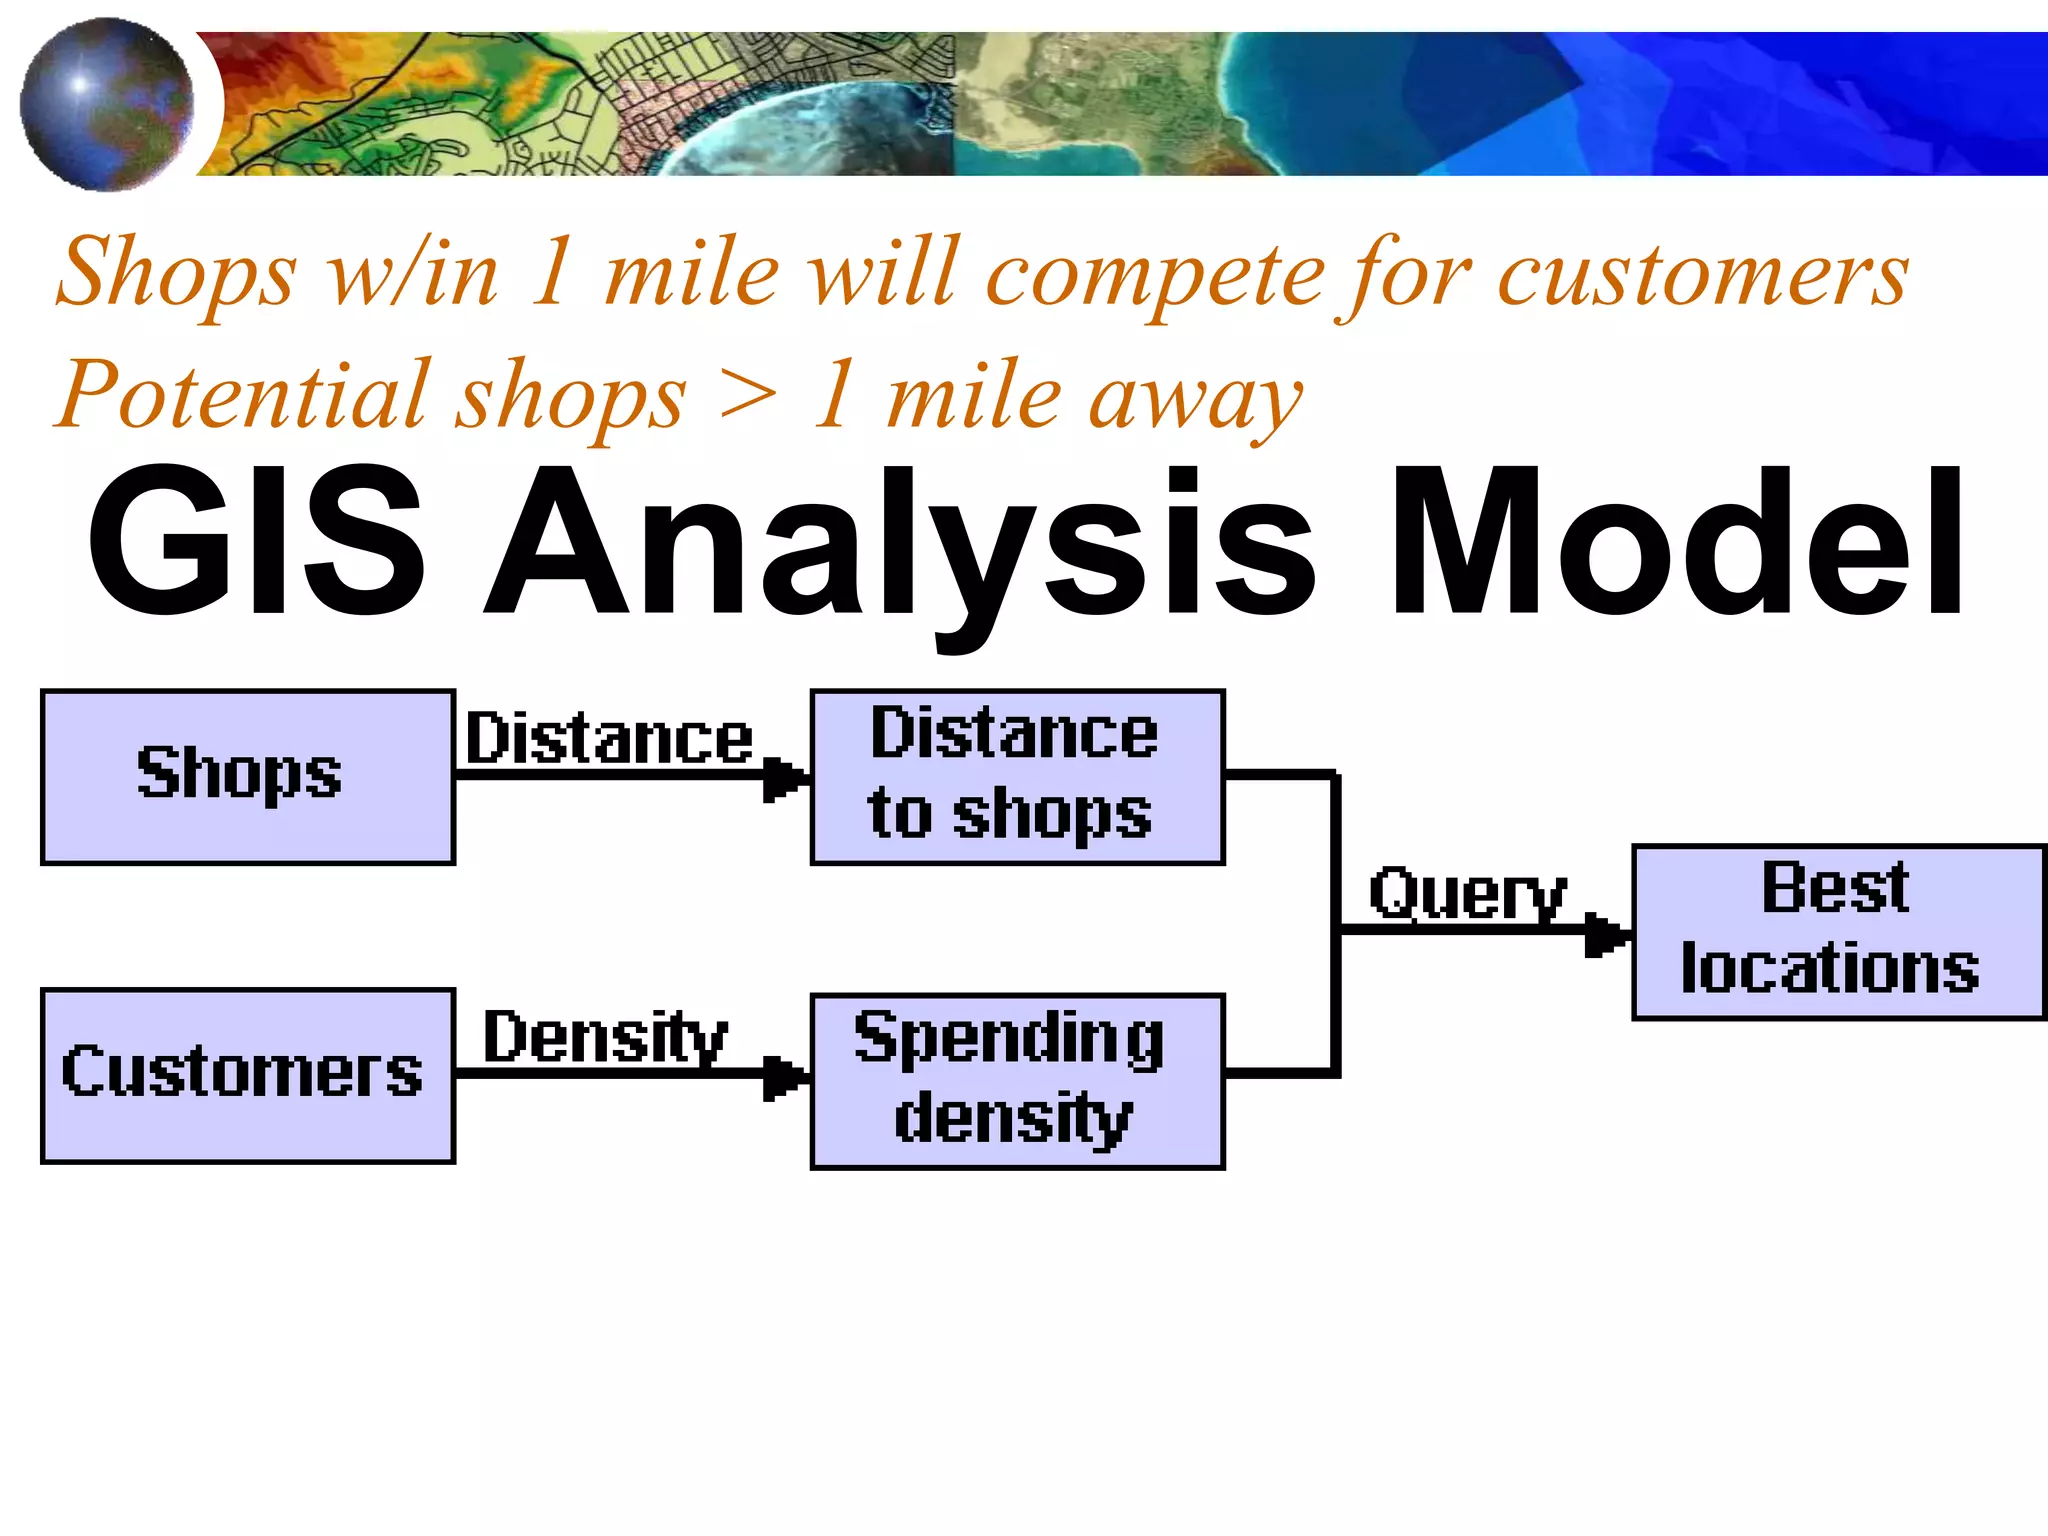
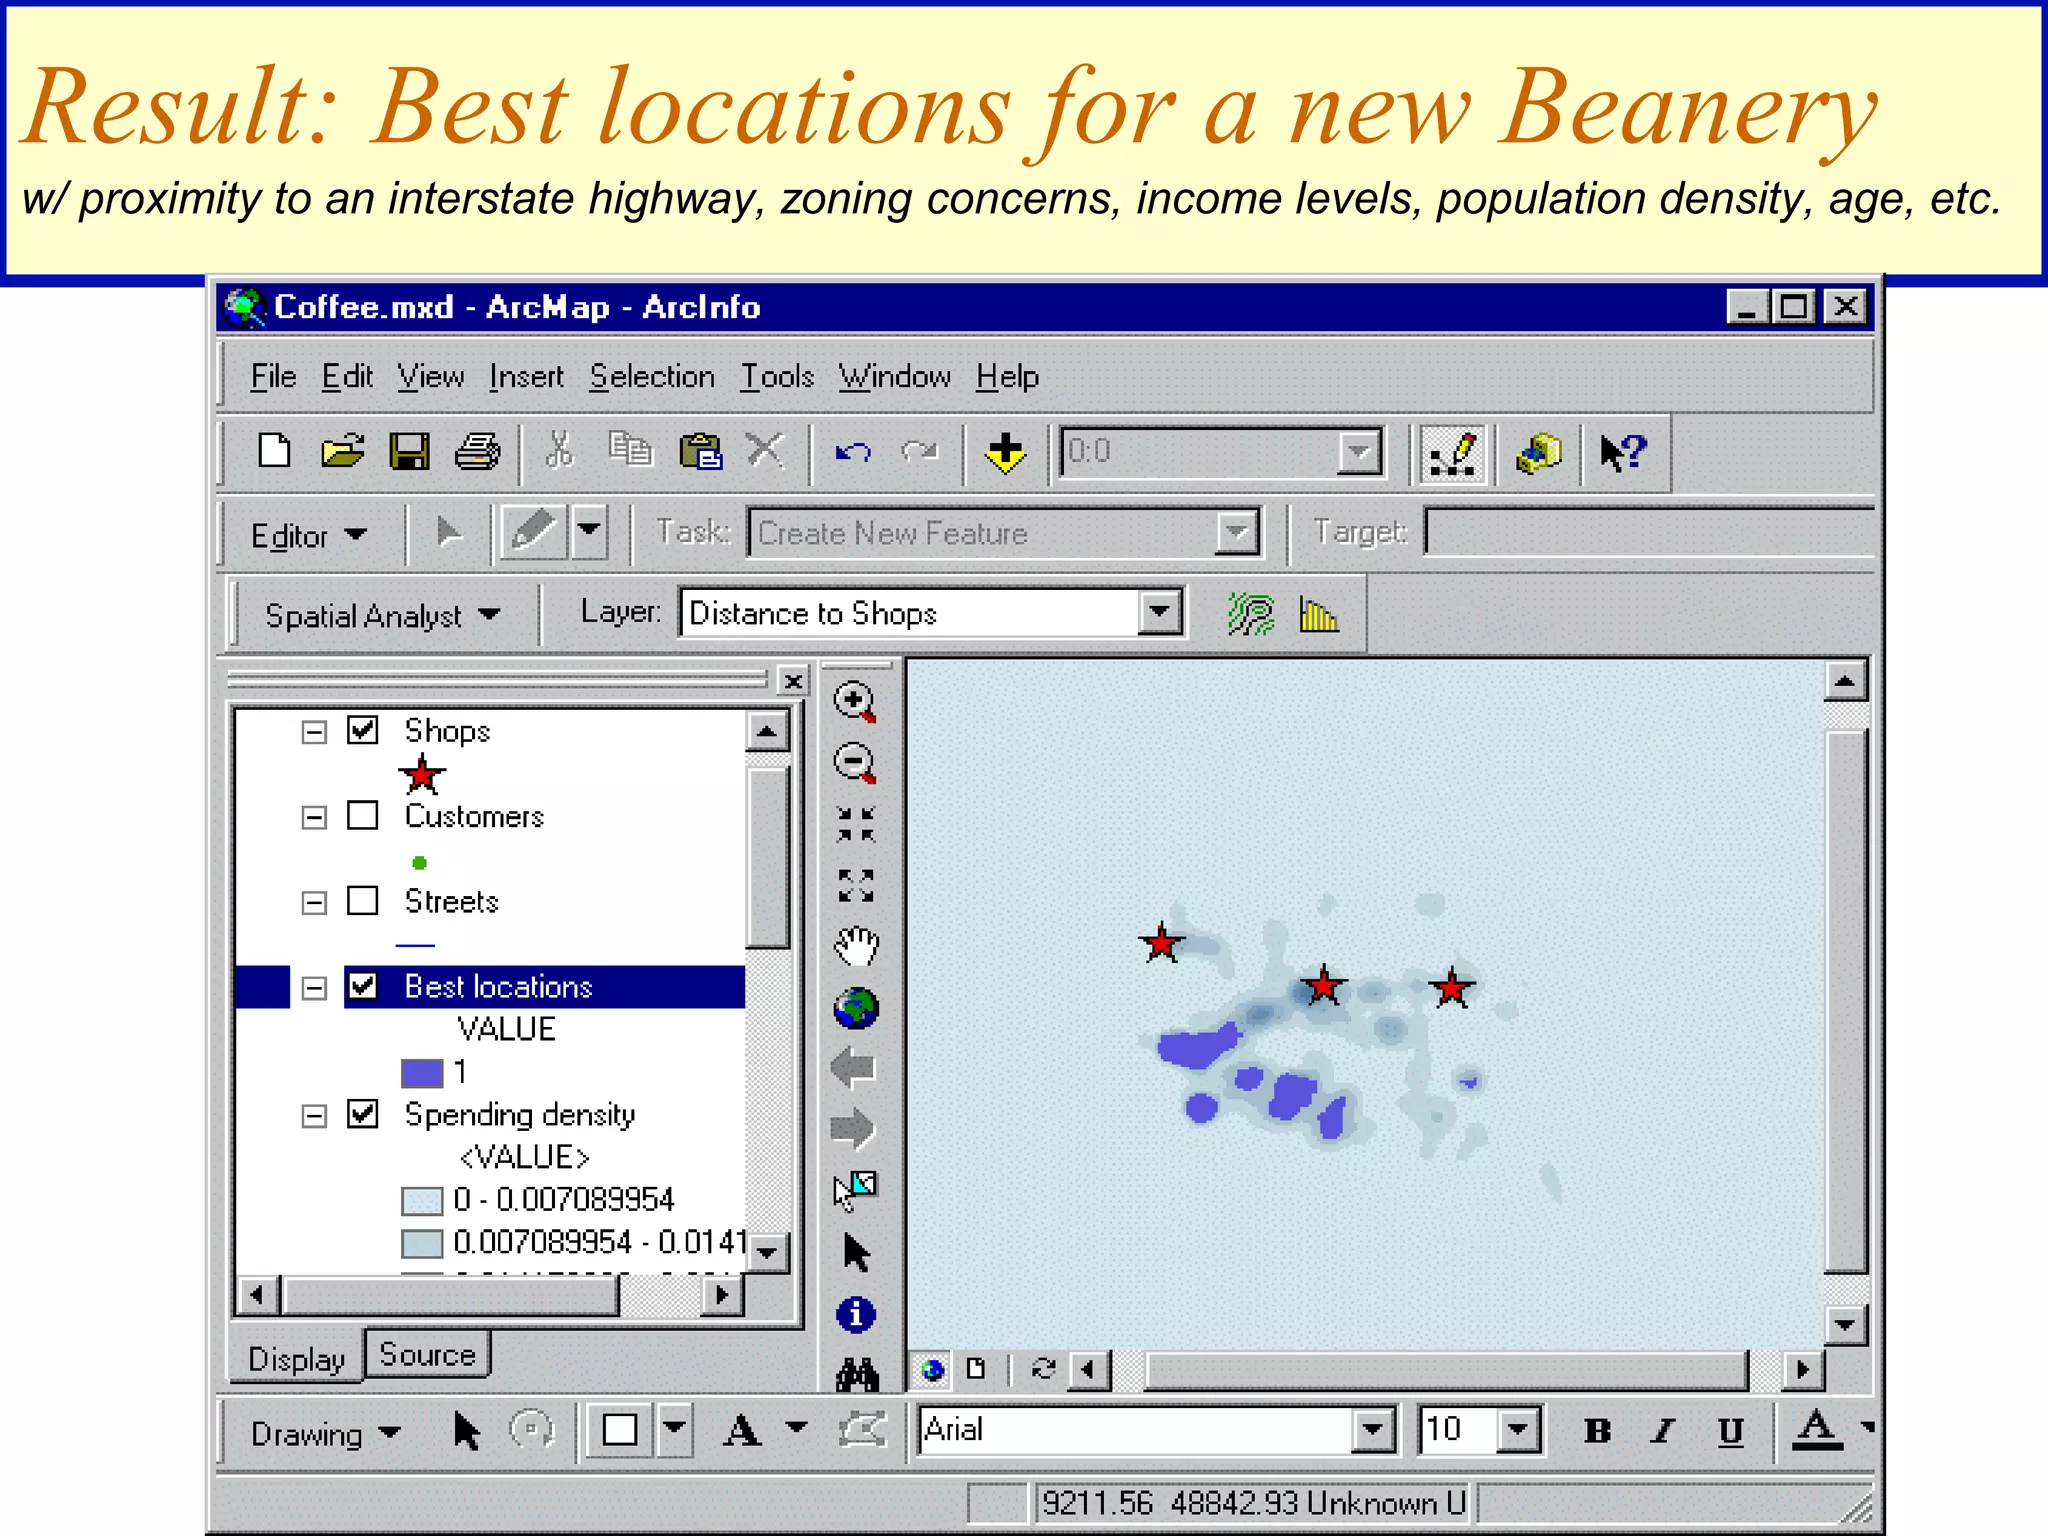
![Find areas 1 mile from an existing shop that are
also in a high spending density customer area
([Distance to Shops] > 5280) &
([Spending density] > .02)
Spending density](https://image.slidesharecdn.com/1112spatanalysis11-230519062204-2c087b21/75/spatial-analysis-25-2048.jpg)