Downloaded 802 times
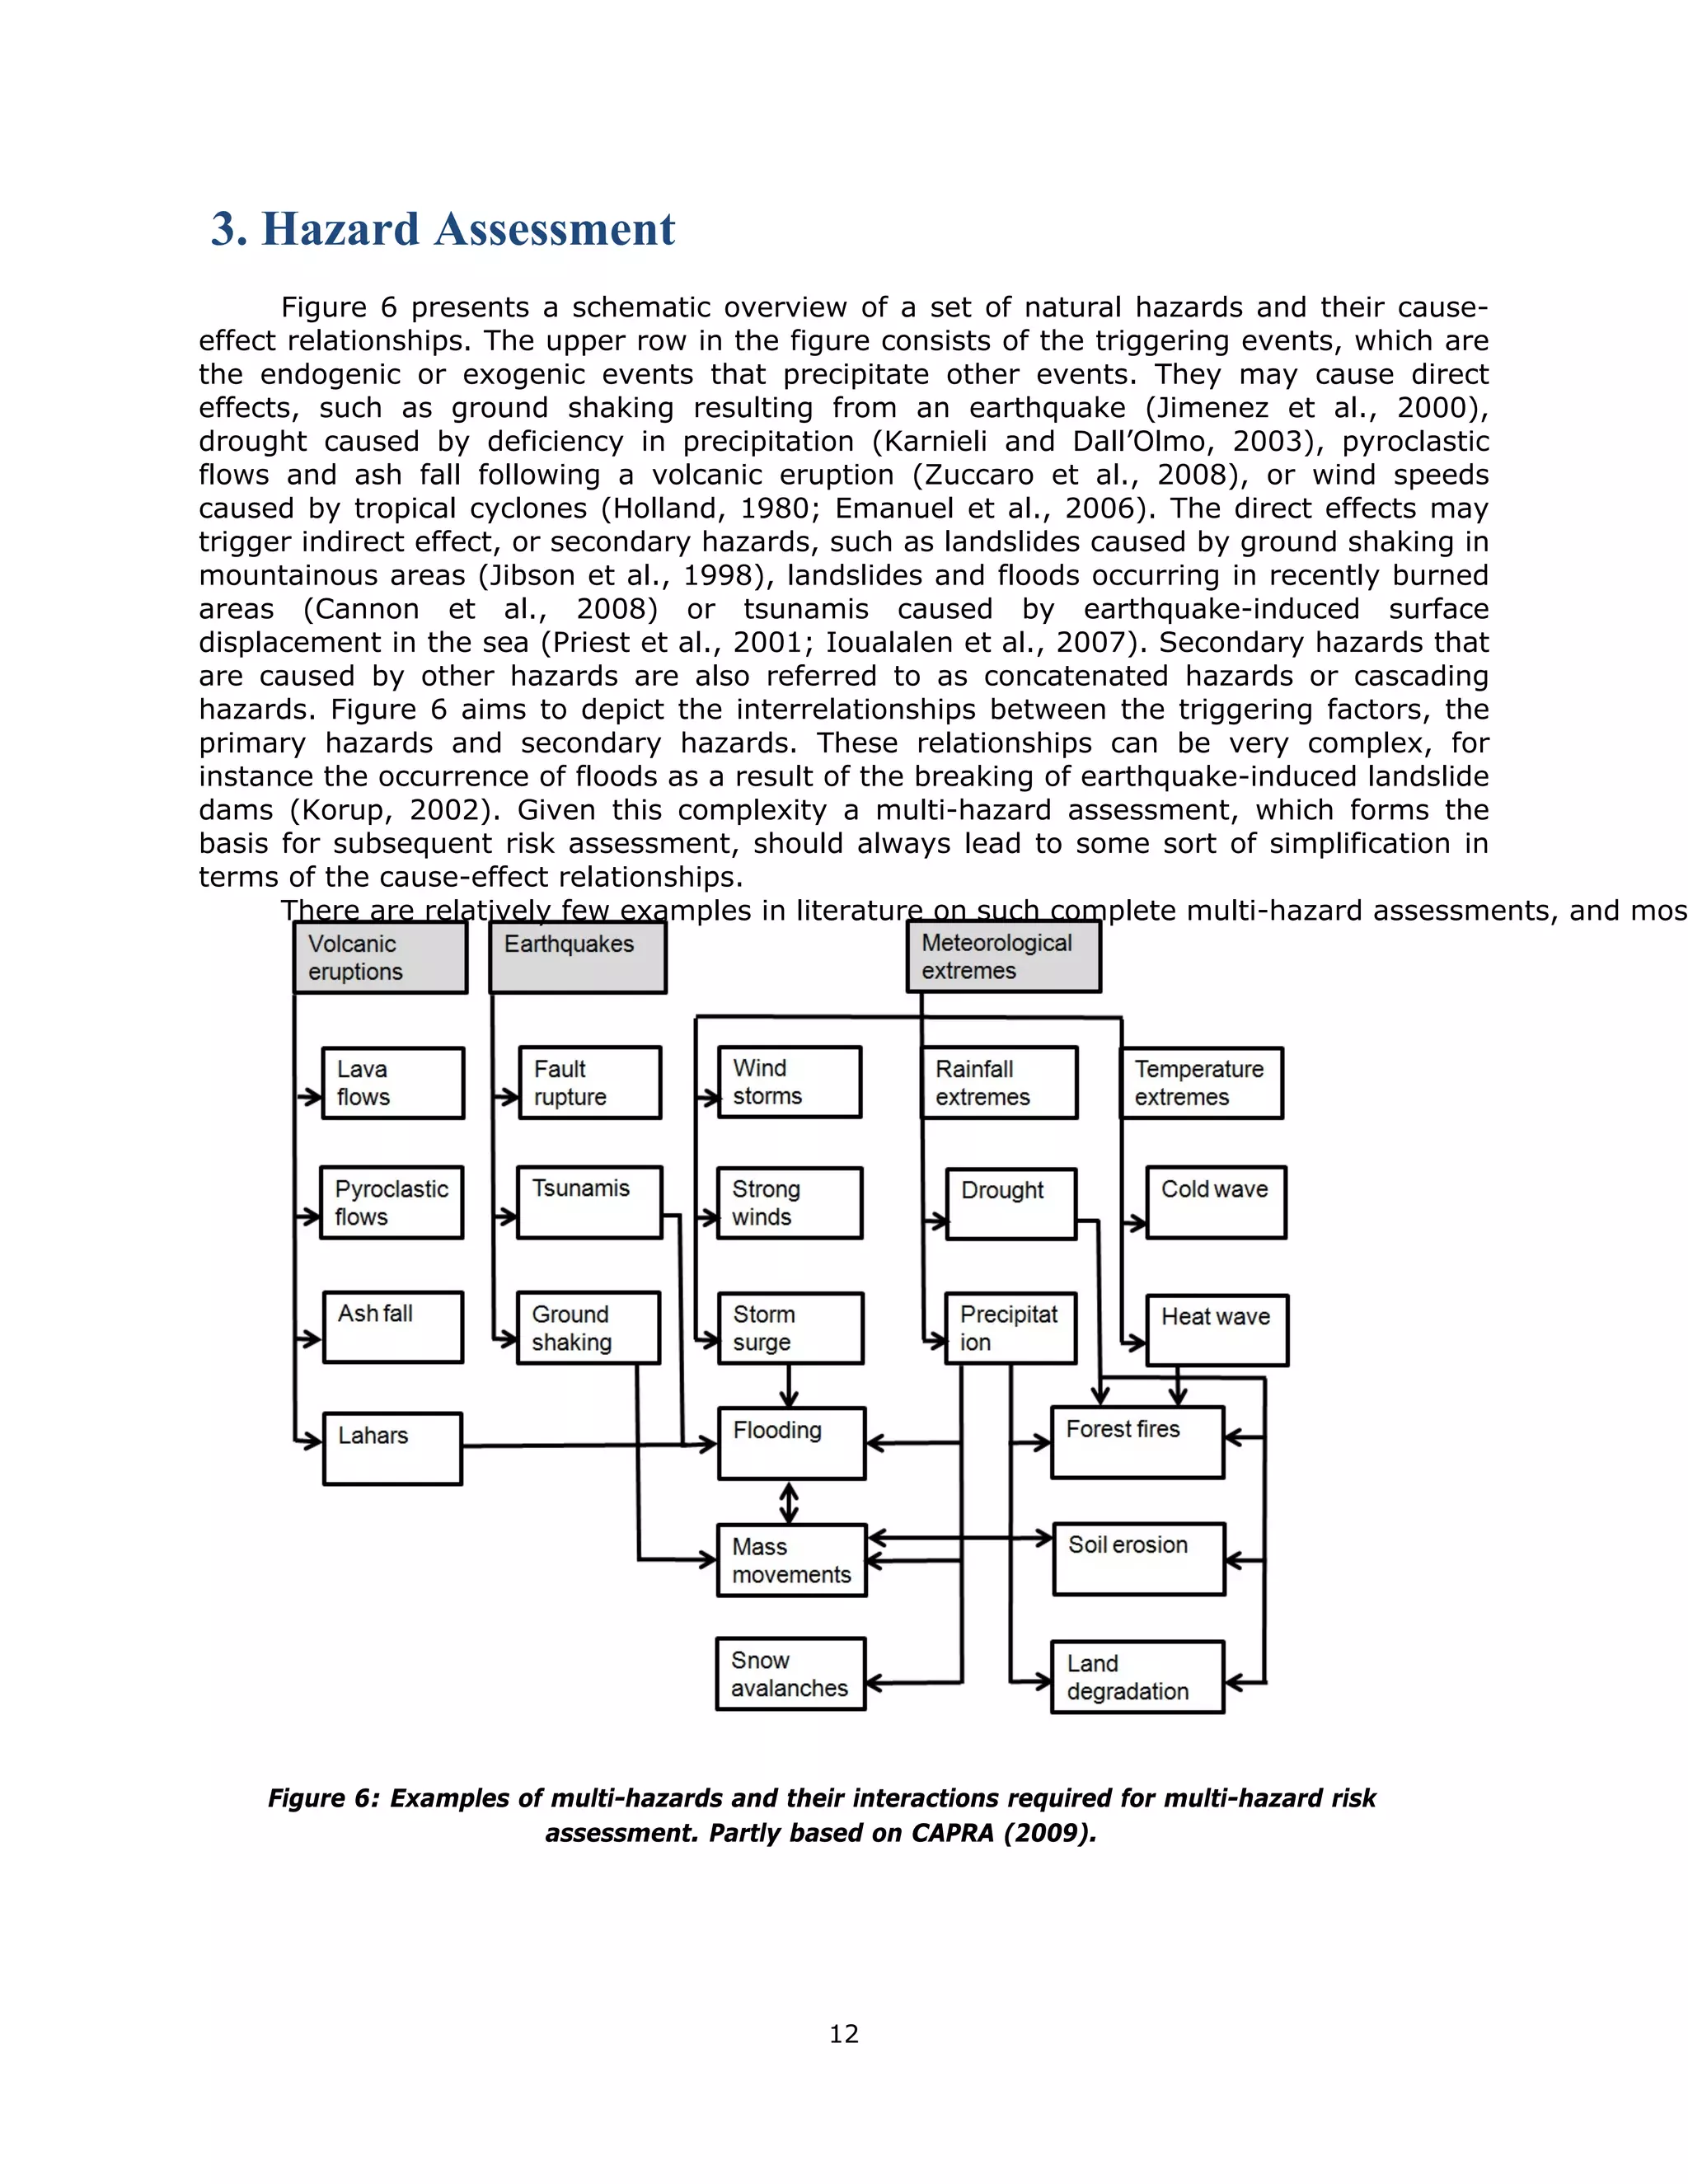
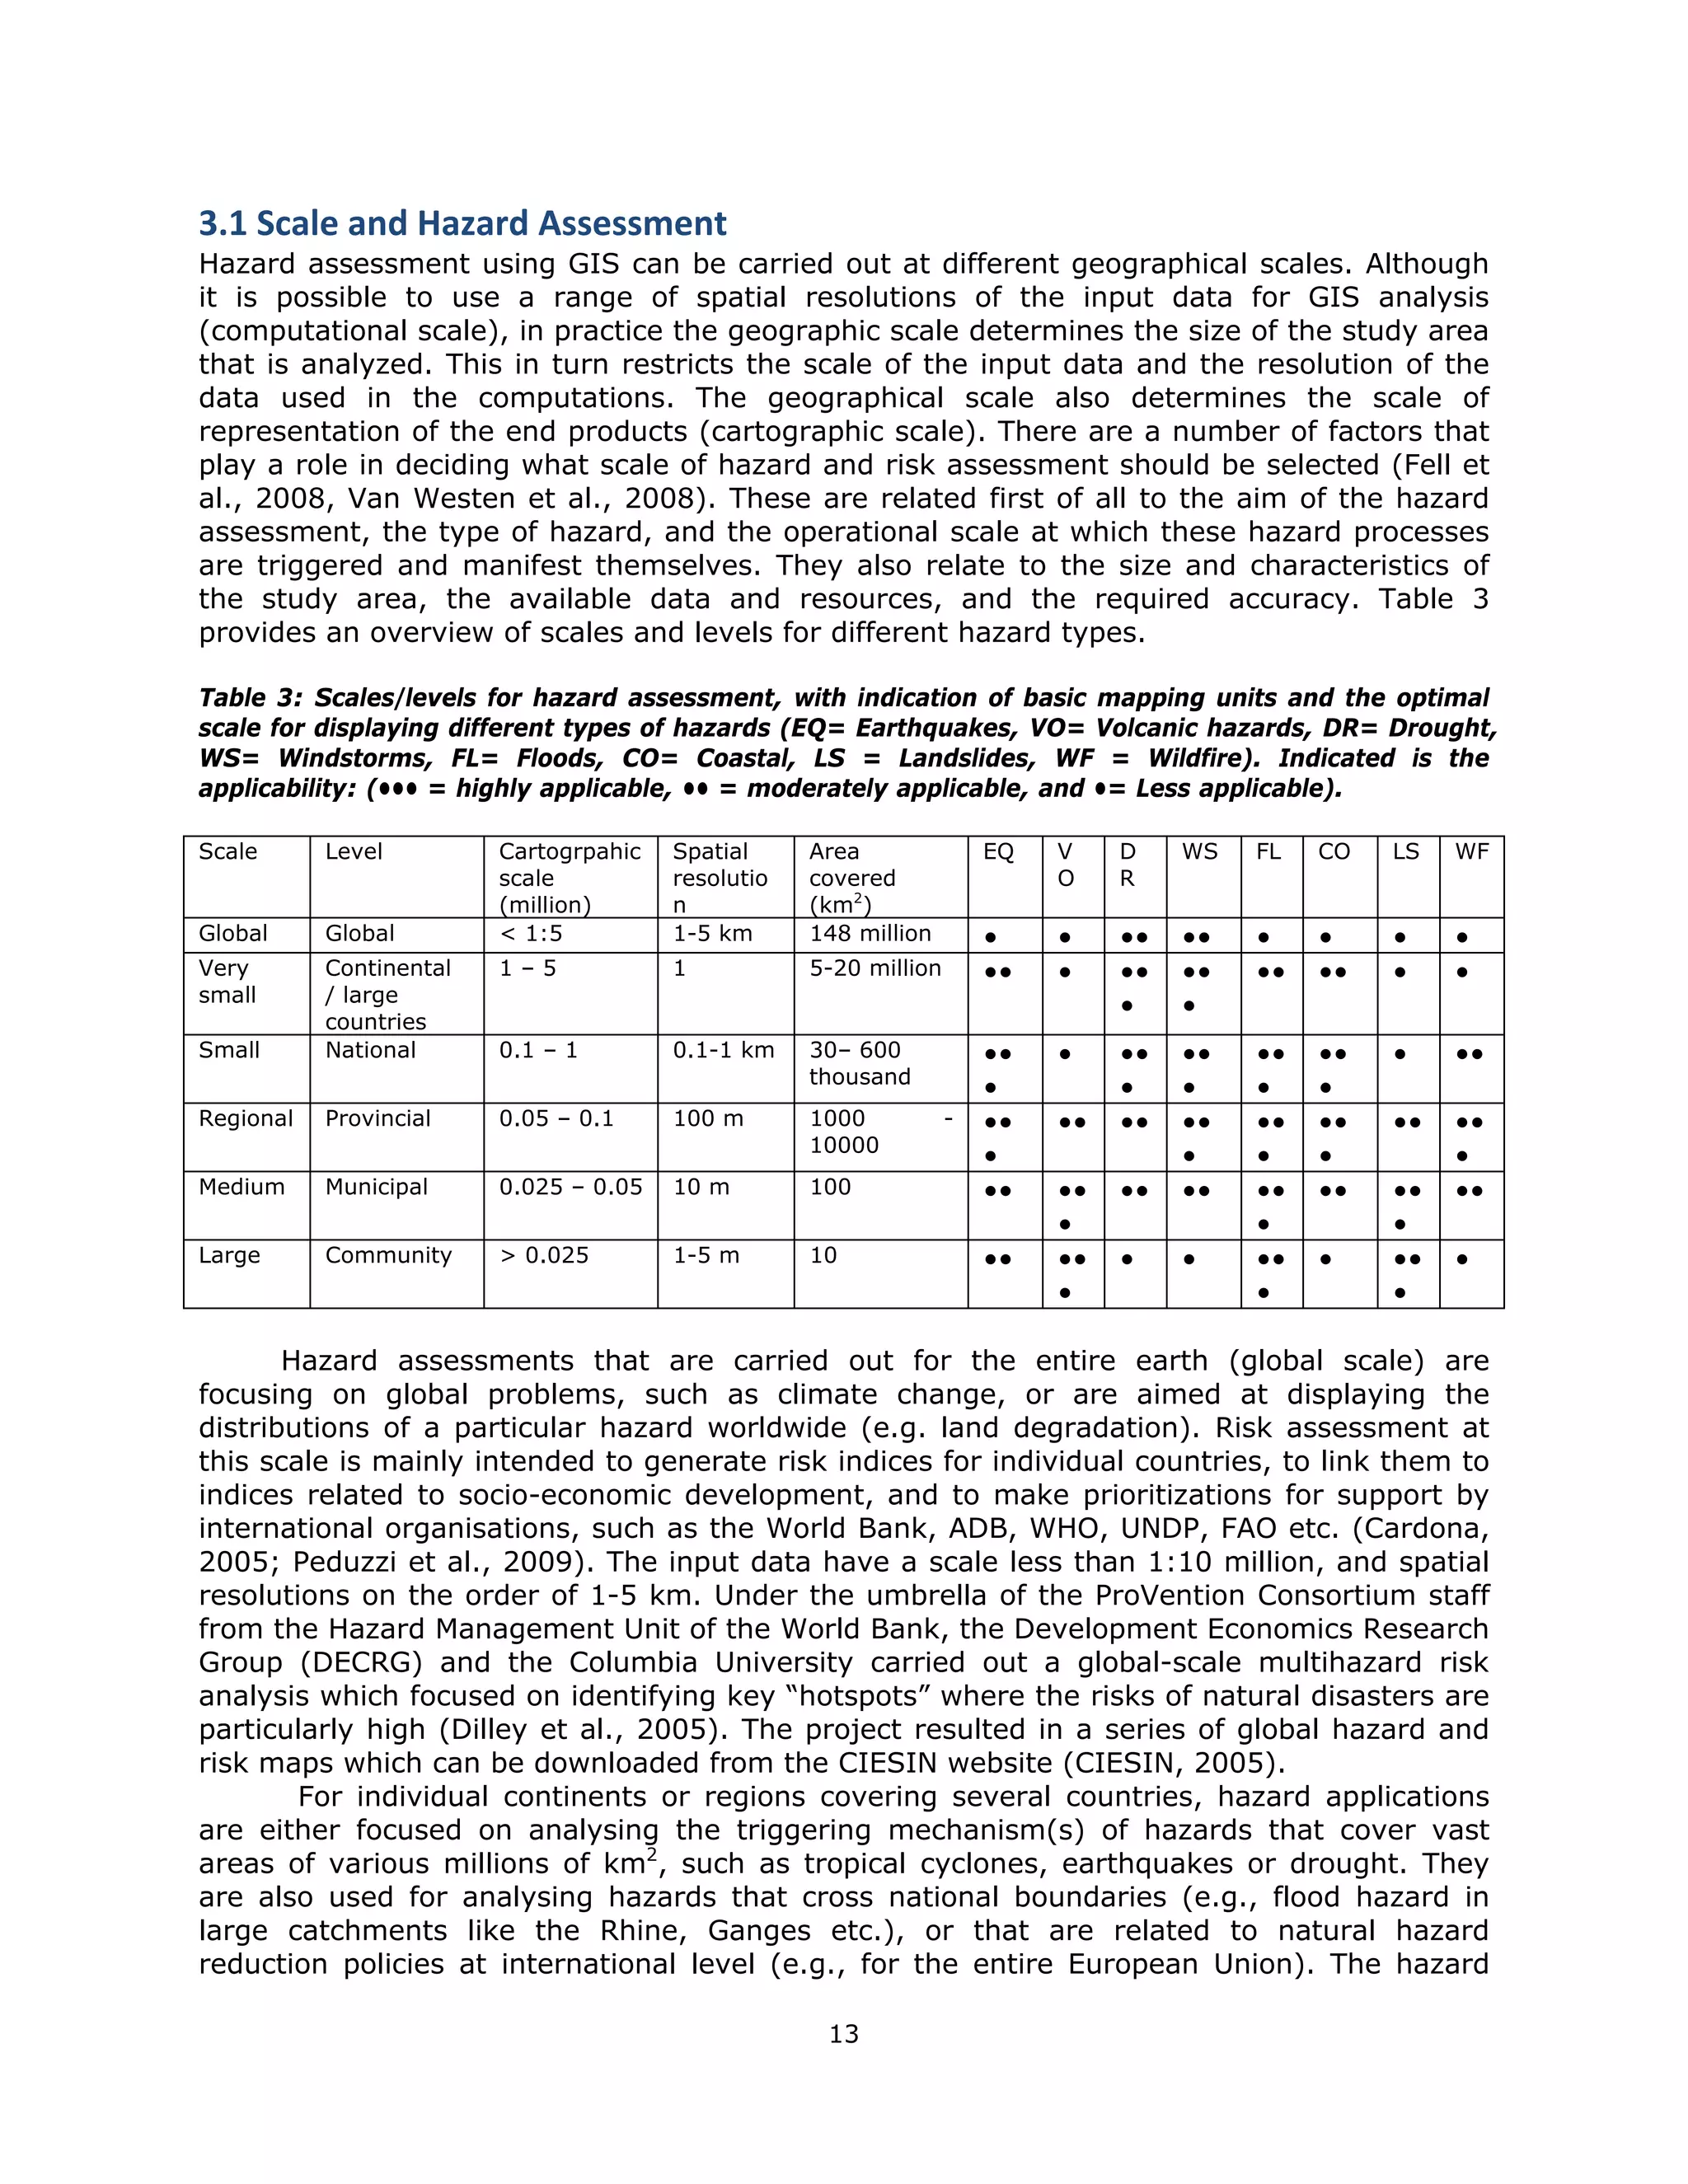
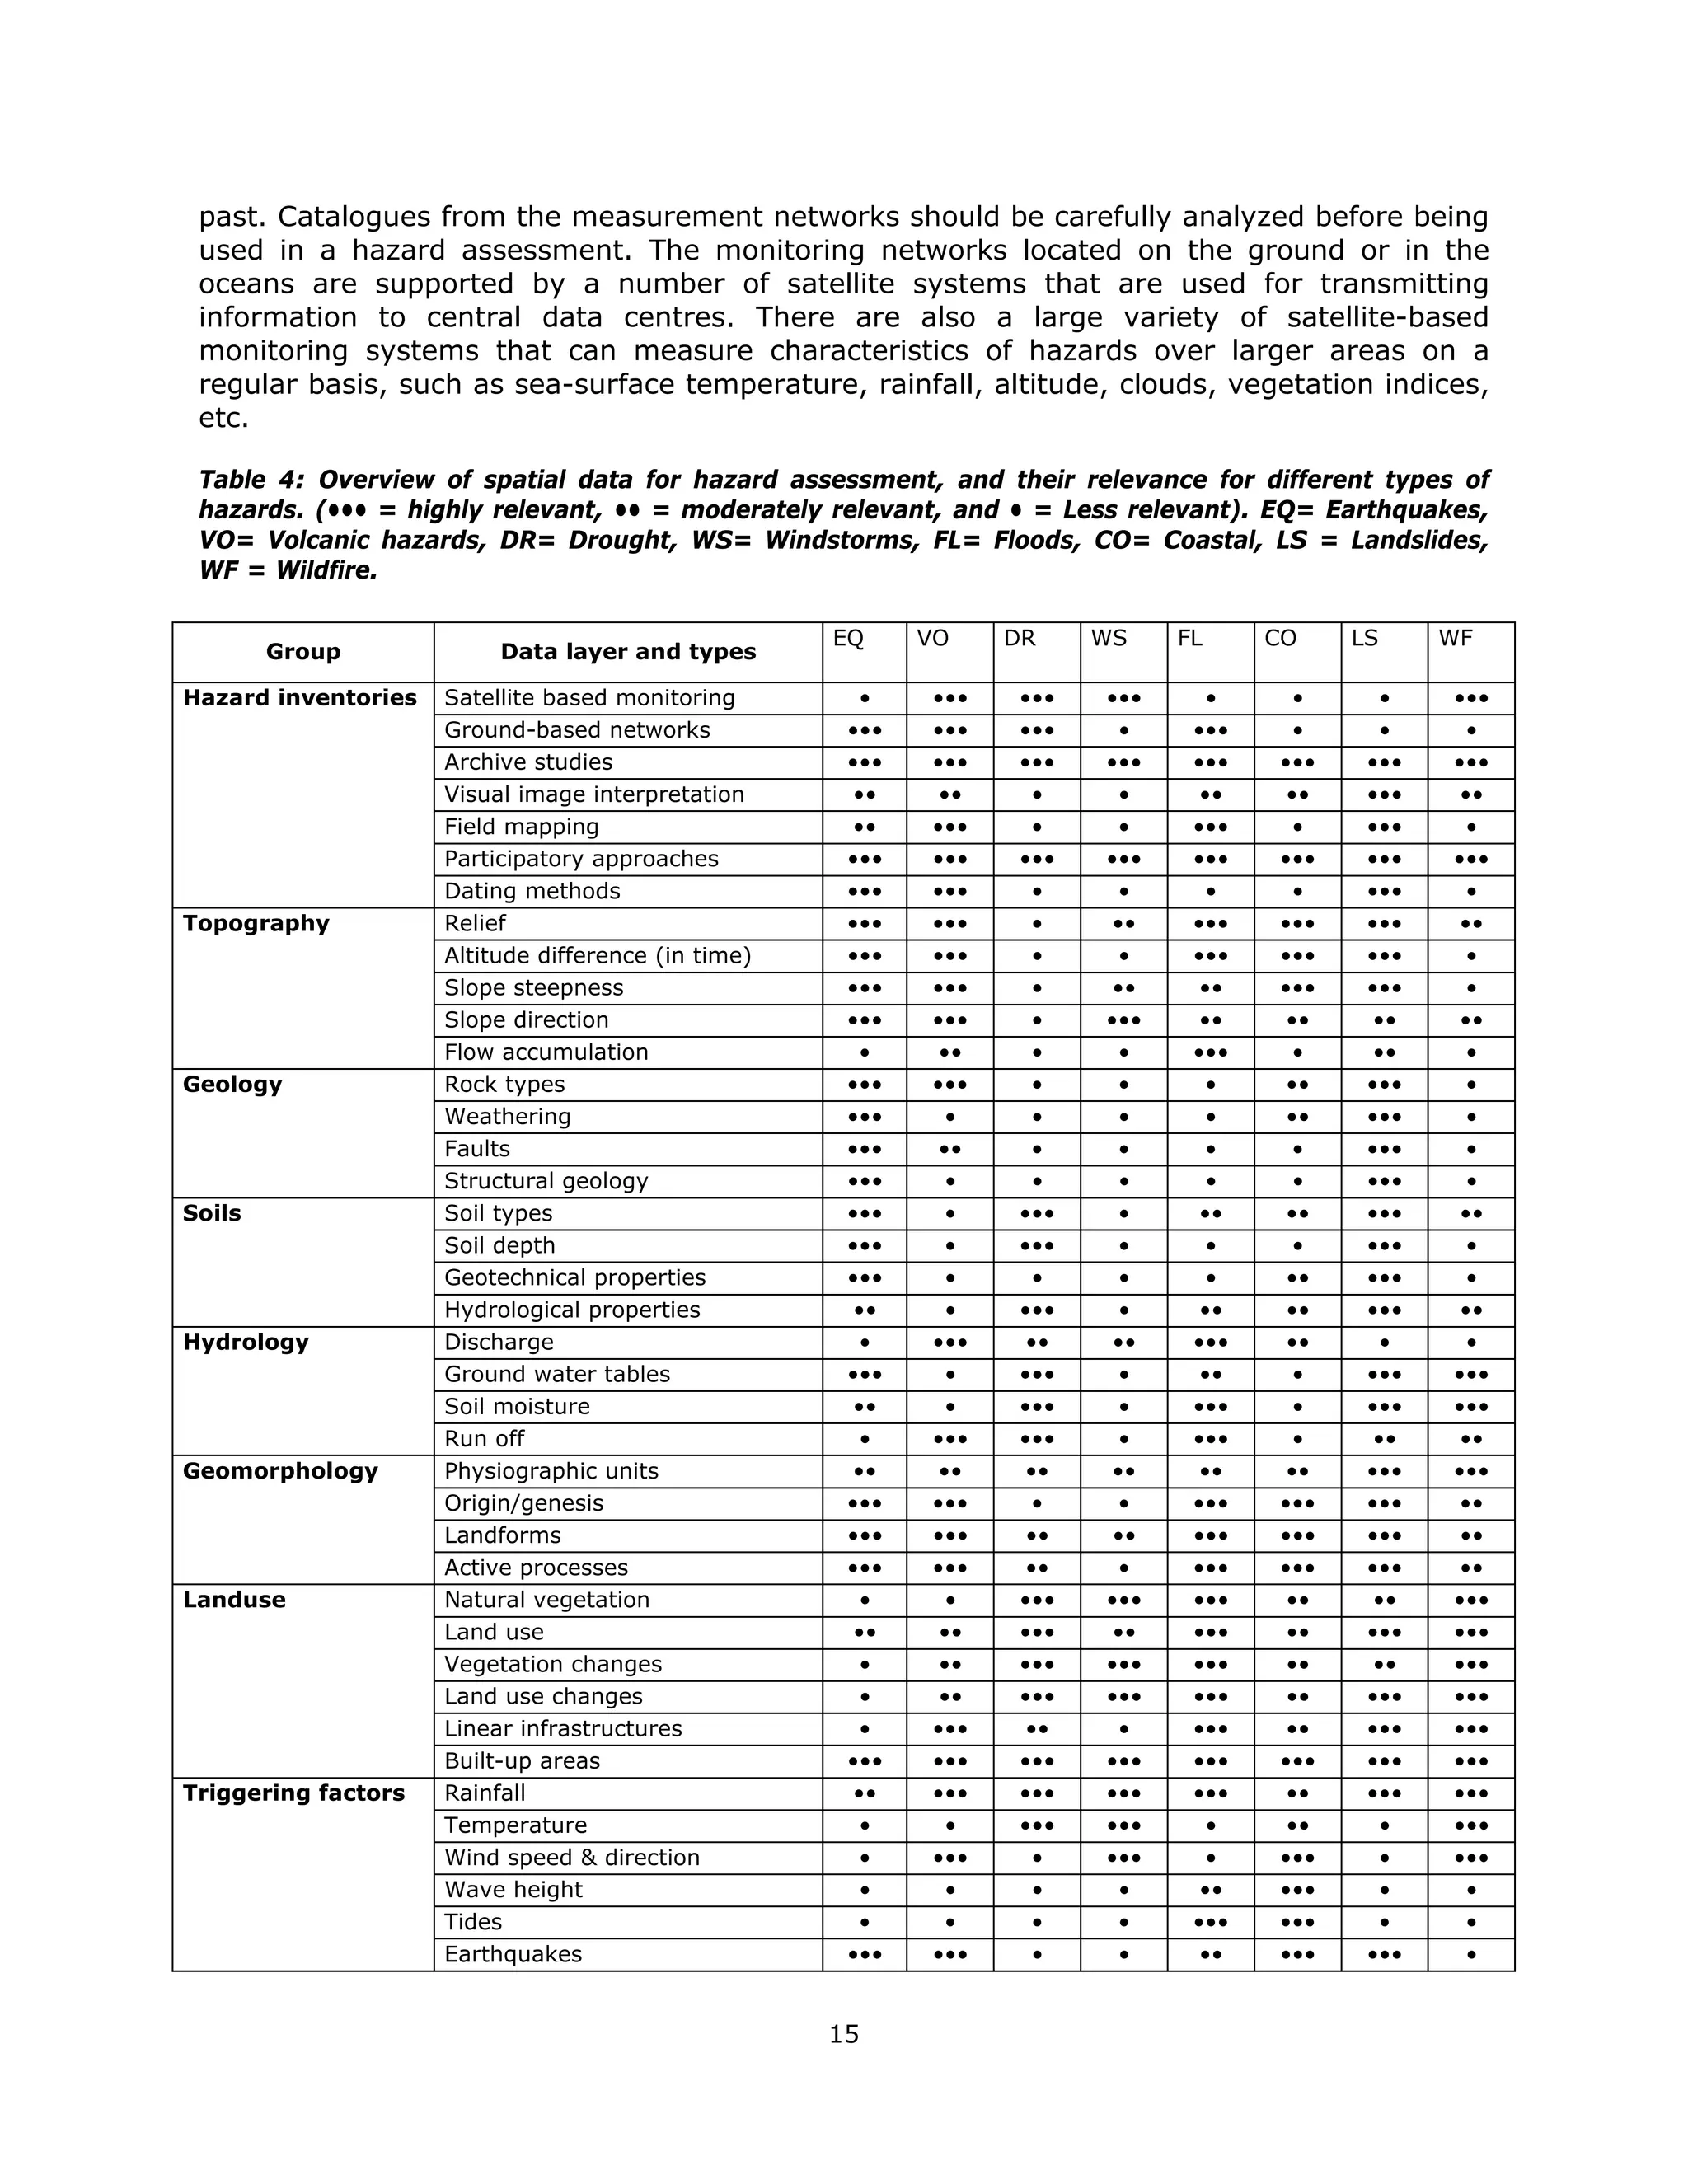
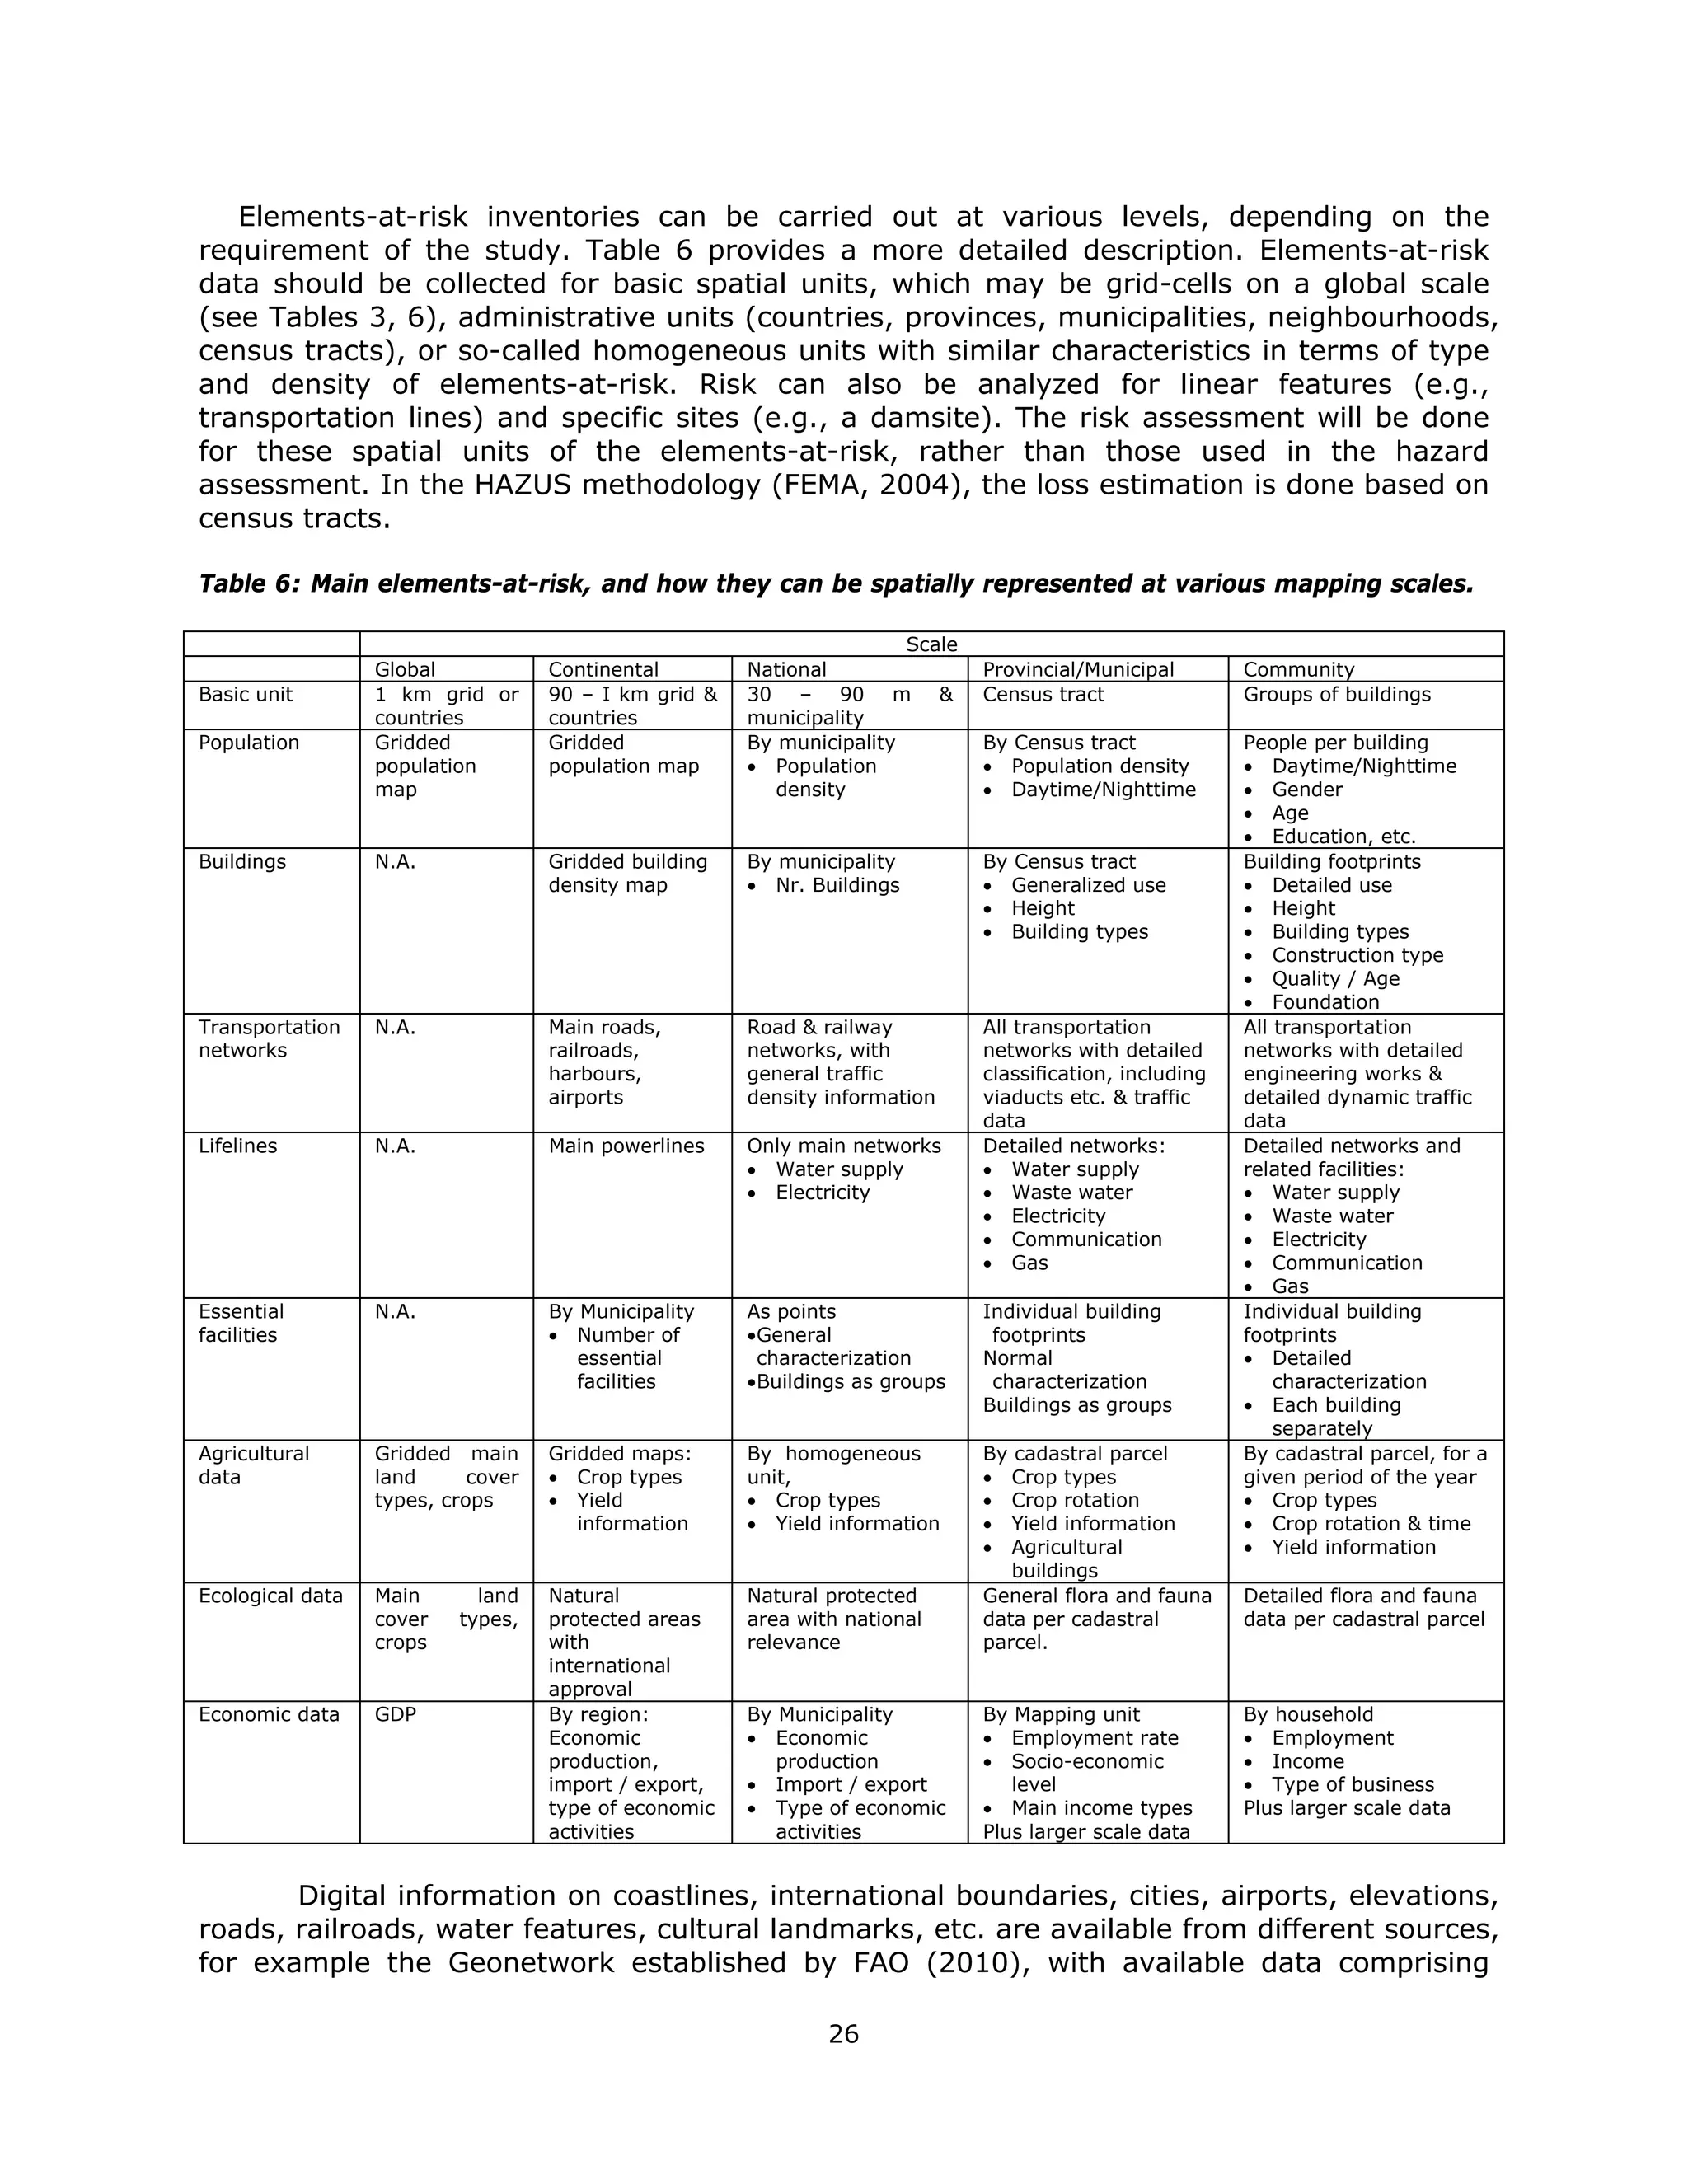
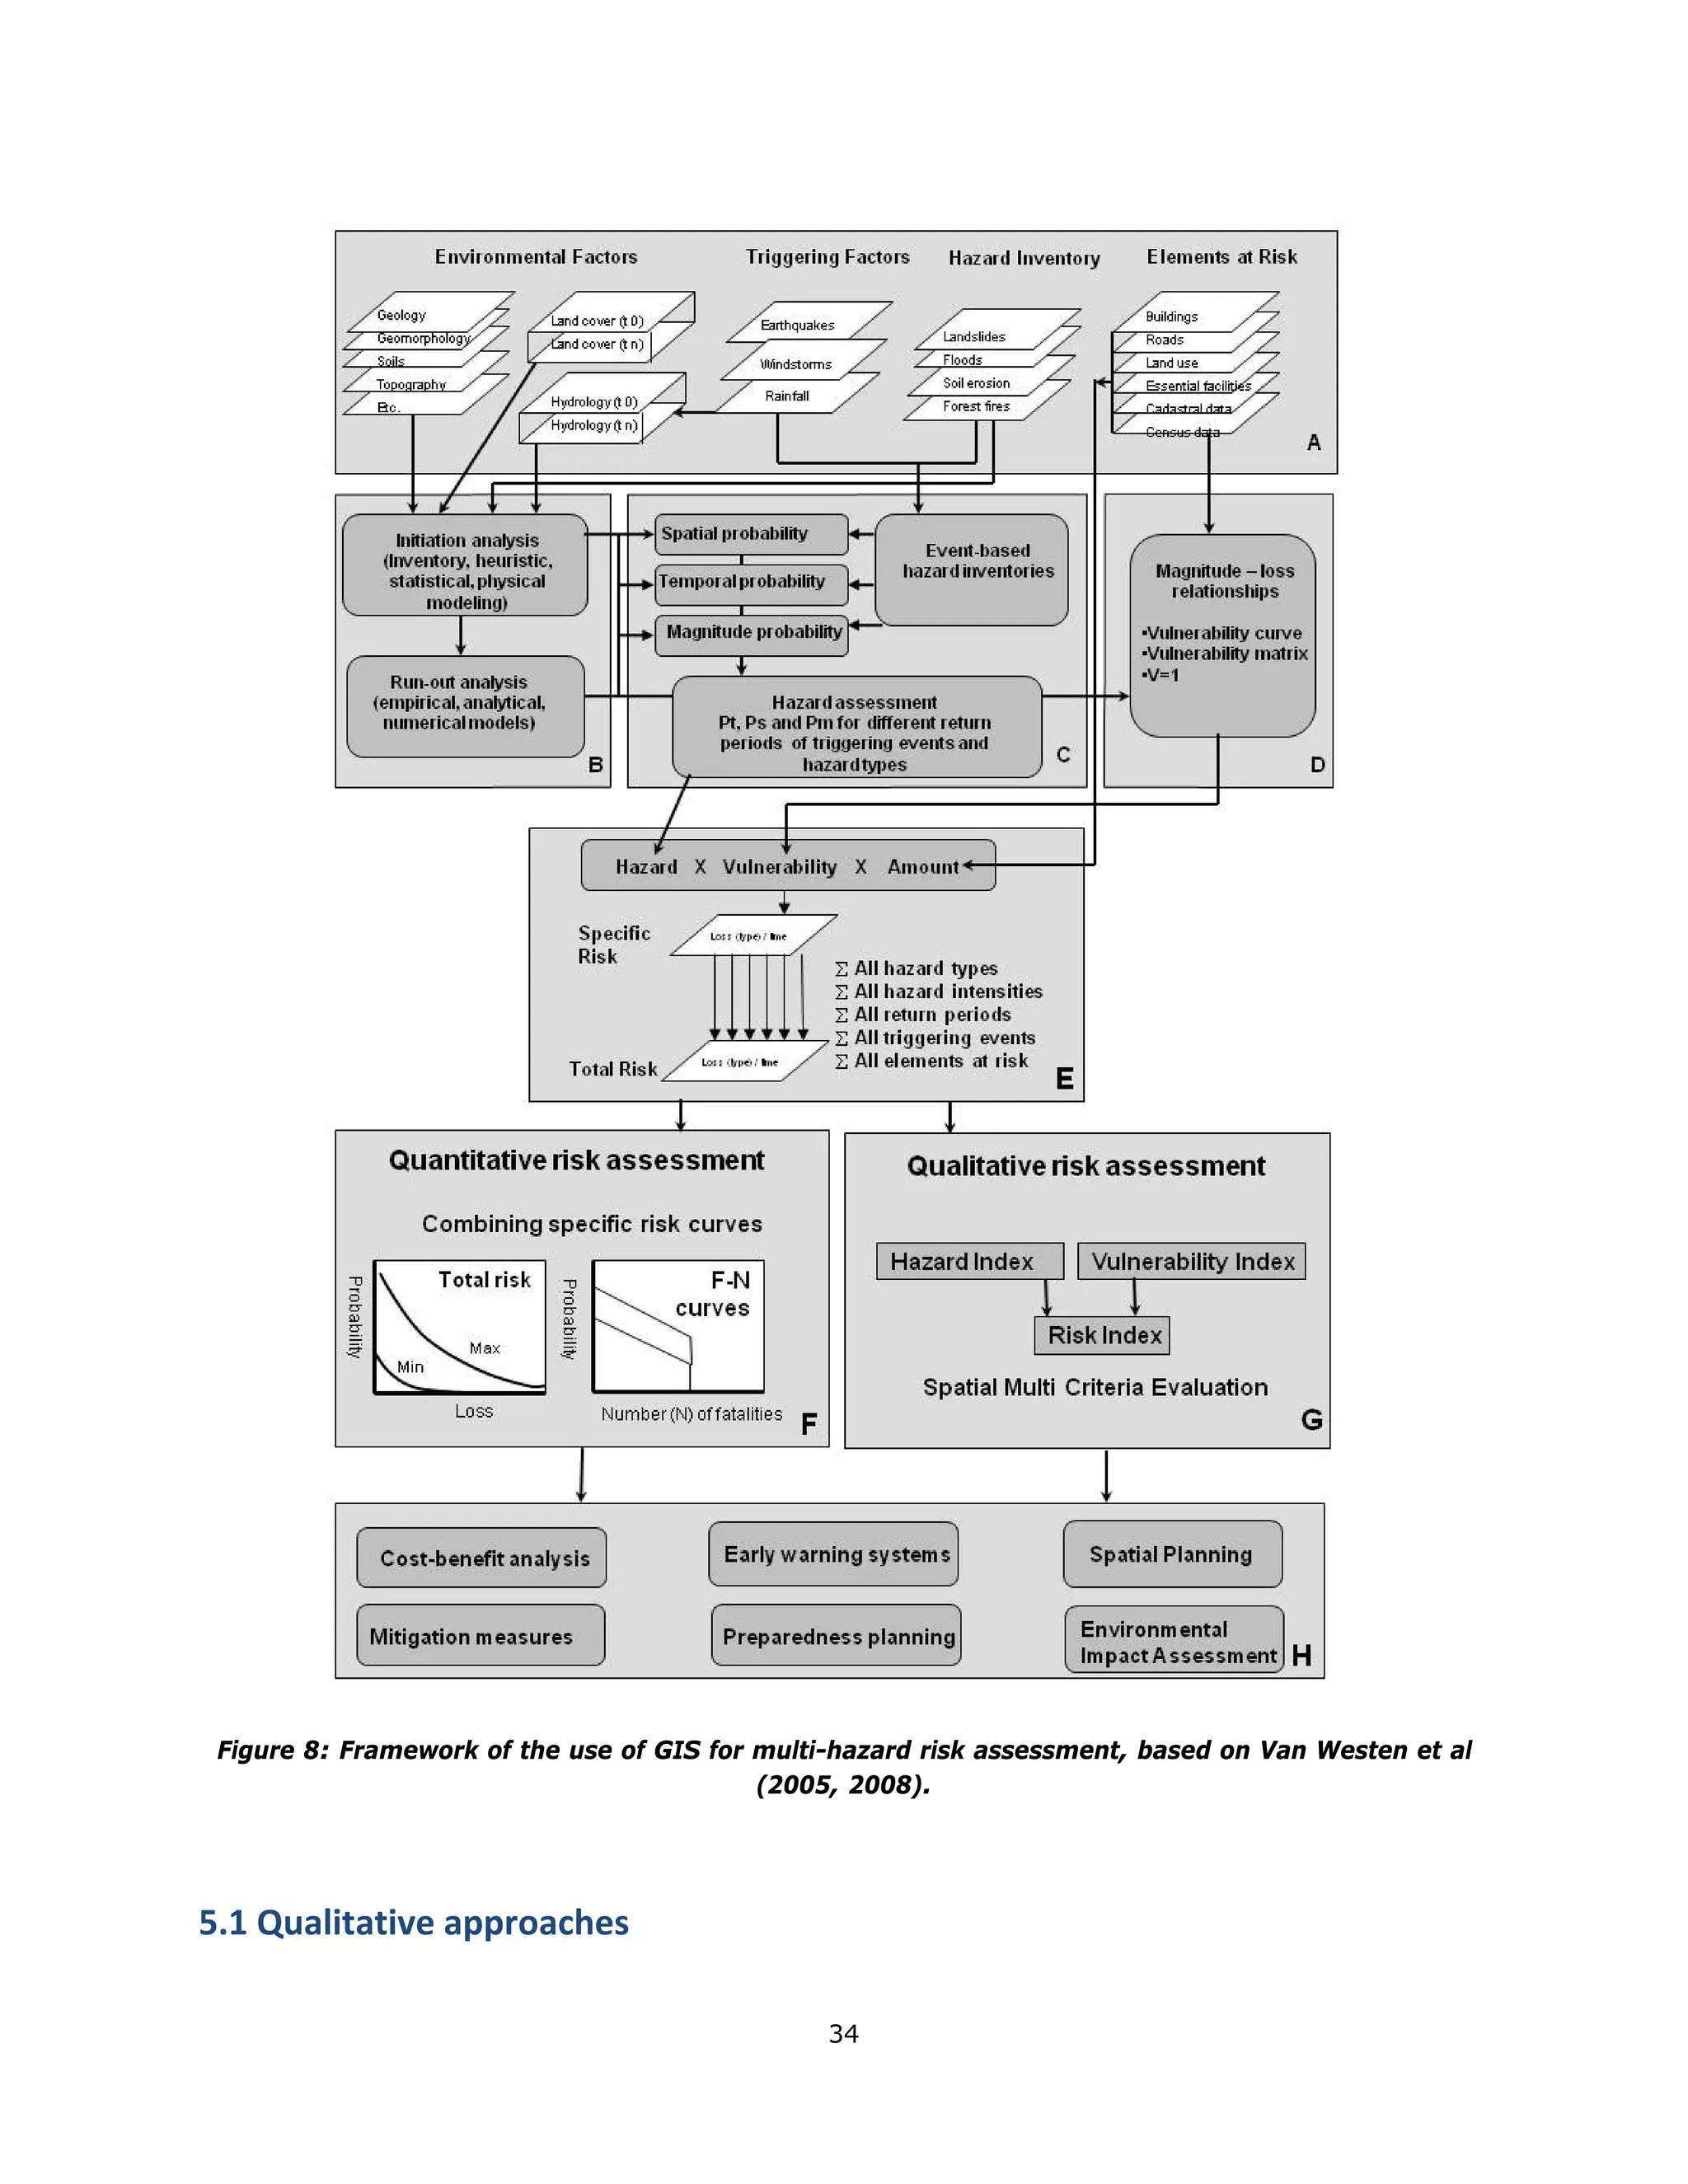

This document provides an overview of remote sensing and GIS techniques for natural hazard assessment and disaster risk management. It discusses how geo-information science and earth observation can be used to generate inventories of past hazardous events, model hazards, map elements at risk, and integrate these data to model potential losses. Hazard and risk assessments are conducted at multiple scales using spatial data on hazards, environmental factors, elements at risk, and causal factors. Remote sensing provides input for hazard modeling like topography, geology, and land cover. GIS allows storage, analysis, modeling, and visualization of spatial and temporal data in an integrated approach to disaster risk management.