Download as PDF, PPTX


![We validate out results using several criteria and data sets:
• MoT validation using limited calibration data labeled to measure performance.
• Limited ground truth for train and flight trips from our providers and customers
• Common sense checks, e.g. whether counts are balanced:
OD[i,j] ~ OD[j,i]
Criteria for Validation
precision recall
flights 0.96 0.81
car 0.96 0.88
train 0.95 0.91](https://image.slidesharecdn.com/6cjavieraguedes-161103181054/85/Spark-Summit-EU-talk-by-Javier-Aguedes-26-320.jpg)


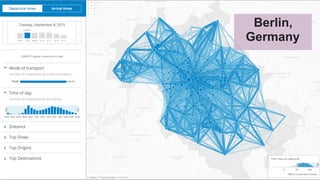
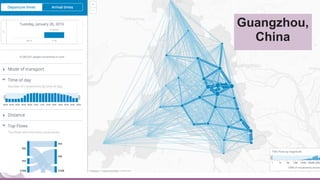
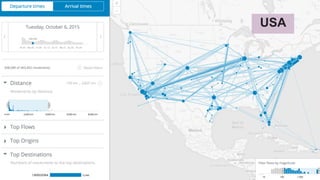


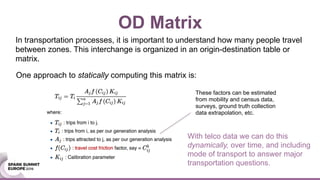
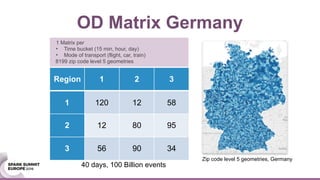
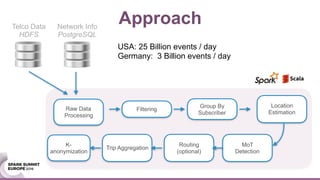
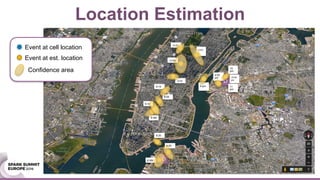
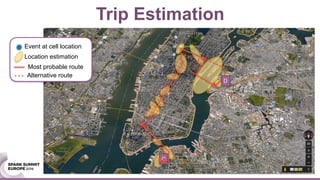
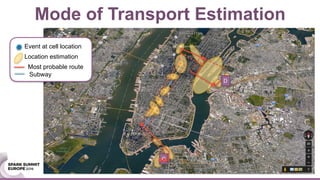
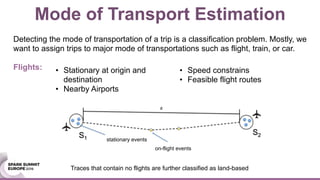
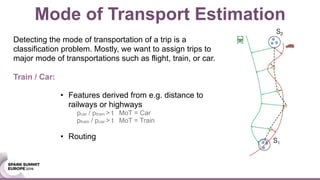
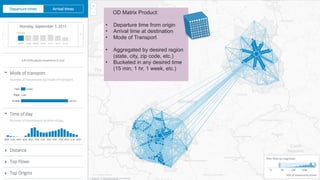
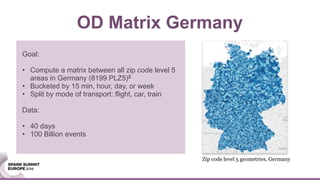
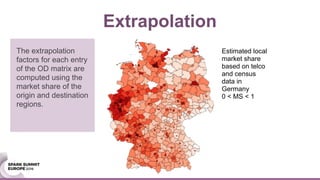
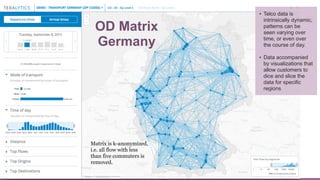
This document discusses generating origin-destination matrices from mobile network data using Spark. It describes using telco event data to dynamically compute OD matrices over time and by mode of transport between geographic regions. The approach involves processing raw telco data to estimate locations, detect trips, determine mode of transport, and aggregate the results into OD matrices for given time periods and regions. Spark is used to efficiently process large datasets in parallel. The matrices are validated against ground truth data and checked for logical consistency.