Downloaded 438 times

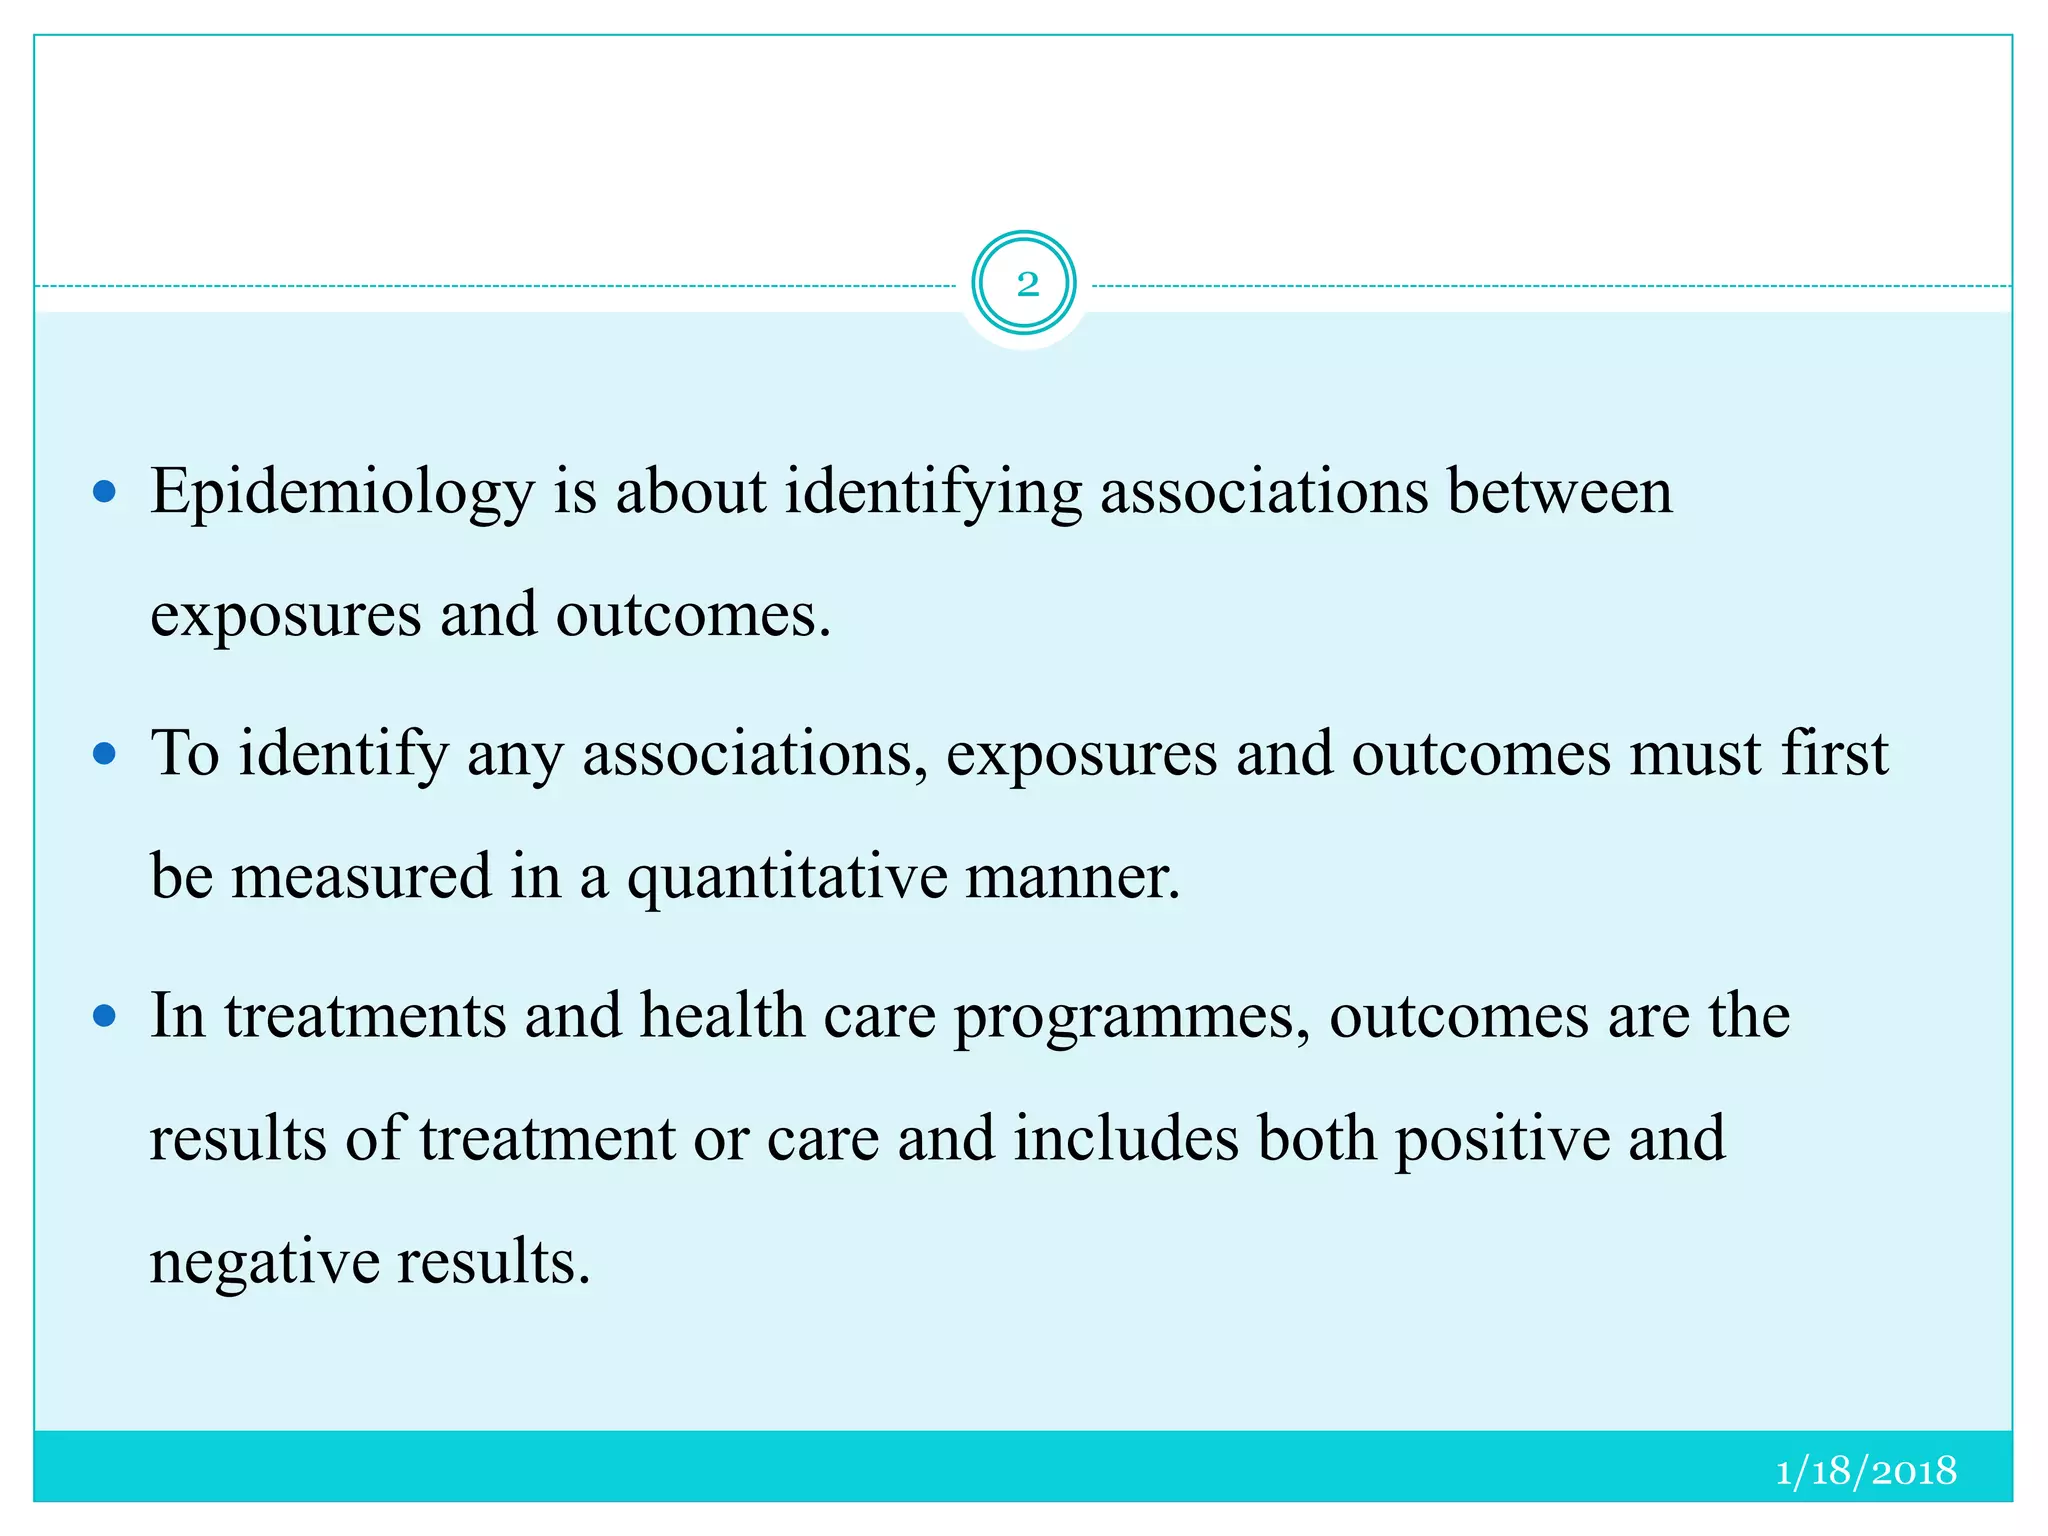

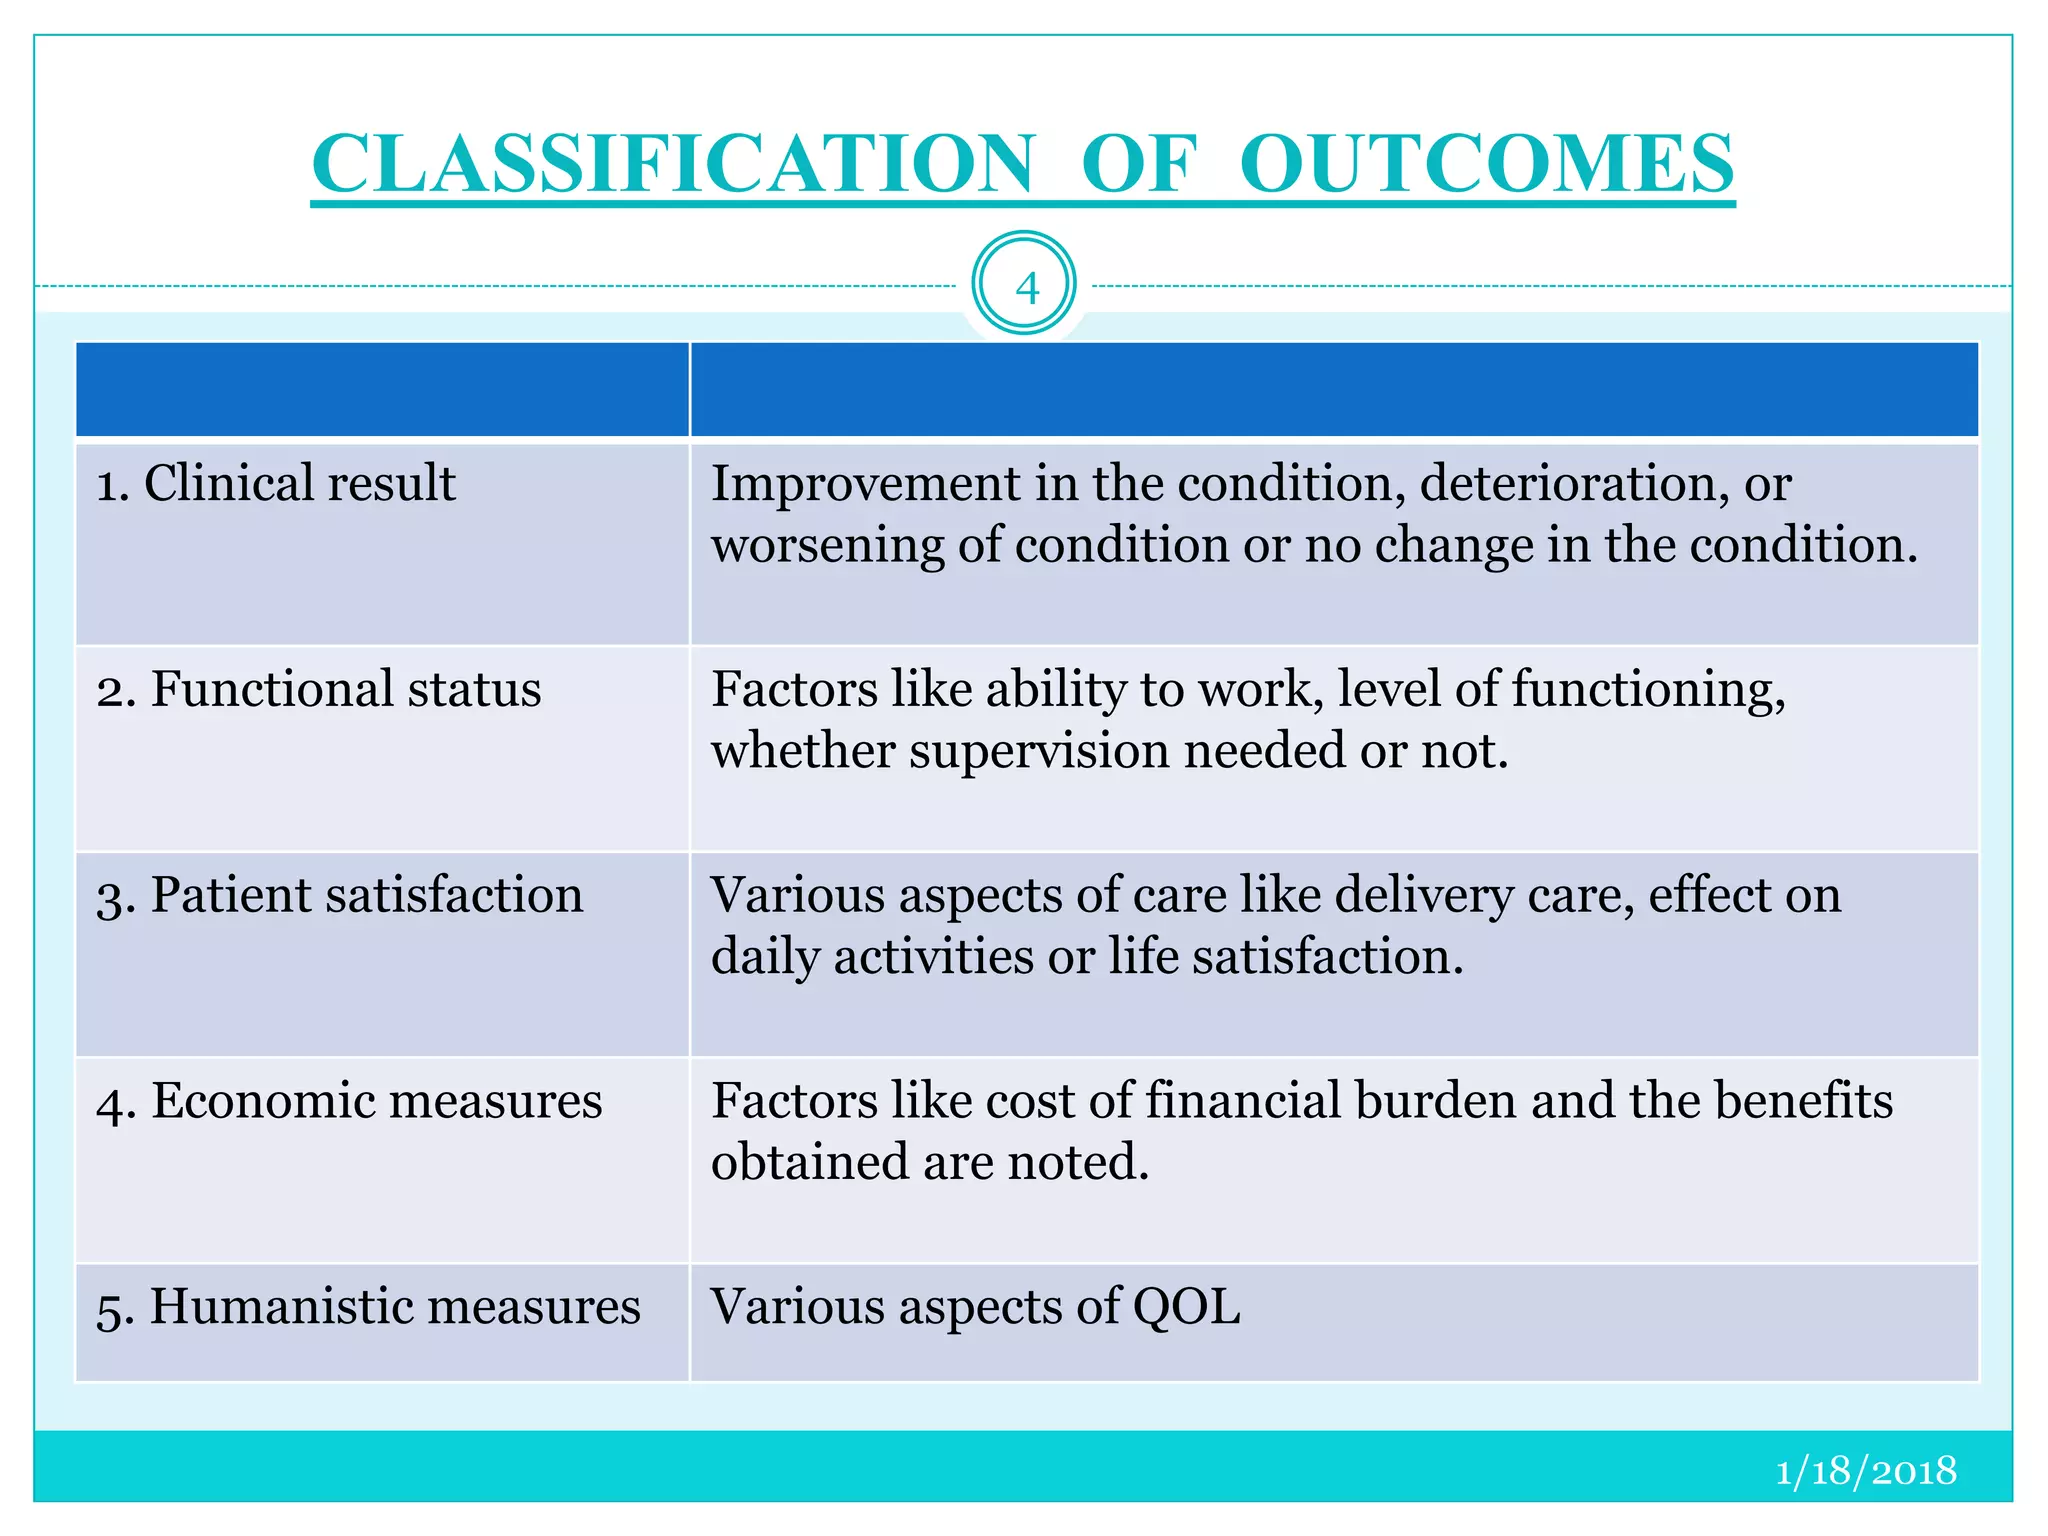


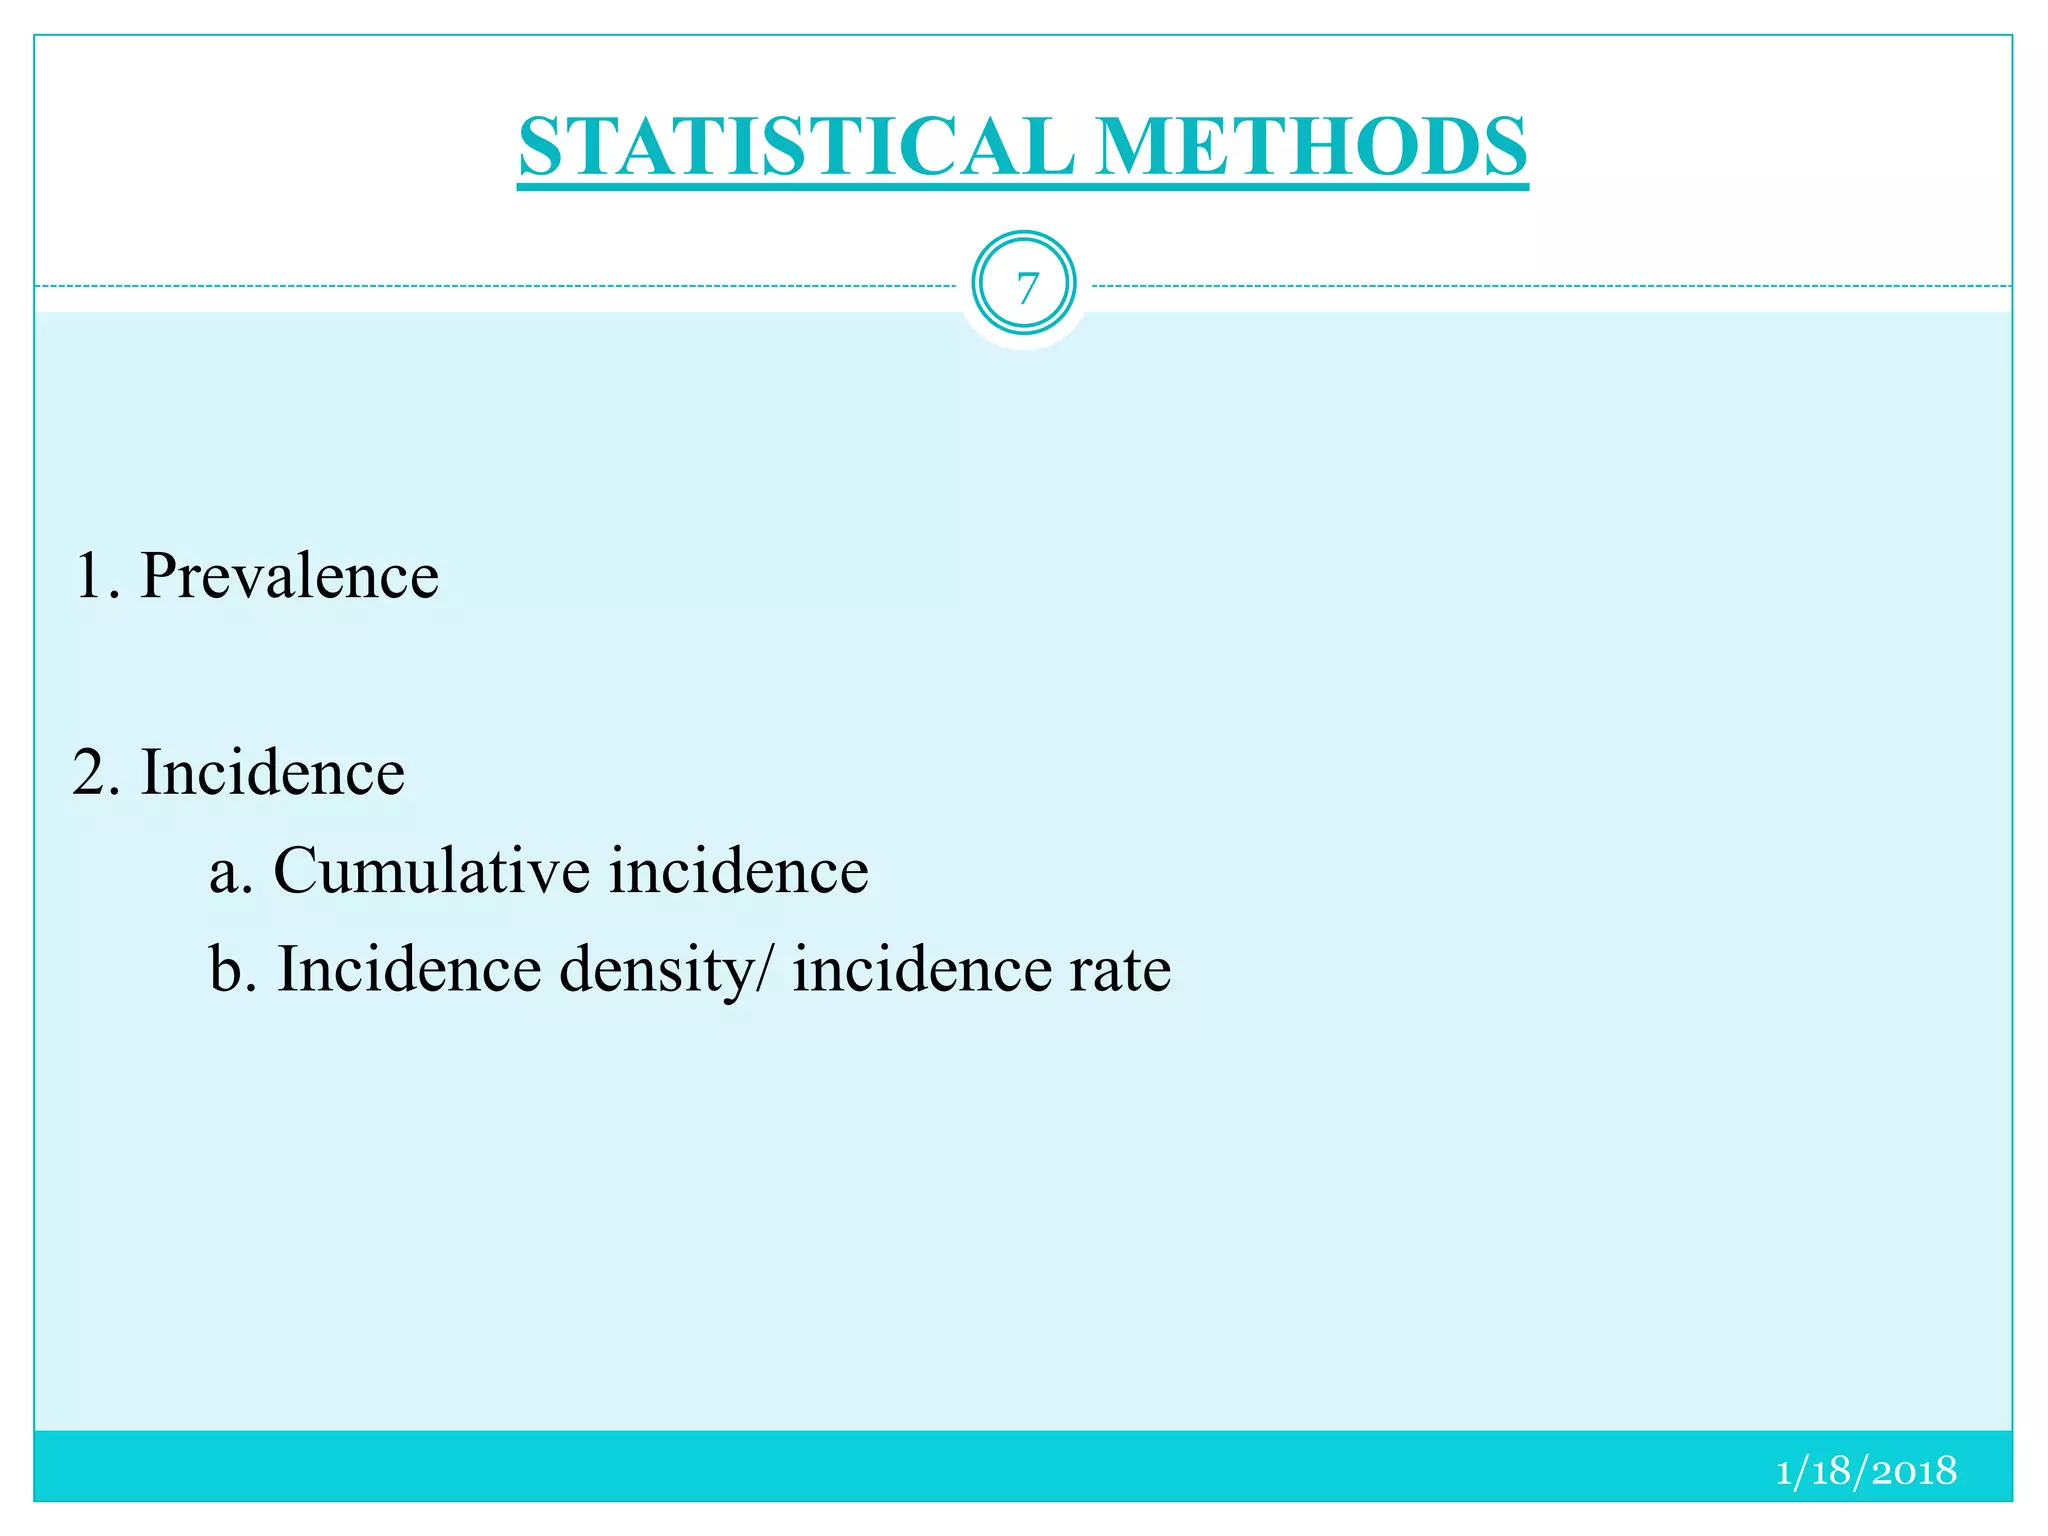
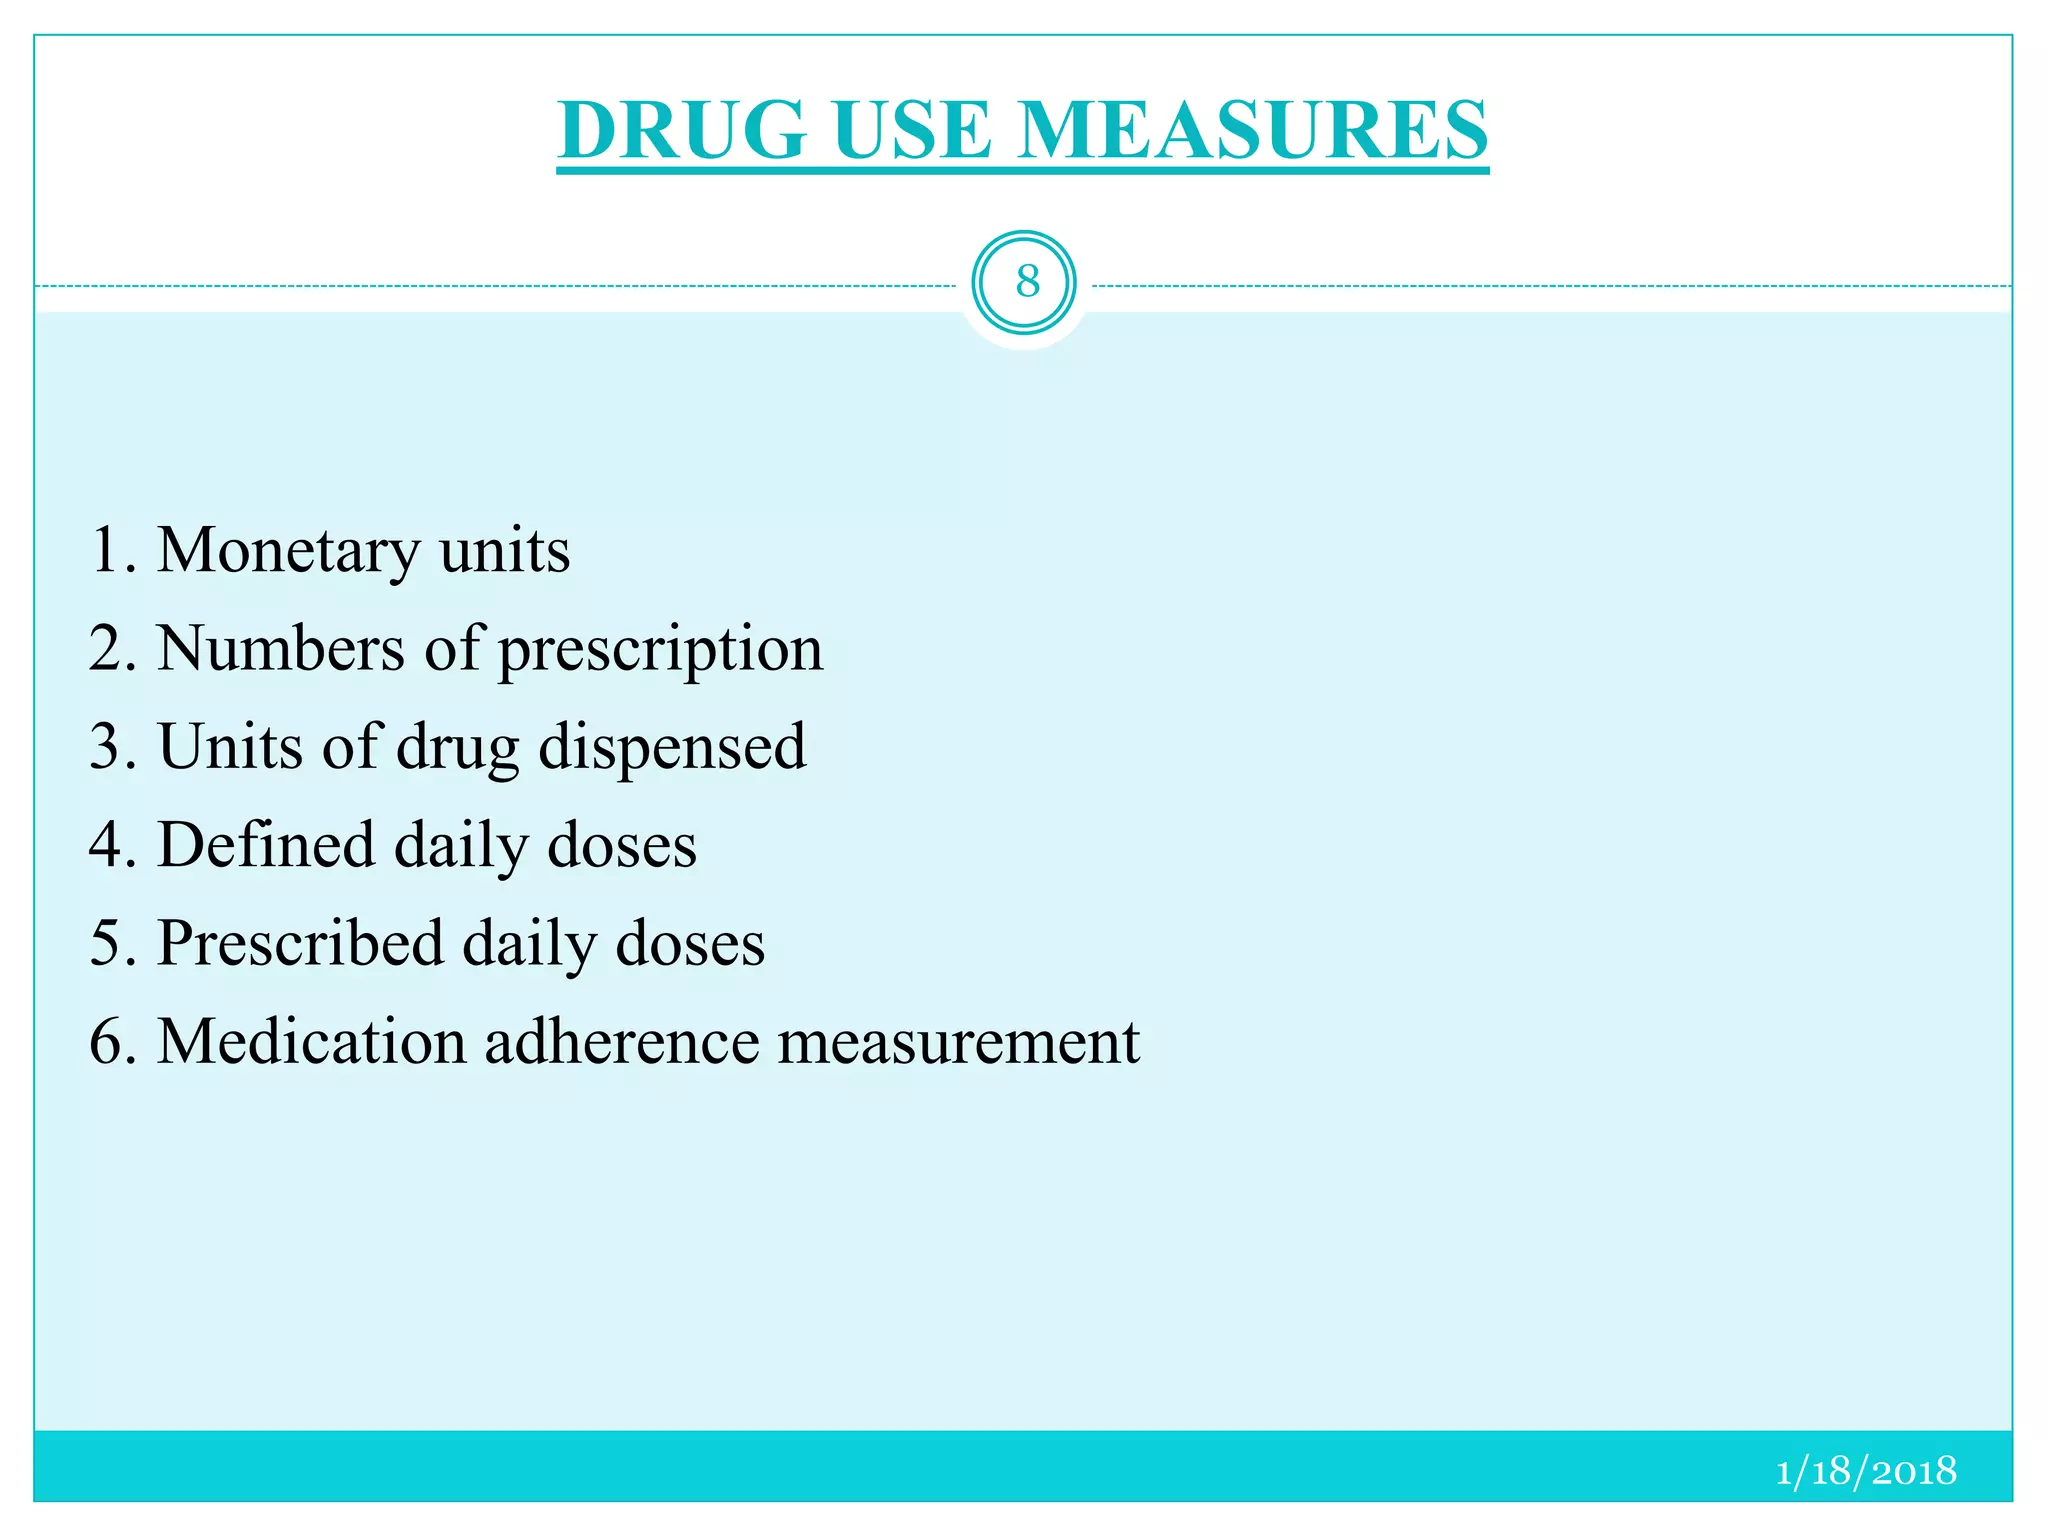


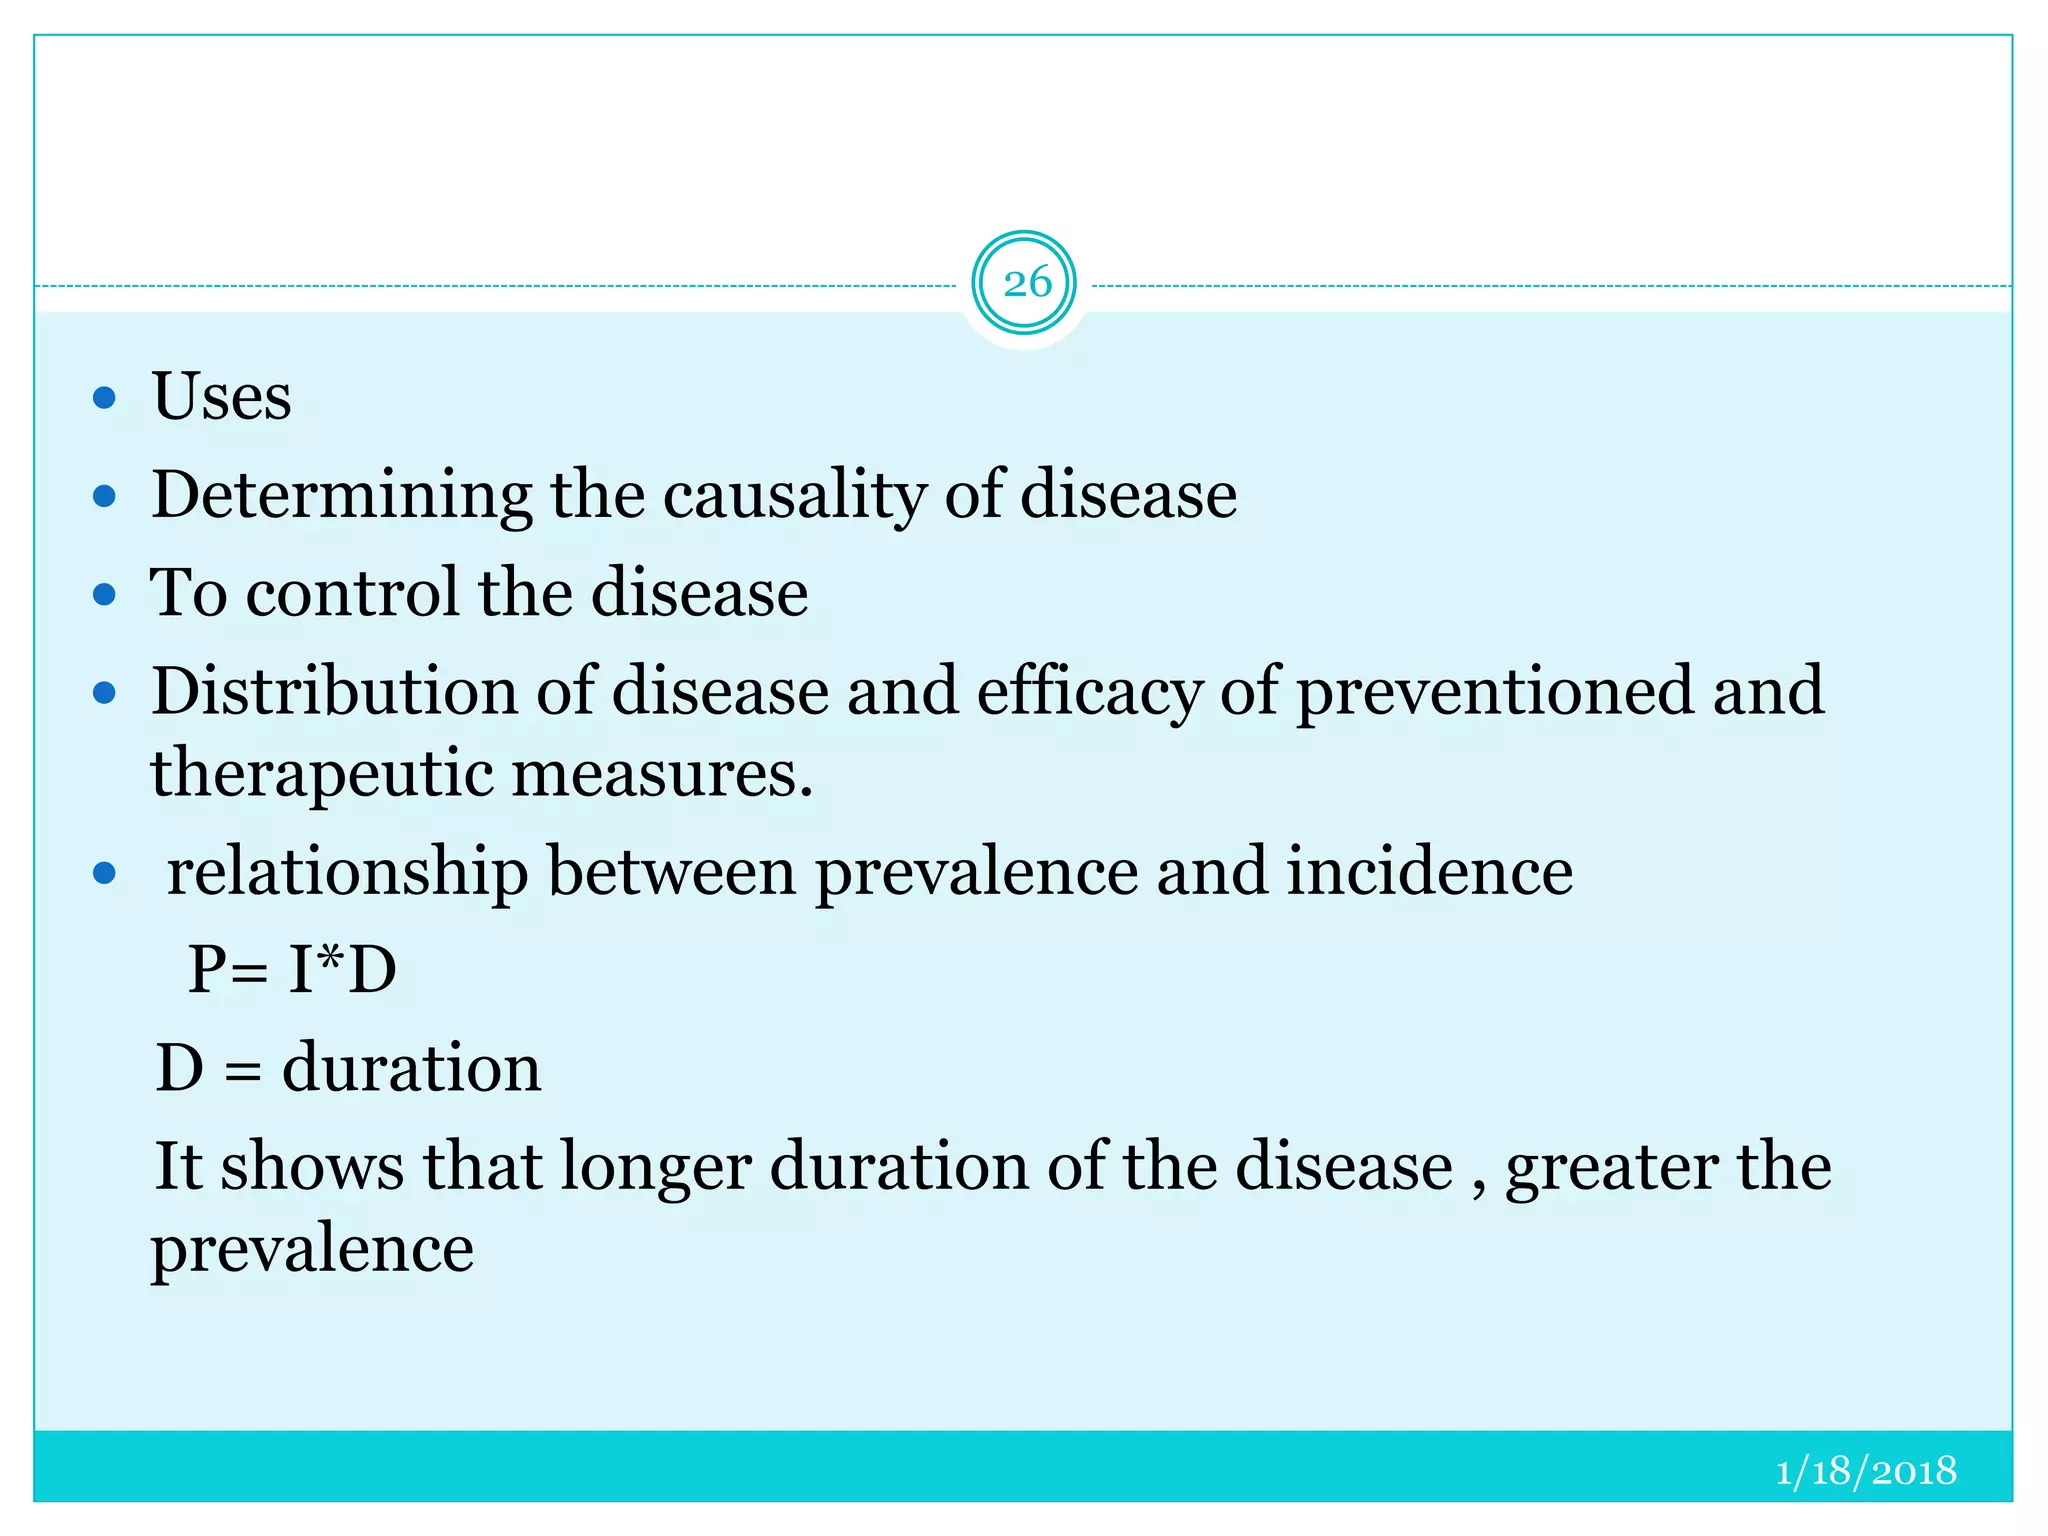
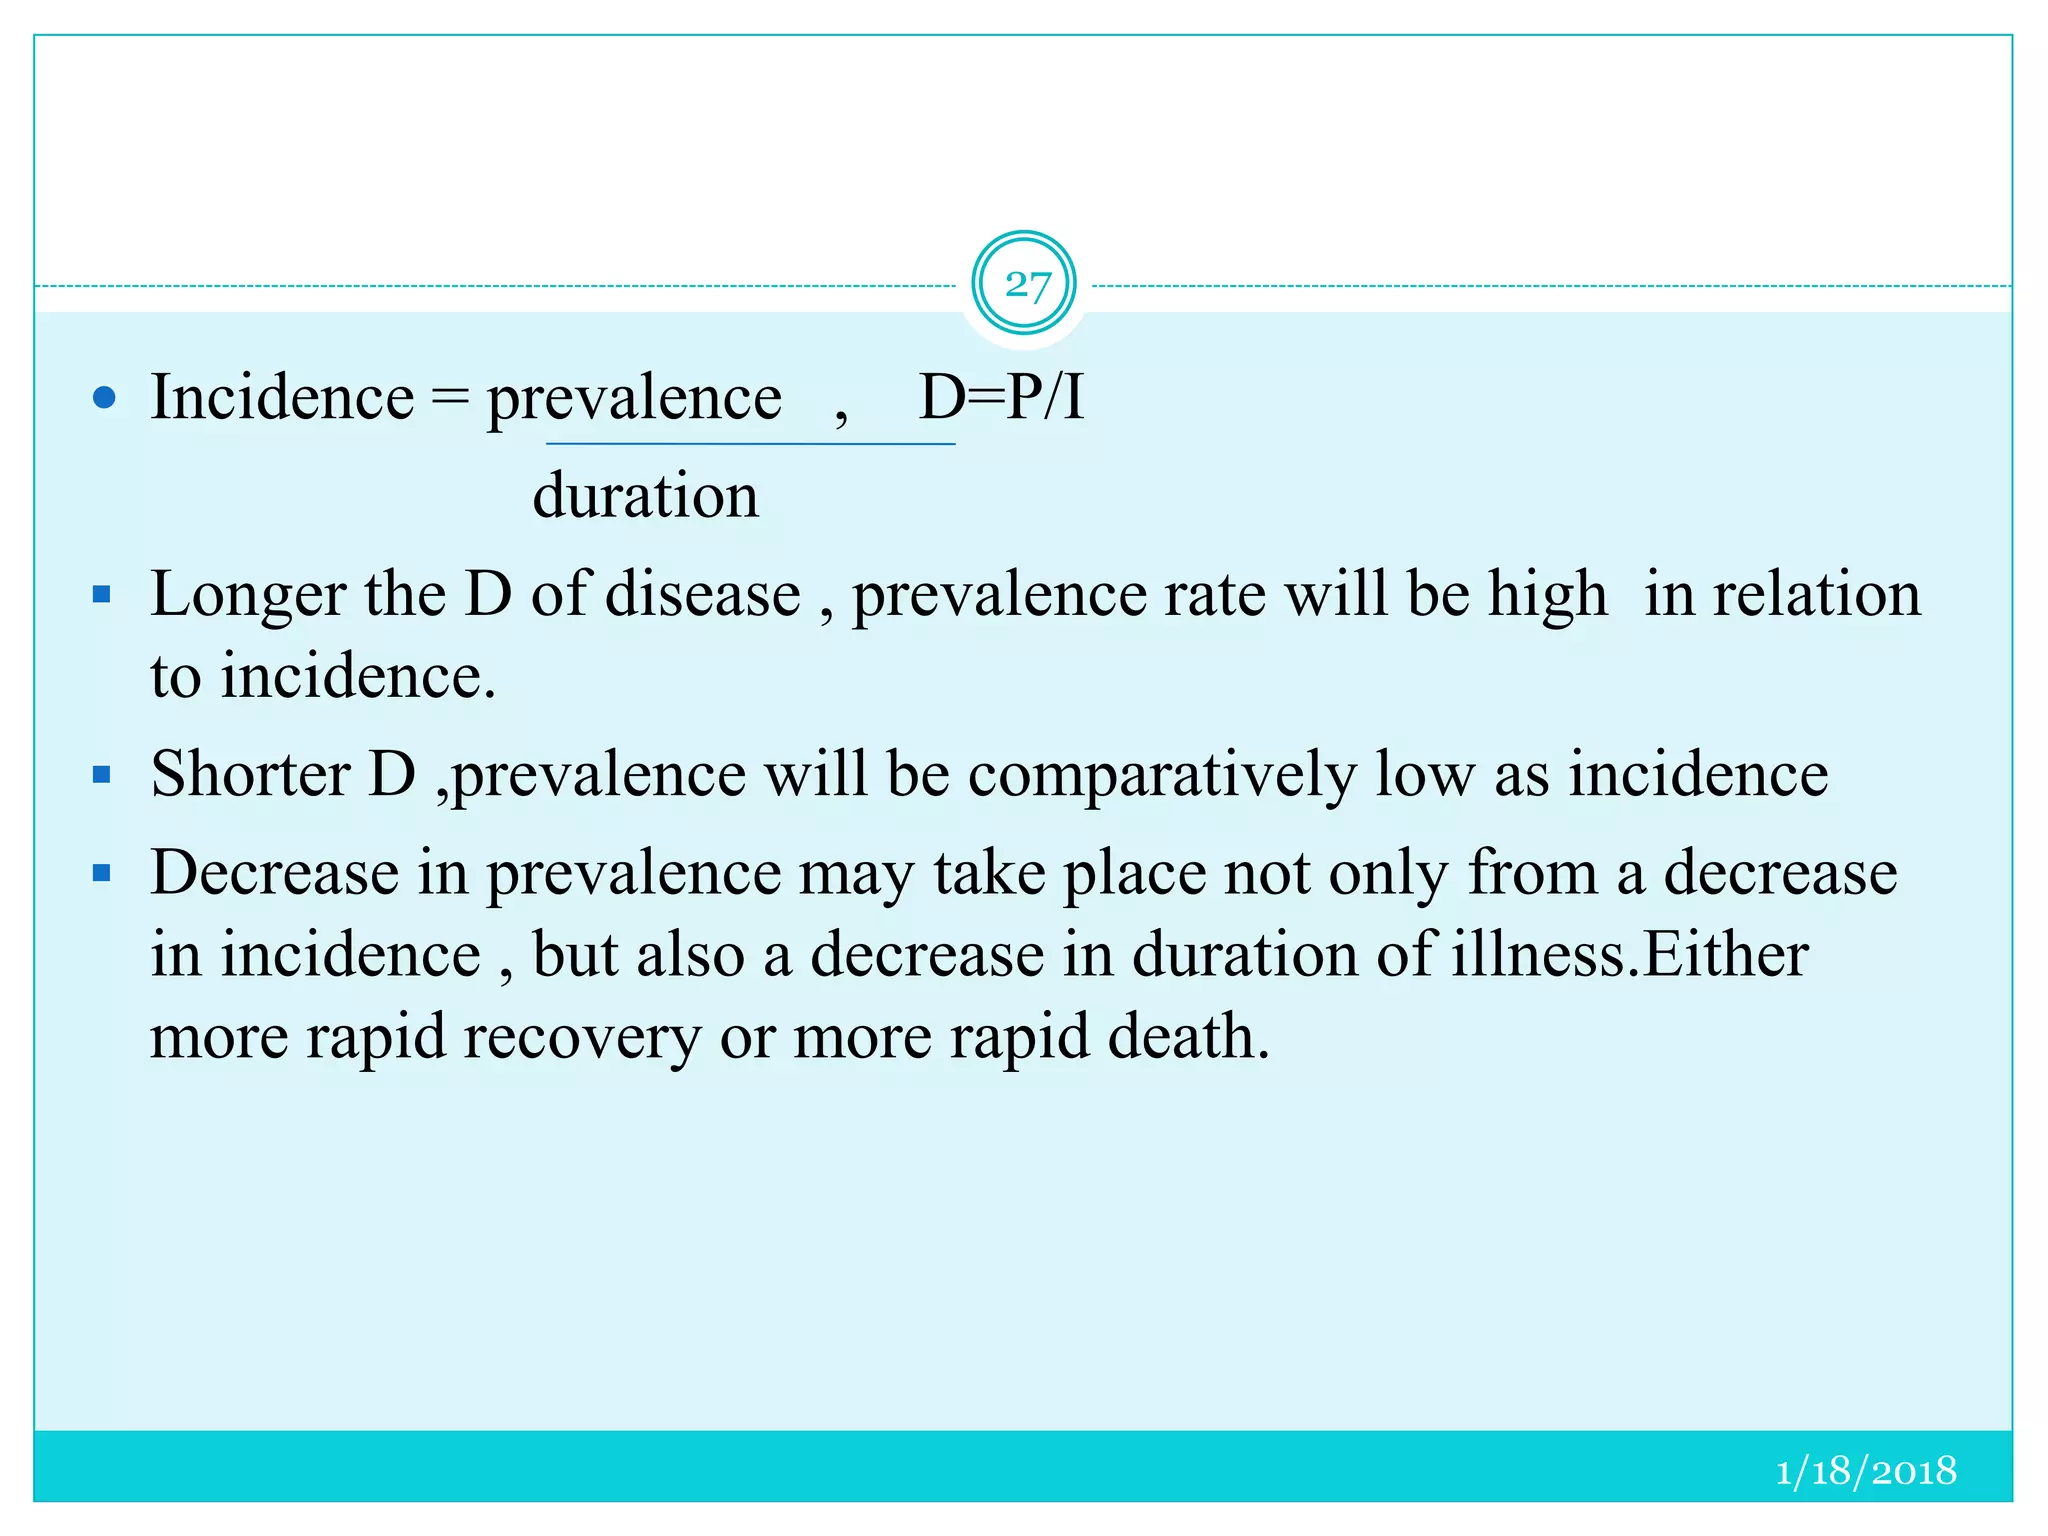

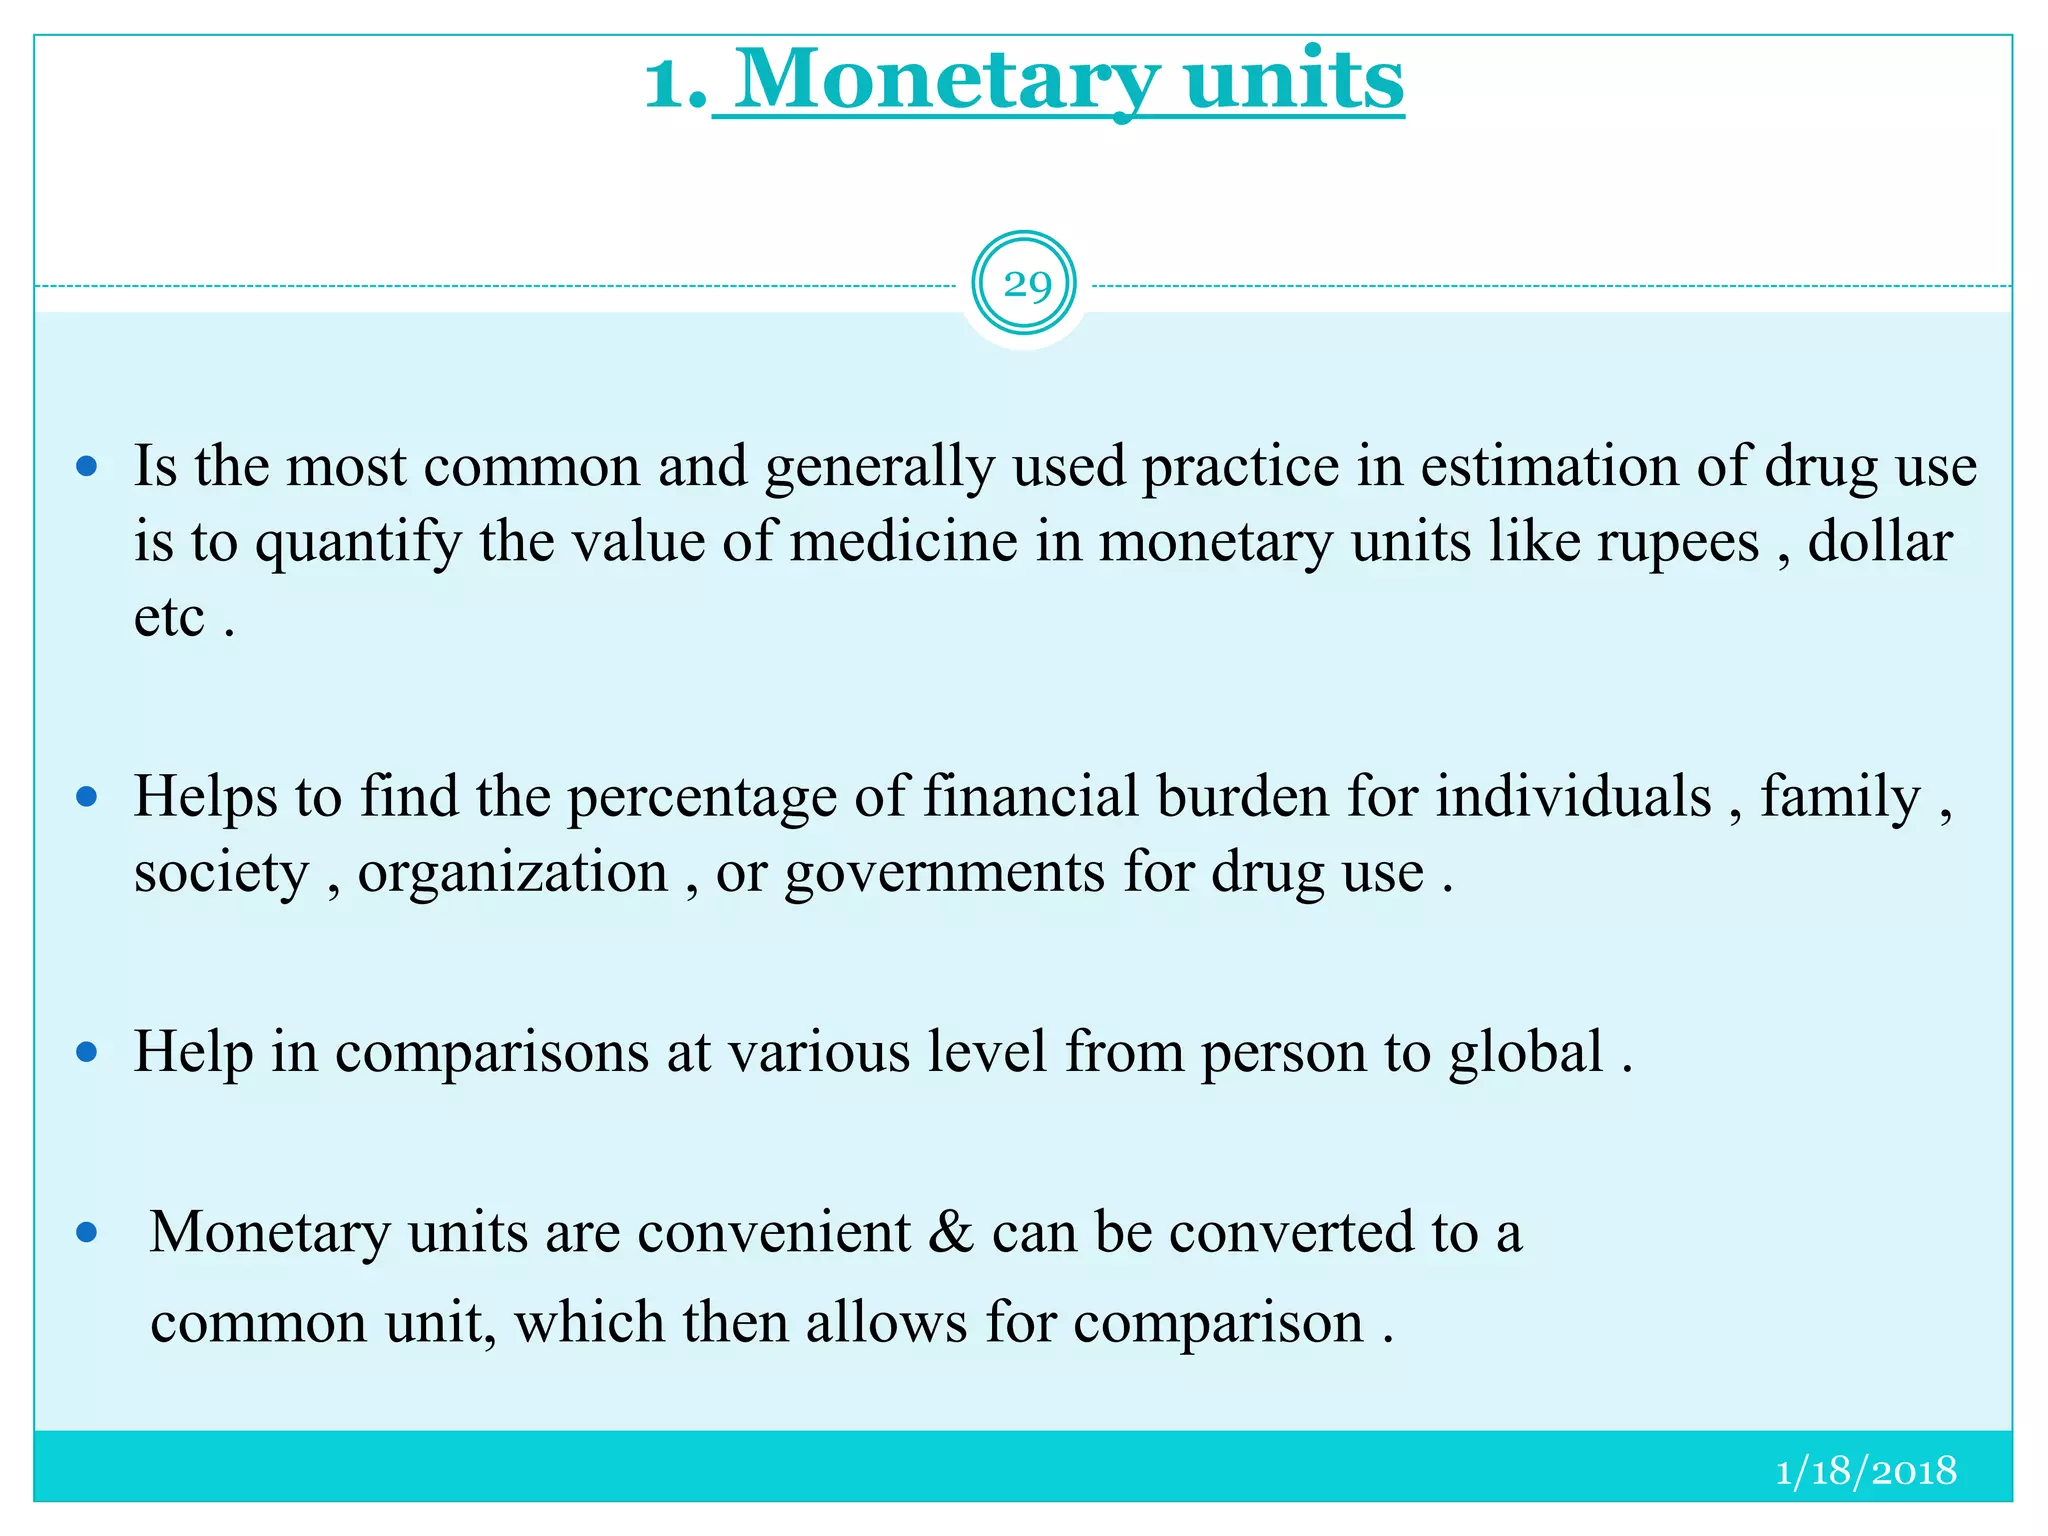


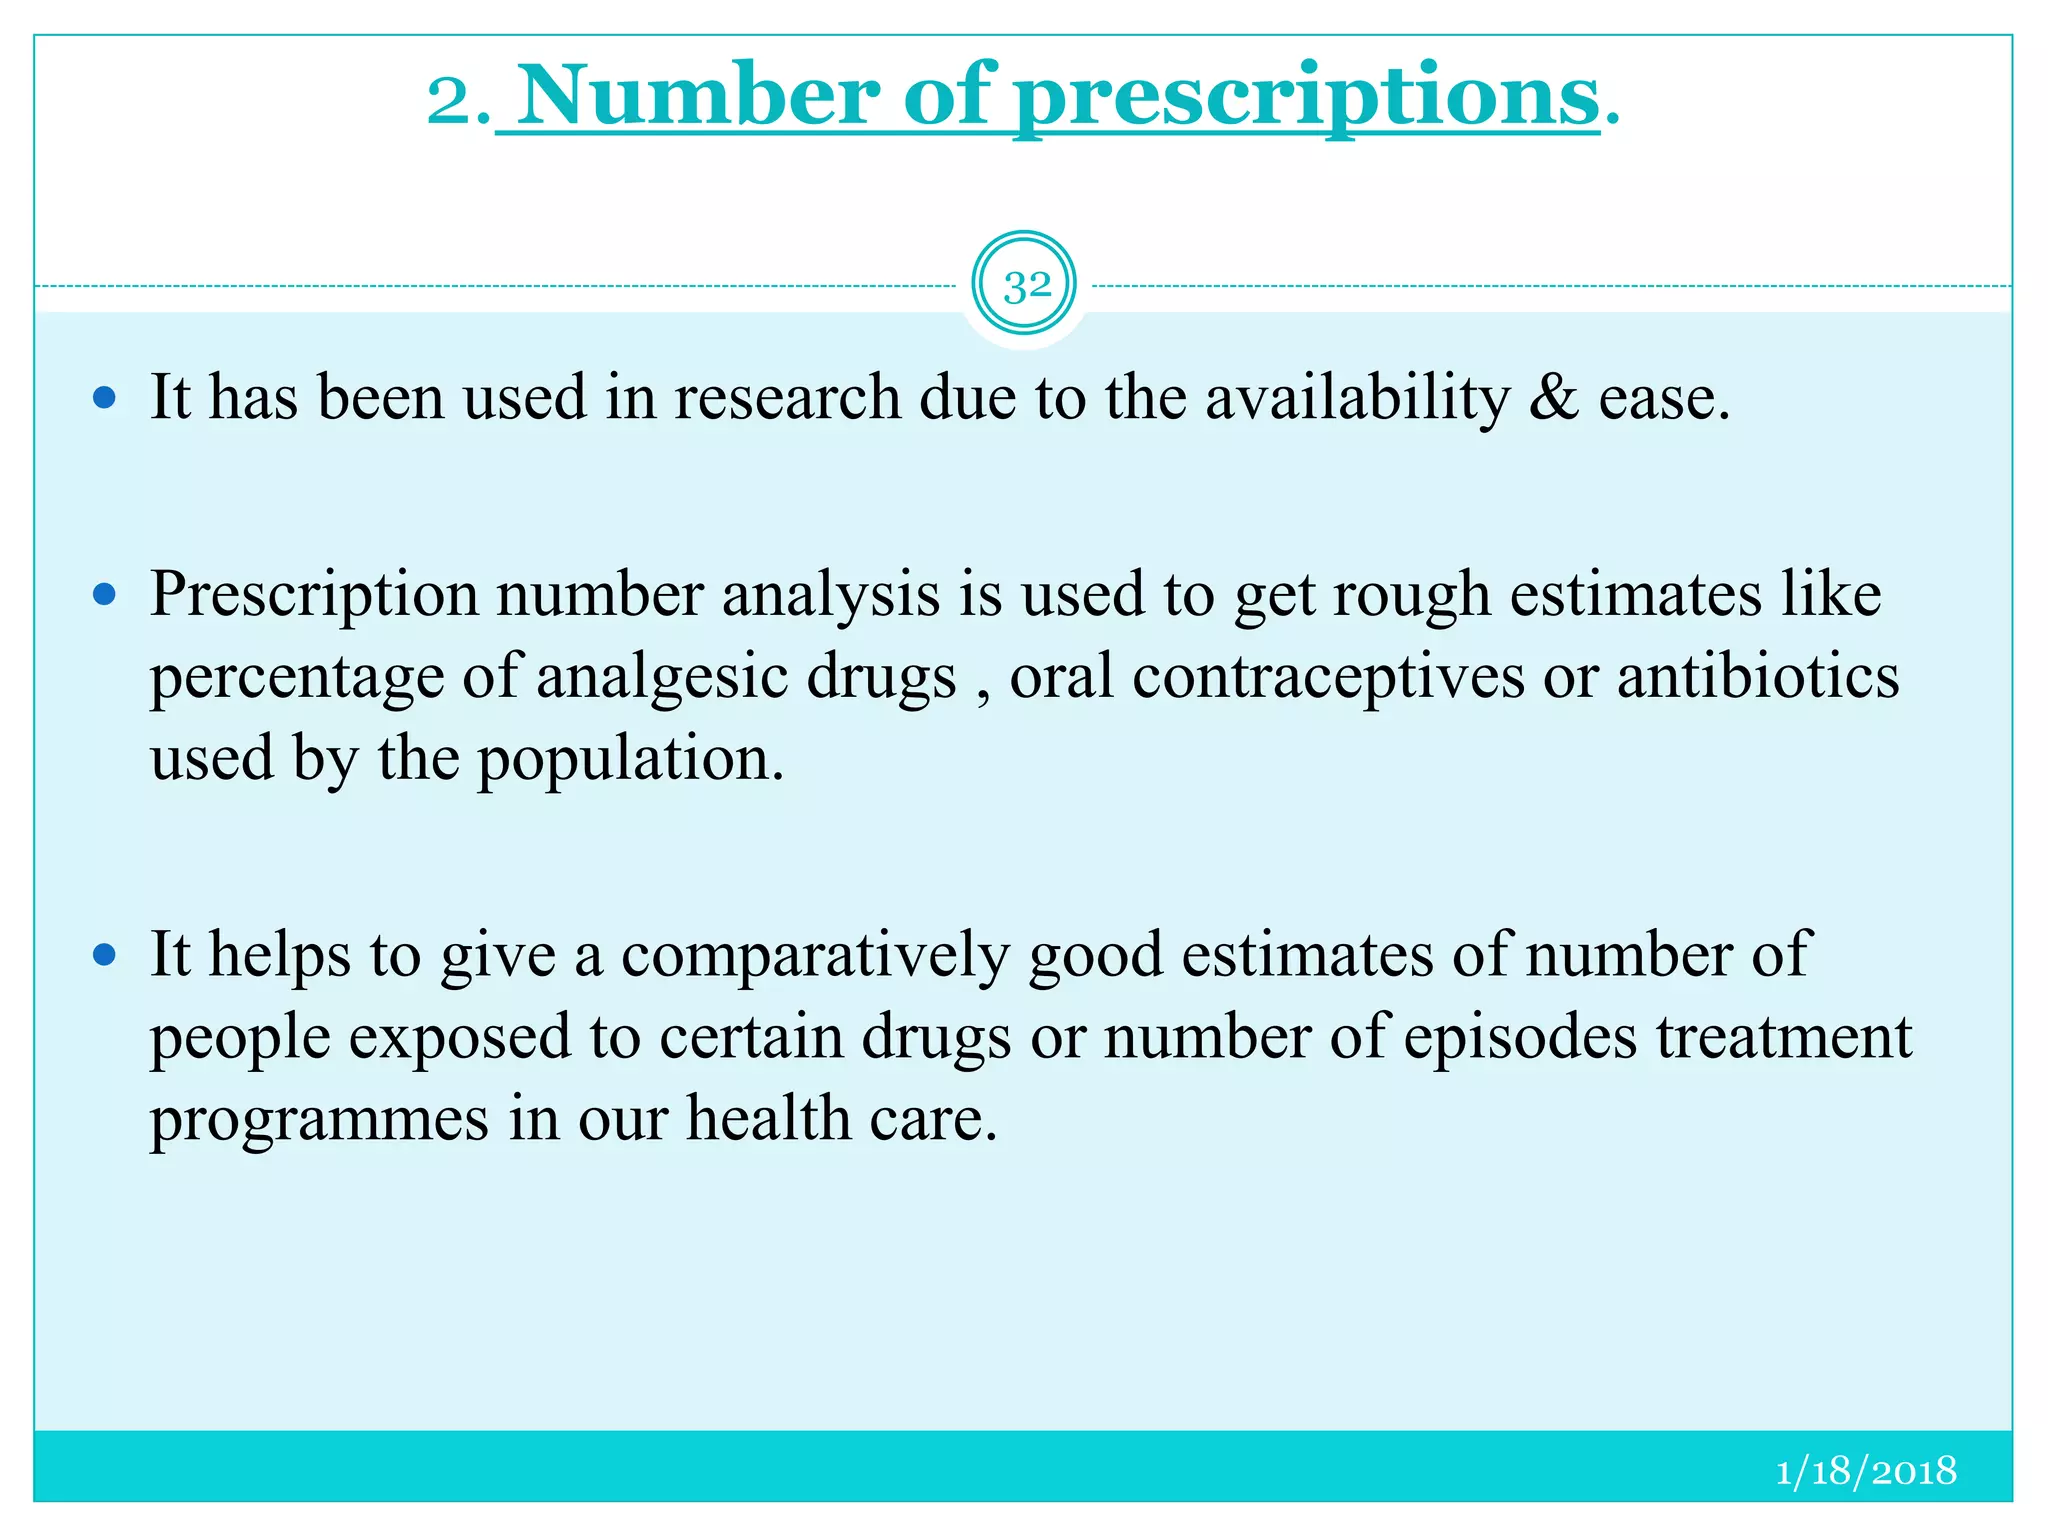


The document discusses the measurement of outcomes in pharmacoepidemiology, emphasizing the importance of quantifying exposures and outcomes to determine the effects of treatments. It outlines various outcome classifications, measurement approaches (statistical methods and drug use measures), and specific metrics such as prevalence and incidence. The text details distinct methods for measuring medication adherence and the economic evaluation of drug use, underlining how these metrics can aid in understanding patient outcomes and healthcare effectiveness.


