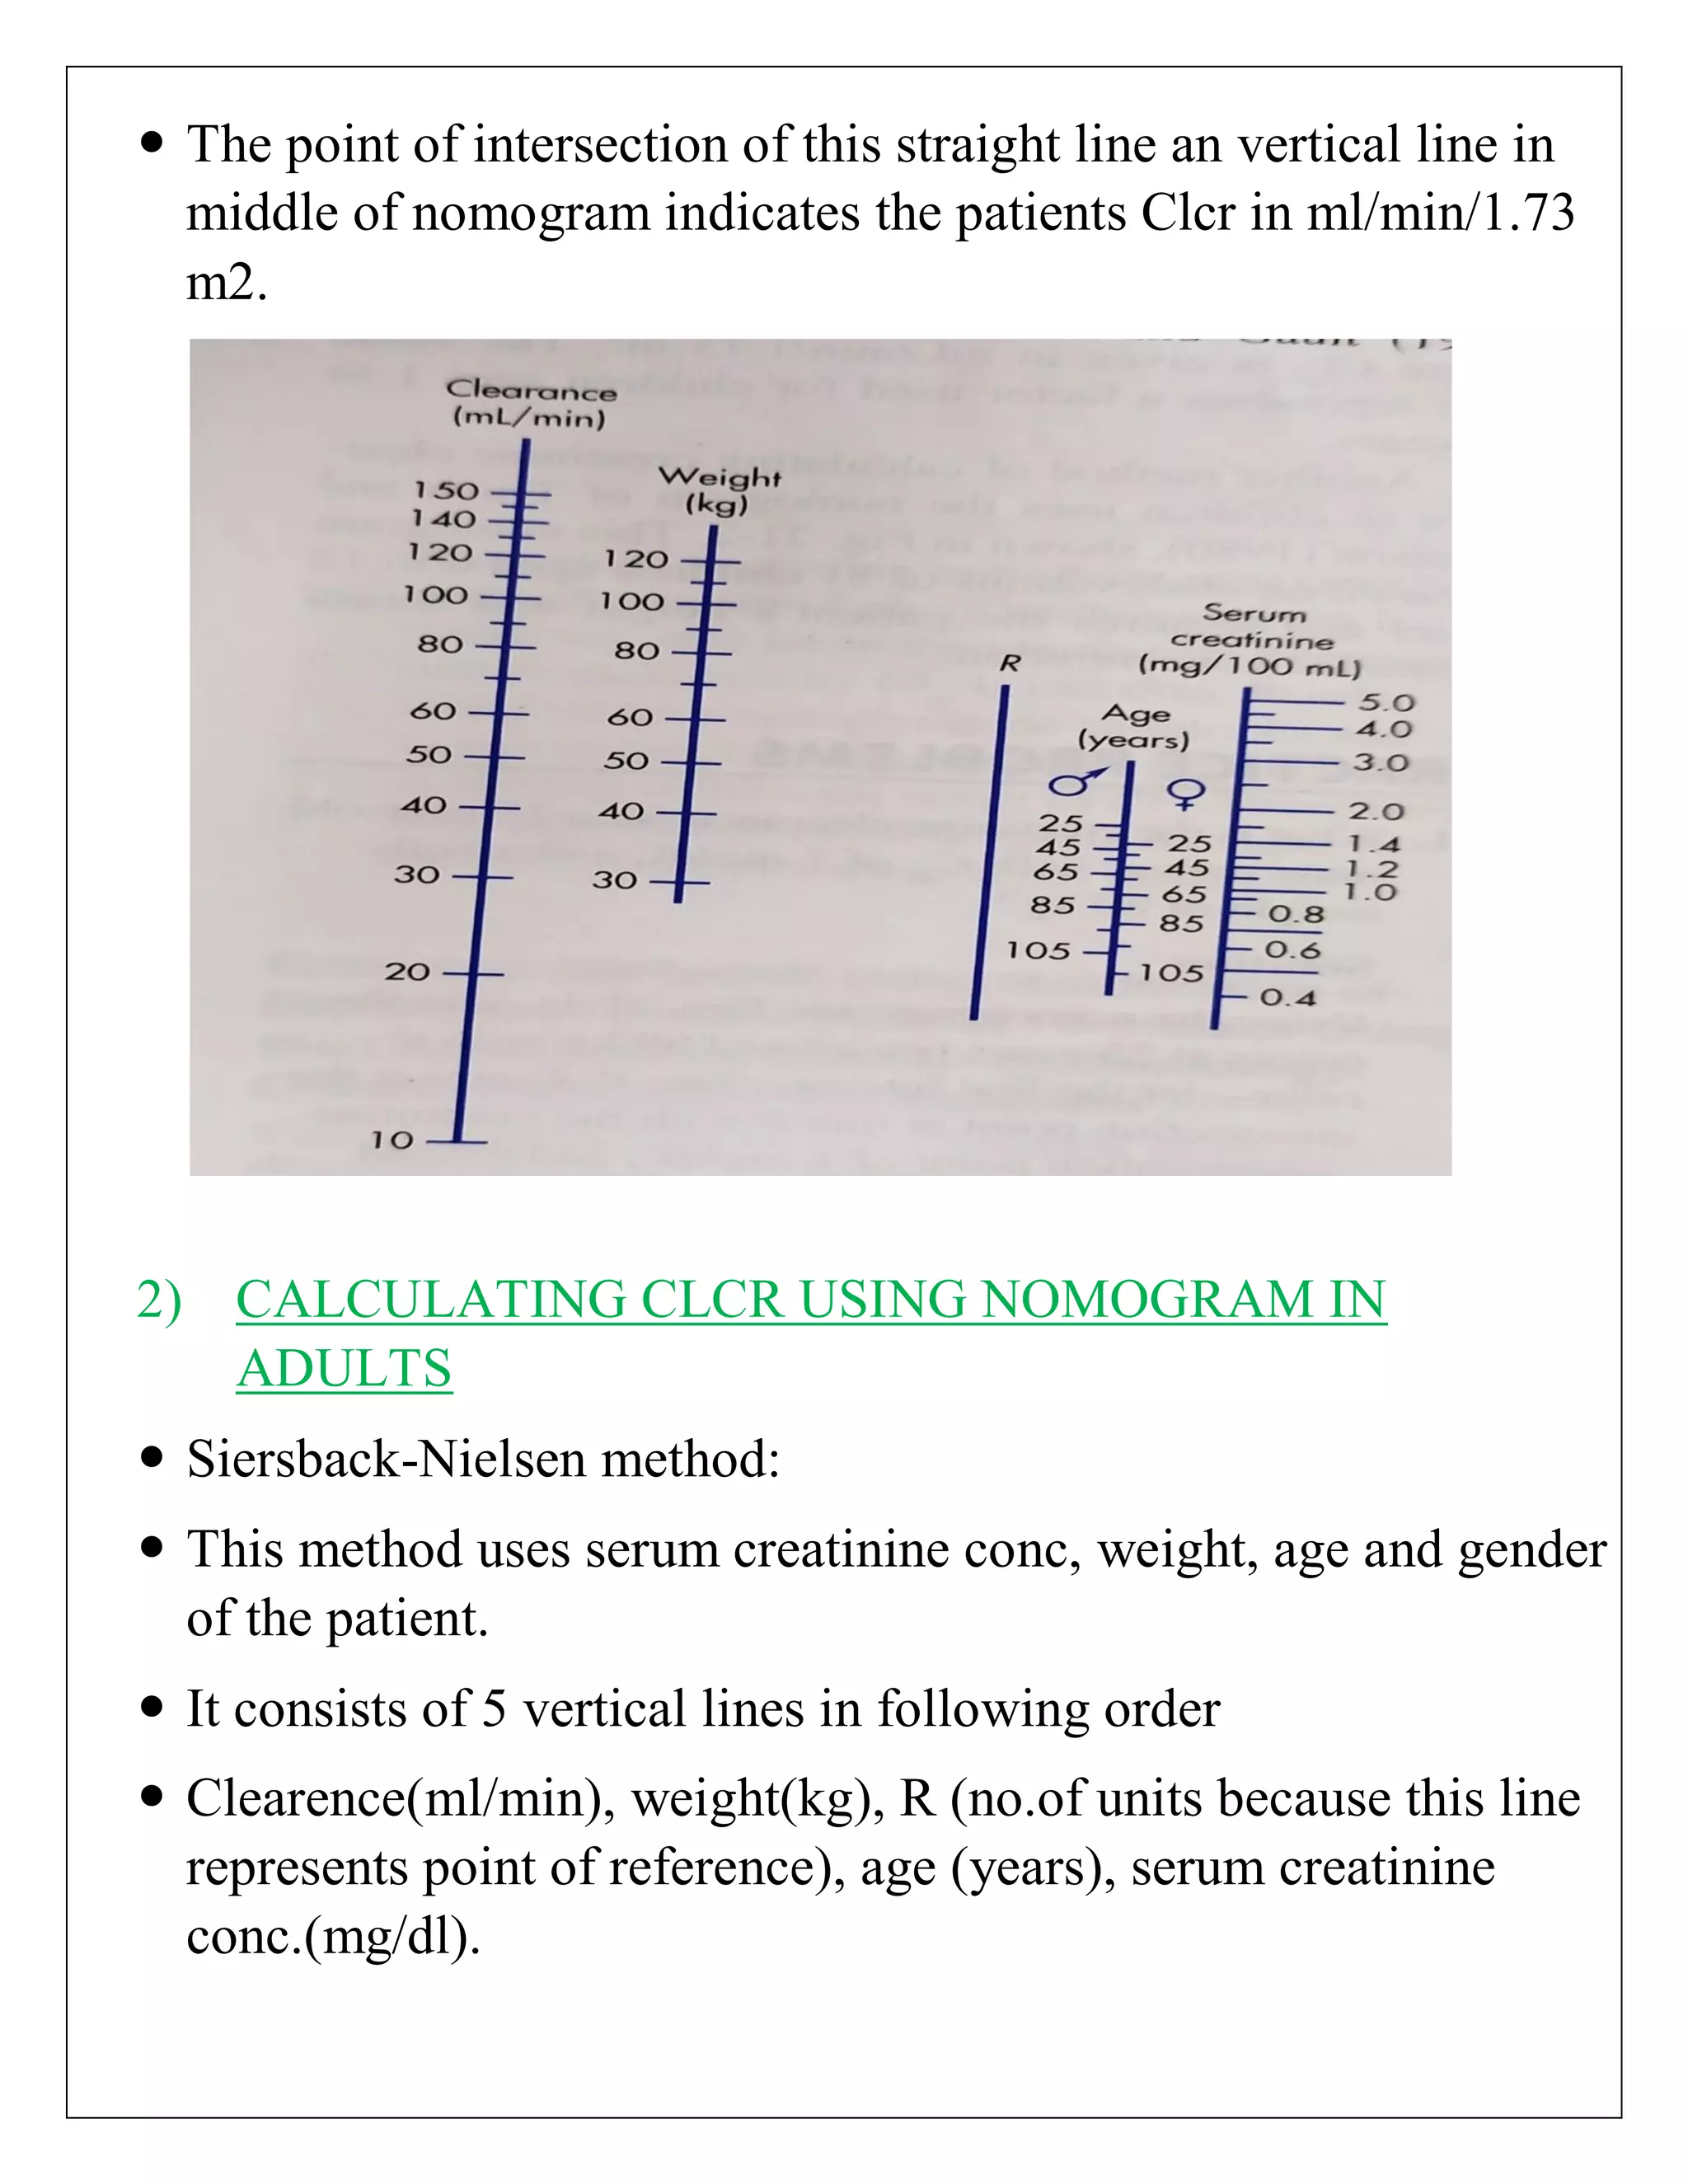
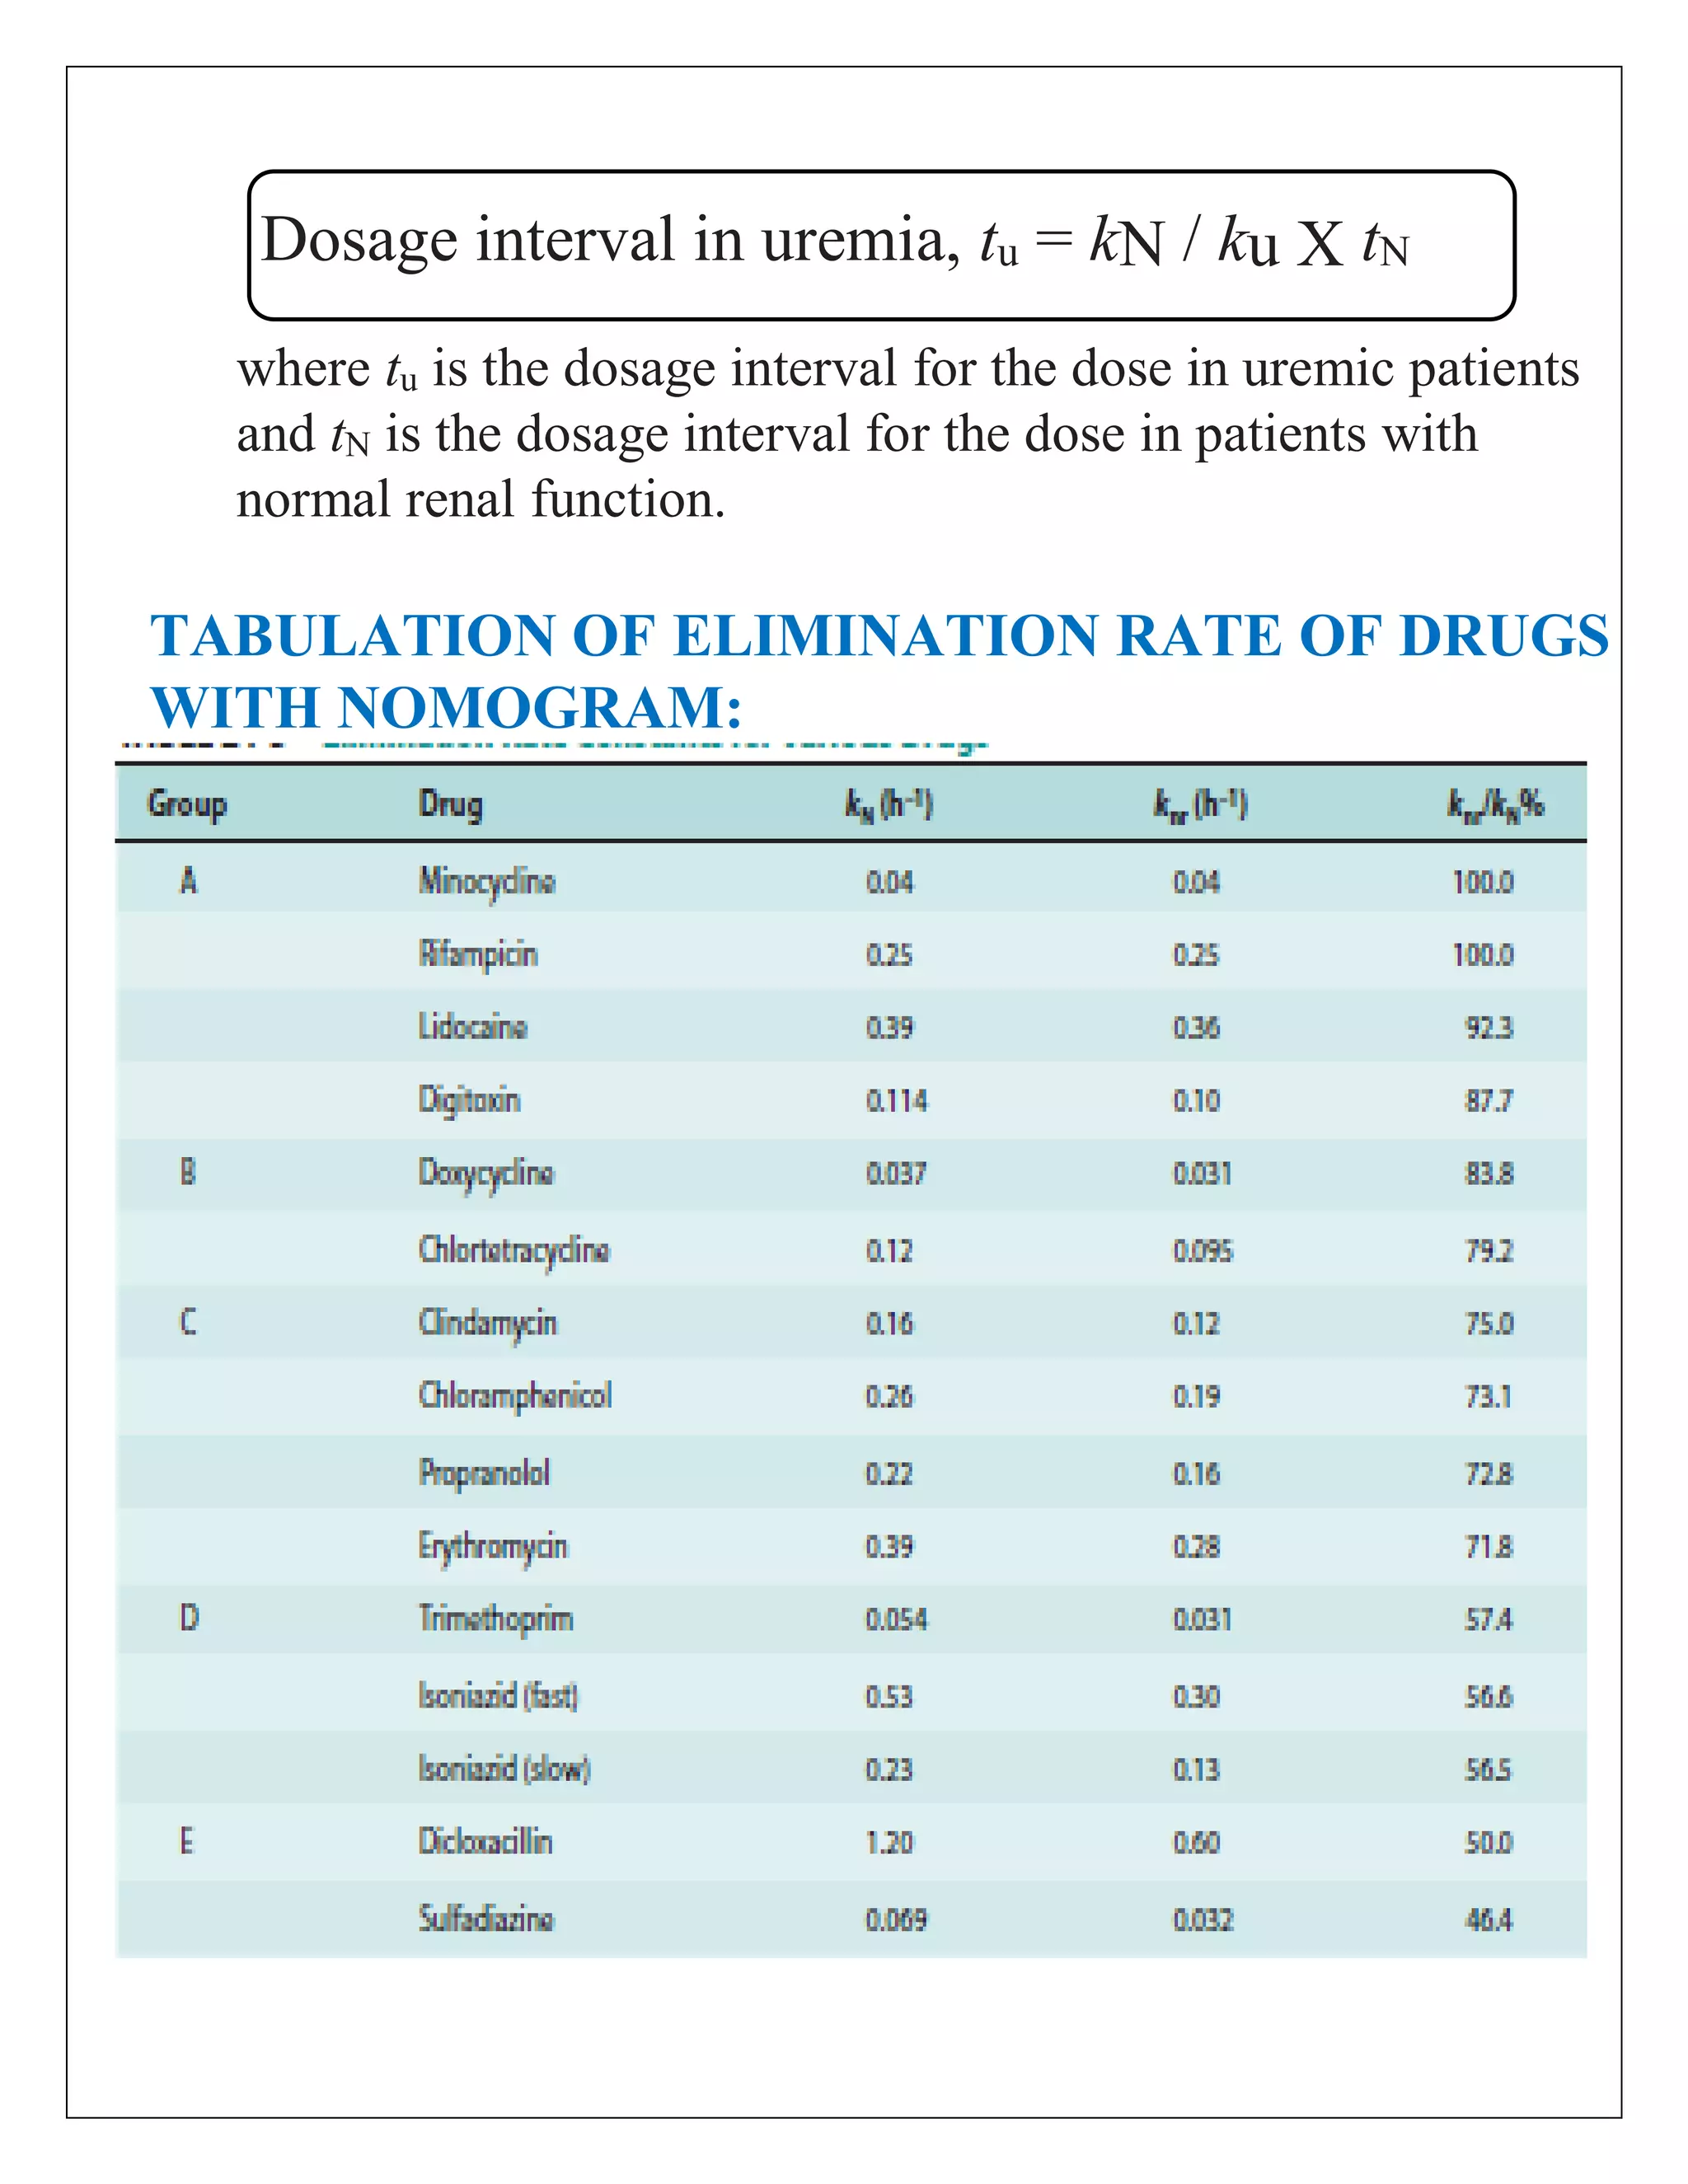
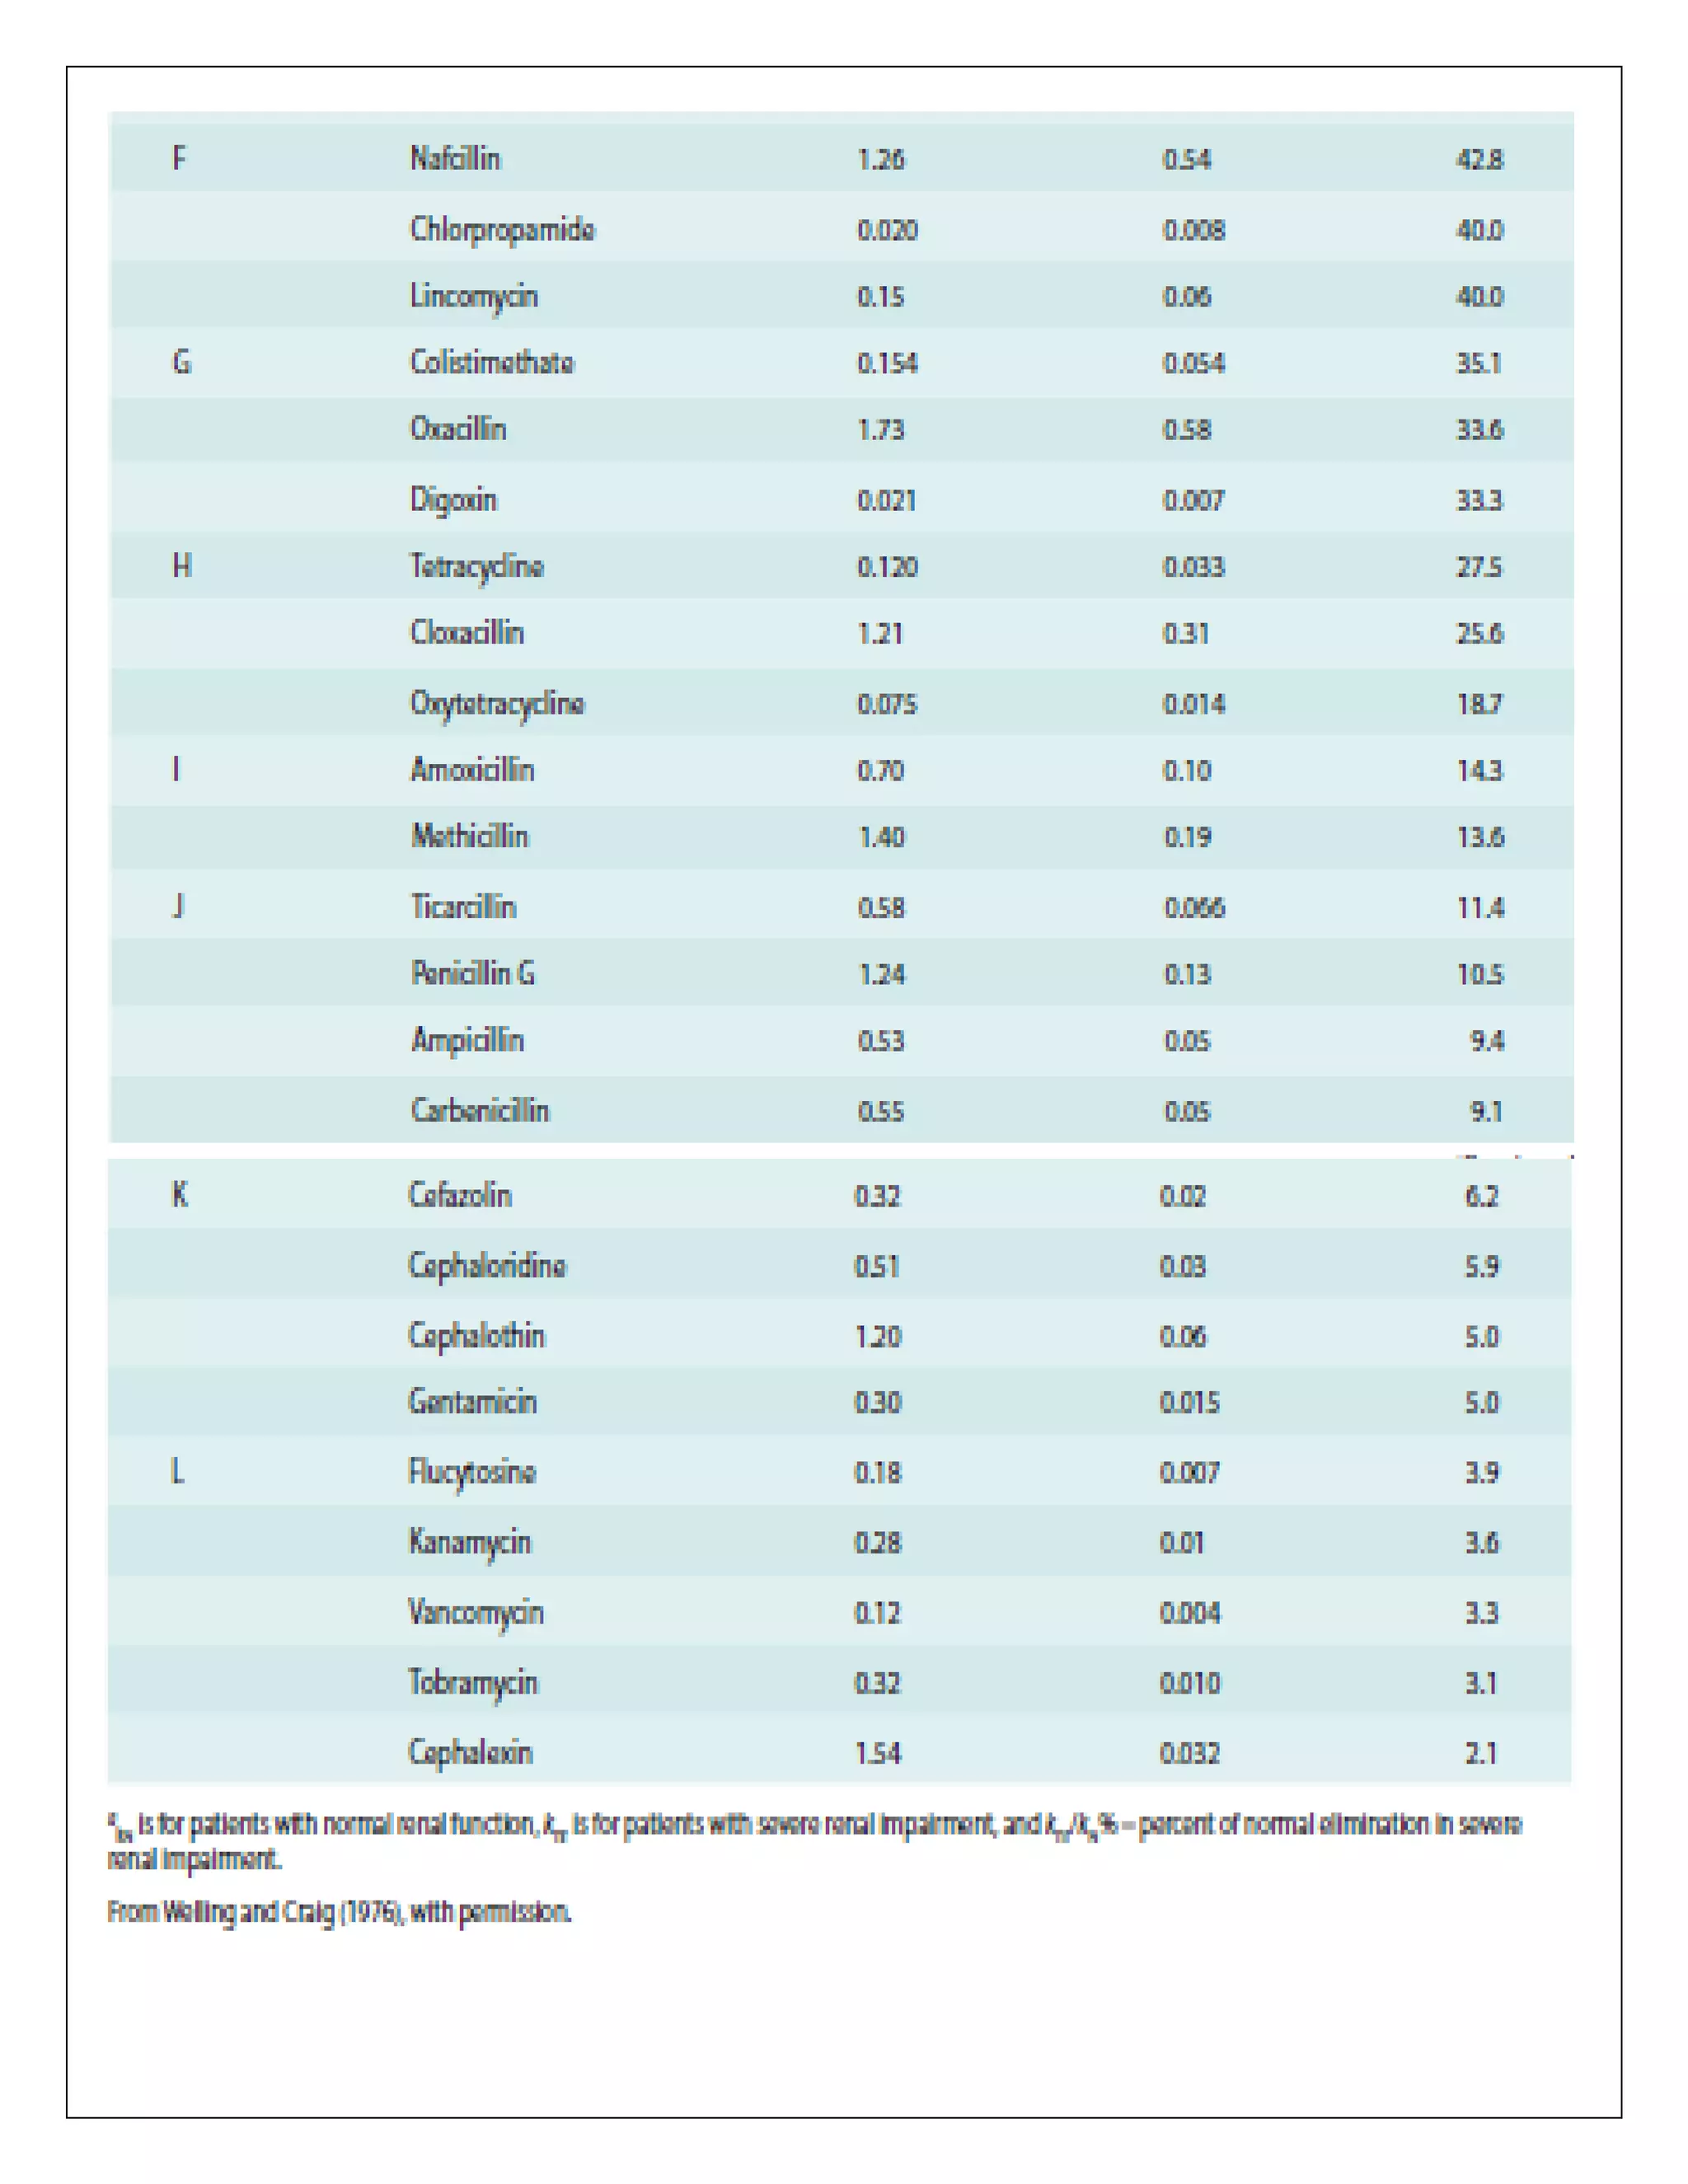
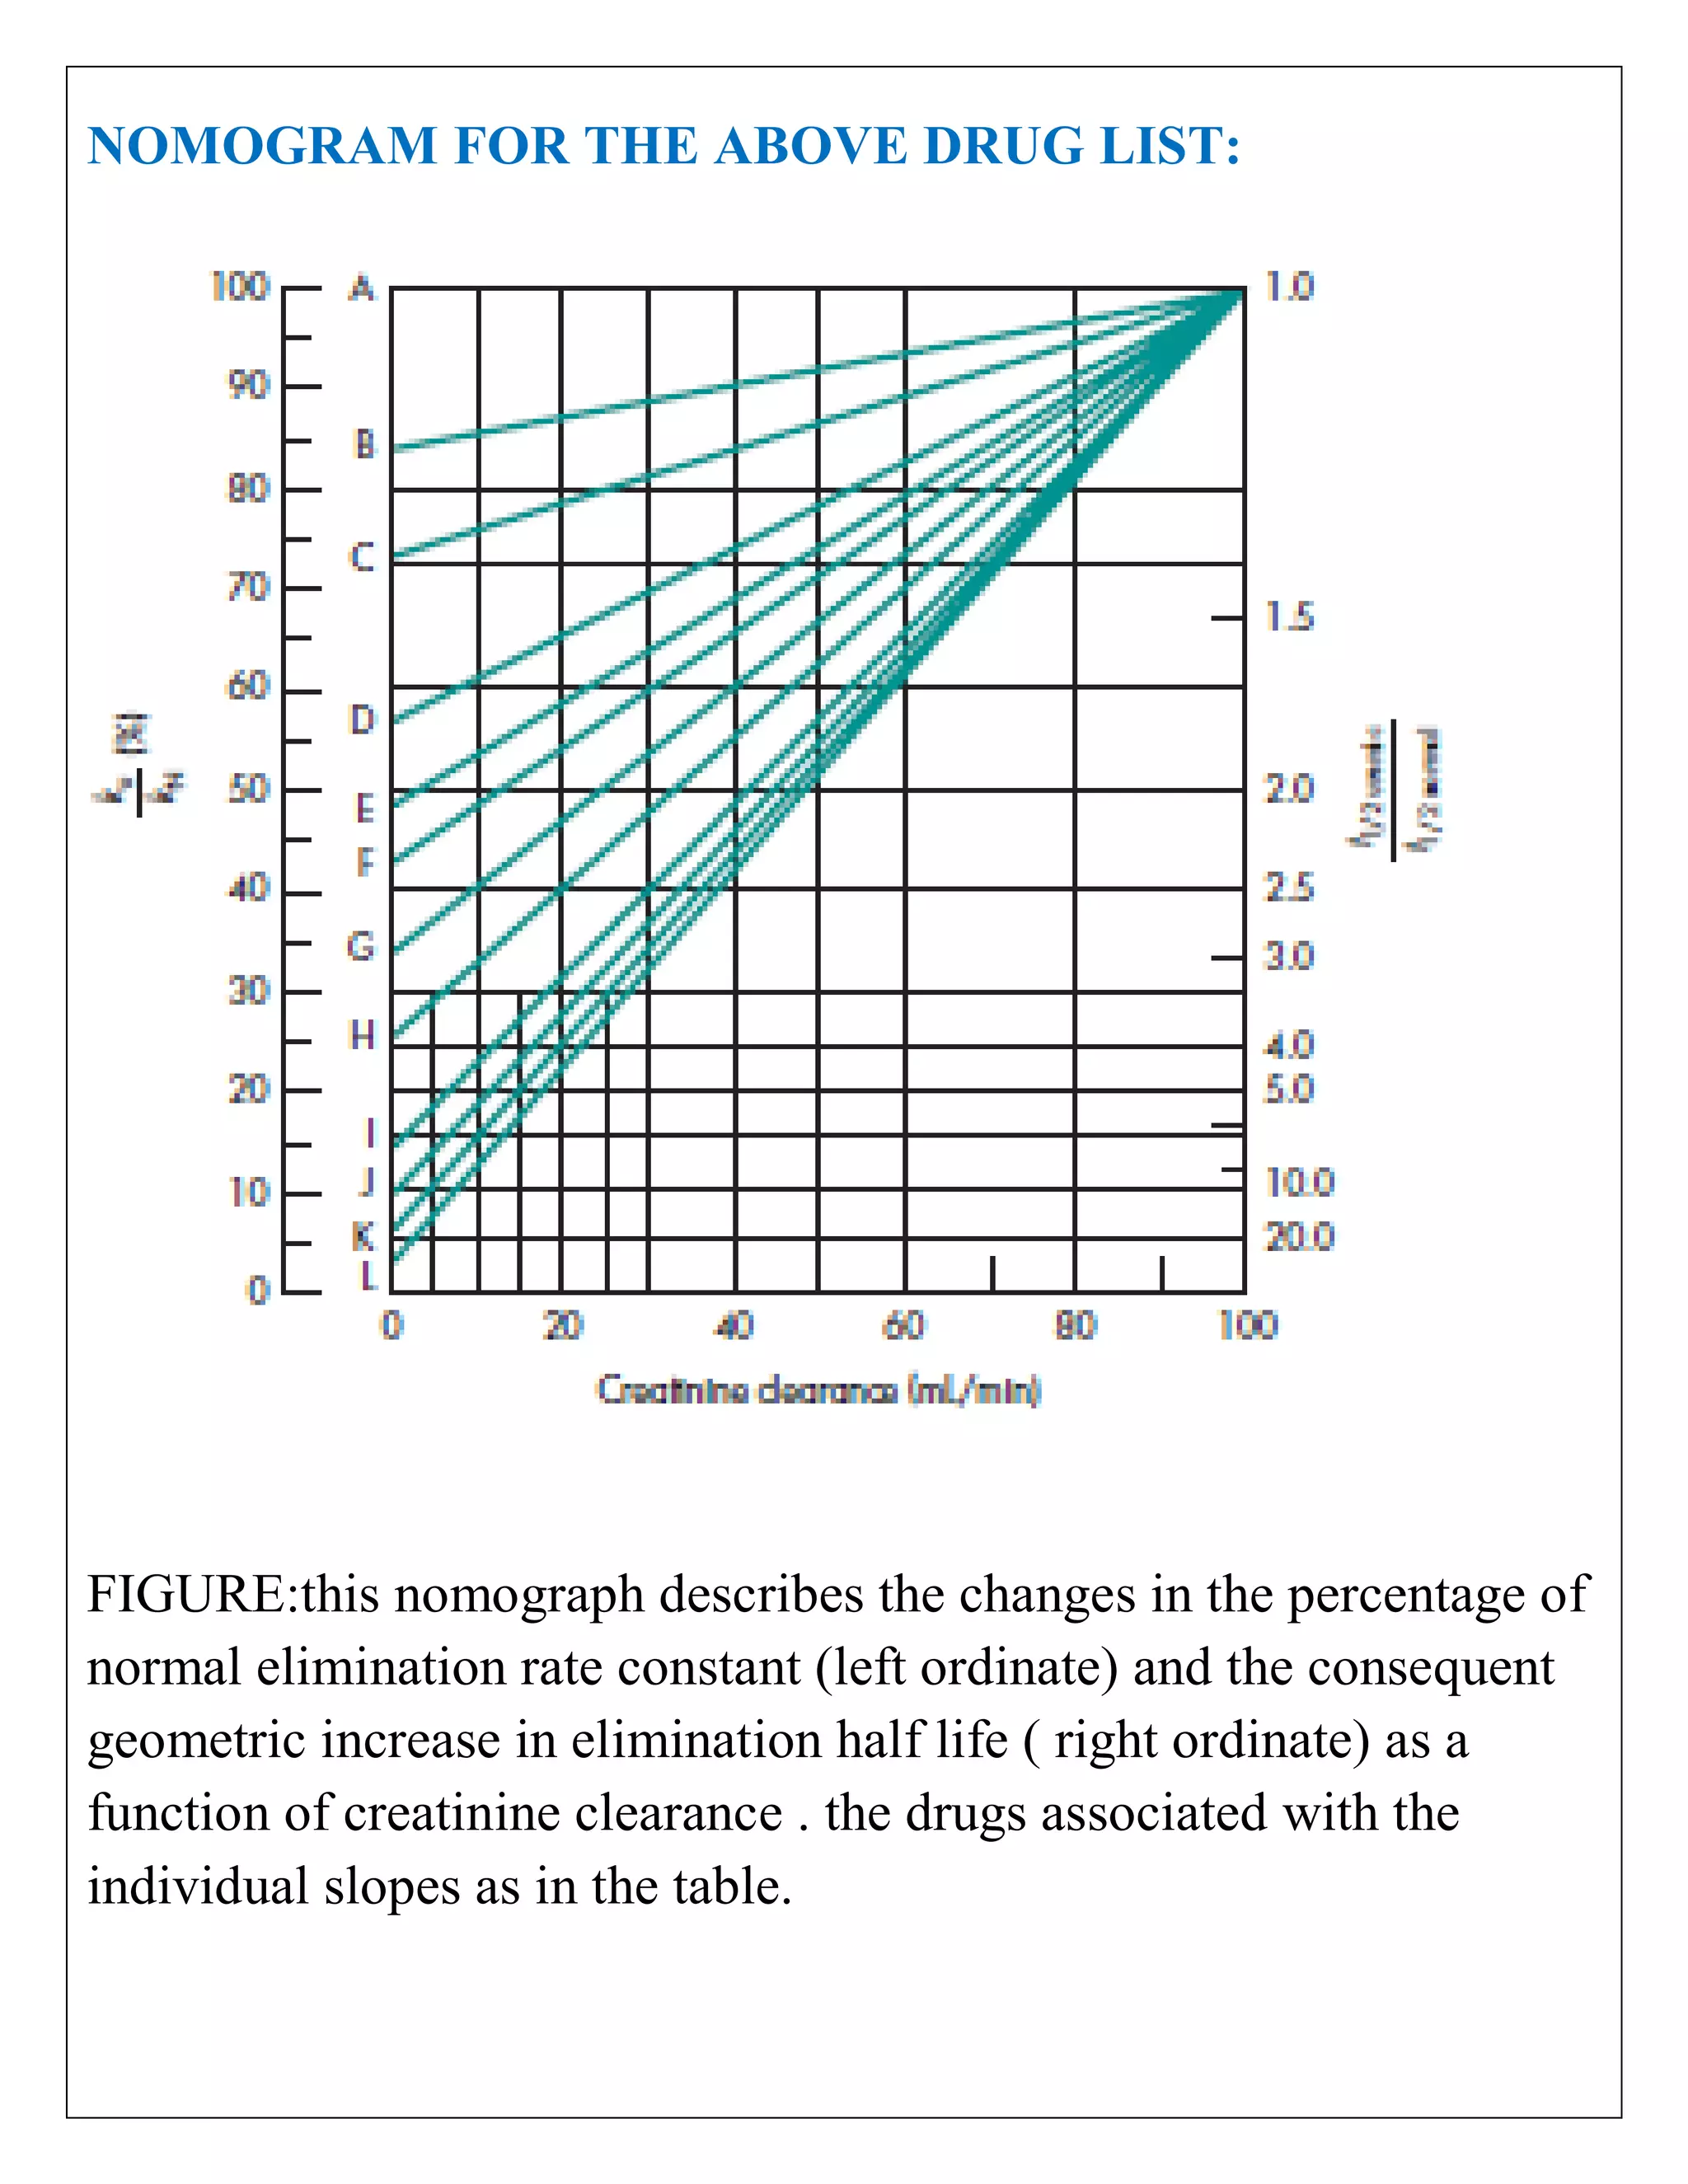
CLINICAL PHARMACOKINETICS &
PHARMACOTHERAPEUTIC DRUG
MONITORING
ASSIGNMENT ON NOMOGRAMS
AND TABULATIONS IN DESIGN OF DOSAGE
REGIMENS
SUBMITTED BY:
PAVITHRA .V
V- PHARM D
DESIGN OF DOSAGE REGIMENS:
Several methods may be used to design a dosage regimen.
Generally, the initial dosage of the drug is estimated using average
population pharmacokinetic parameters.
Which is obtained from the literature and modified according to
the patient’s known diagnosis, pathophysiology, demographics,
allergy, and any other known factor that might affect the
patient’s response to the dosage regimen.
After initiation of drug therapy, the patient is then monitored for
the therapeutic response by clinical and physical assessment.
After evaluation of the patient, adjustment of the dosage
regimen may be needed.
If necessary, measurement of plasma drug concentrations may
be used to obtain the patient’s individual pharmacokinetic
parameters from which the data are used to modify the dosage
regimen.
Further TDM in the patient may be needed.Various clinical
pharmacokinetic software pro- grams are available for dosage
regimen calculations.
The dosing strategies are based generally on pharma- cokinetic
calculations that were previously performed manually.
Computer automation and pharmacokinetic software packages
improve the accuracy of the calculation, make the calculations
“easier,” and have an added advantage of maintaining proper
documentation
However, the use of these software programs should not replace
good clinical judgment.
The package insert (PI) is a useful source for dose regimen. The
section Use in Specific Populations provides information that may
apply to individual patients.
SPECIAL POPULATION:
• Pregnancy
• Labor and delivery
• Nursing mothers
• Pediatric use
• Geriatric use
• Hepatic impairment
• Renal impairment
• Gender effect
IMPORTANCE OF NOMOGRAMS AND TABULATIONS IN
DESIGNING DOSAGE REGIMEN:
NOMOGRAMS:
For ease of calculation of dosage regimens, many clinicians
rely on nomograms to calculate the proper dosage regimen for
their patients.
 The use of a nomogram may give a quick dosage regimen
adjustment for patients with characteristics requiring
adjustments, such as age, body weight, and physiologic state.
In general, the nomogram of a drug is based on population
pharmacokinetic data collected and analyzed using a specific
pharmacokinetic model.
 In order to keep the dosage regimen calculation simple,
complicated equations are often solved and the results
displayed diagrammatically on special scaled axes or as a
table to produce a simple dose recommendation based on
patient information.
 Some nomograms make use of certain physiologic
parameters, such as serum creatinine concentration, to help
modify the dosage regimen according to renal function
Pharmaceutical manufacturers provide dosage
recommendations in the approved label for many marketed
drugs in the form of a table or as a nomogram.
These are general guidelines to aid the clinician in
establishing an initial dosage regimen for patients.
TABULATION:
The tables may include loading and maintenance doses that
are modified for the demographics of the patient (eg, age,
weight) and for certain disease states (eg, renal
insufficiency).
EXAMPLES:
For drugs with a narrow therapeutic range, such as
theophylline, a guide for monitoring serum drug
concentrations is given.
Another example is the aminoglycoside antibiotic,
tobramycin sulfate USP ,which is eliminated primarily by
renal clearance.
Thus, the dosage of tobramycin sulfate should be reduced
in direct proportion to a reduction in creatinine clearance.
-The manufacturer provides a nomogram for estimating
the percent of the normal dose of tobramycin sulfate
assuming the serum creatinine level (mg/100 mL) has
been obtained.
NOMOGRAM:
Nomograms or equations, which describe the
relationships between patient characteristics (e.g. Age, weight,
gender, disease states, interacting drugs, environmental factors-
smoking & food) and pharmacokinetic parameters in a population,
are often used to estimate the initial pharmacokinetic parameters for
drug dosing in individual patients for whom patient-specific
parameters are not known.
CONSTRUCTION OF NOMOGRAM:
o A nomogram typically has 3 scales:
Two scales represent known values and one scale where the
result is read off.
The known scales are placed on the outside; i.e. the result scale
is in the center
Each known value of the calculation is marked on the outer
scales and a line is drawn between each mark.
Where the line and the inside scale intersects is the result
Examples include, height- BMI- weight, total clearance-
maintenance dose- lean body weight, etc.
In order to keep the dosage regimen calculation simple,
complicated equations are often solved and their results
displayed diagrammatically on special scaled axes to produce a
simple dose recommendation based on patient information.
Some nomograms make use of certain physiologic parameters,
such as serum creatinine concentration, to help modify the
dosage regimen according to renal function
 For many marketed drugs, the manufacturer provides tabulated
general guidelines for use in establishing a dosage regimen for
patients, including loading and maintenance doses.
Commonly applied nomogram in determining BMI:
NOMOGRAM IN UREMIC PATIENTS:
Nomograms are charts available for use in estimating dosage
regimens in uremic patients The nomograms may be based on
serum creatinine concentrations, patient data (height, weight, age,
gender), and the pharmacokinetics of the drug.
As discussed by Chennavasin and Brater (1981), each
nomogram has errors in its assumptions and drug database.
Most methods for dose adjustment in renal disease assume
that nonrenal elimination of the drug is not affected by renal
impairment and that the remaining renal excretion rate constant
in the uremic patient is proportional to the product of a constant
and the Clcr:
ku = knr + αClcr
where knr is the nonrenal elimination rate constant and α
is a constant.
Equation is similar to next Equation,
where 1/VD, and it can be used for the construction of a
nomogram.
NOMOGRAM FOR RELATIONSHIP BETWEEN
CREATININE CLEARENCE AND ELIMINATION RATE
CONSTANT FOR FOUR DRUGS:
Figure shows a graphical representation of
Equation for four different drugs, each with a different renal
excretion rate constant.
The fractions of drug excreted unchanged in the urine (fe) for
drugs A, B, C, and D are 5%, 50%, 75%, and 90%, respectively.
A Clcr of ≥80 mL/min is considered an adequate GFR in subjects
with normal renal function.
The uremic elimination rate constant (ku) is the sum of the
nonrenal elimination rate con- stant and the renal elimination rate
constant, which is decreased due to renal impairment.
If the patient has complete renal shutdown (ie, Clcr = 0 mL/min),
then the intercept on the y axis represents the percent of drug
elimination due to nonrenal drug elimination routes.
Drug D, which is excreted 90% unchanged in the urine, has the
steepest slope (equivalent to = in Equation 24.14) and is most
affected by small changes in Clcr.
 On the other hand, drug A, which is excreted only 5%
unchanged in the urine (ie, 95% eliminated by nonrenal routes),
is least affected by a decrease in creatinine clearance.
1) CALCULATING CLCR USING NOMOGRAM IN
CHILDREN
Traub and Johnson method:
 According to this method nomogram is developed based on
observation of 81 children between6 and 12 years.
 Nomogram consists of 3 vertical straight lines drawn parallel to
each other and at a suitable distance from each other.
 Vertical line on left represents serum creatinine conc.- it is again
divided in to subunits expressing serum creatineconc in
mg/100ml.
 Vertical line on right represents the height- it is again divided in
to units expressing height of child in cm.
 Vertical line on middle of these 2lines represent Clcr-it is again
subdivided in to units expressing Clcr in ml/min/1.73m2.
 Draw a straight line to connect patient serum creatinine values
to patient height in cm.
 The point of intersection of this straight line an vertical line in
middle of nomogram indicates the patients Clcr in ml/min/1.73
m2.
2) CALCULATING CLCR USING NOMOGRAM IN
ADULTS
 Siersback-Nielsen method:
 This method uses serum creatinine conc, weight, age and gender
of the patient.
 It consists of 5 vertical lines in following order
 Clearence(ml/min), weight(kg), R (no.of units because this line
represents point of reference), age (years), serum creatinine
conc.(mg/dl).
ESTIMATION OF ELIMINATION RATE CONSTANT BY
NOMOGRAM METHOD OF WELLING AND CRAIG:
The nomogram method of Welling and Craig (1976)
provides an estimate of the ratio of the uremic elimination rate
constant (ku) to the normal elimination rate constant (kN) on the
basis of Clcr (Fig).
For this method, Welling and Craig (1976) provided a list of
drugs grouped according to the amount of drug excreted
unchanged in the urine (Table).
From the ku/kN ratio, the uremic dose can be estimated
according to Equation:
Uremic dose= ku/kN X normal dose
When the dosage interval is kept constant, the uremic dose is
always a smaller fraction of the normal dose.
Instead of reducing the dose for a uremic patient, the usual dose is
kept constant and the dosage interval is prolonged according to the
following equation:
Dosage interval in uremia, tu = kN / ku X tN
where tu is the dosage interval for the dose in uremic patients
and tN is the dosage interval for the dose in patients with
normal renal function.
TABULATION OF ELIMINATION RATE OF DRUGS
WITH NOMOGRAM:
NOMOGRAM FOR THE ABOVE DRUG LIST:
FIGURE:this nomograph describes the changes in the percentage of
normal elimination rate constant (left ordinate) and the consequent
geometric increase in elimination half life ( right ordinate) as a
function of creatinine clearance . the drugs associated with the
individual slopes as in the table.
REFERENCE:
Shargel and yu’s “APPLIED BIOPHARMACEUTICS AND
PHARMACOKINETICS” – Seventh Edition by leon shargel
and Andrew B.C . YU

Nomograms and tabulations in design of dosage regimens

  • 1.
    CLINICAL PHARMACOKINETICS & PHARMACOTHERAPEUTICDRUG MONITORING ASSIGNMENT ON NOMOGRAMS AND TABULATIONS IN DESIGN OF DOSAGE REGIMENS SUBMITTED BY: PAVITHRA .V V- PHARM D
  • 2.
    DESIGN OF DOSAGEREGIMENS: Several methods may be used to design a dosage regimen. Generally, the initial dosage of the drug is estimated using average population pharmacokinetic parameters. Which is obtained from the literature and modified according to the patient’s known diagnosis, pathophysiology, demographics, allergy, and any other known factor that might affect the patient’s response to the dosage regimen. After initiation of drug therapy, the patient is then monitored for the therapeutic response by clinical and physical assessment. After evaluation of the patient, adjustment of the dosage regimen may be needed. If necessary, measurement of plasma drug concentrations may be used to obtain the patient’s individual pharmacokinetic parameters from which the data are used to modify the dosage regimen. Further TDM in the patient may be needed.Various clinical pharmacokinetic software pro- grams are available for dosage regimen calculations. The dosing strategies are based generally on pharma- cokinetic calculations that were previously performed manually. Computer automation and pharmacokinetic software packages improve the accuracy of the calculation, make the calculations “easier,” and have an added advantage of maintaining proper documentation
  • 3.
    However, the useof these software programs should not replace good clinical judgment. The package insert (PI) is a useful source for dose regimen. The section Use in Specific Populations provides information that may apply to individual patients. SPECIAL POPULATION: • Pregnancy • Labor and delivery • Nursing mothers • Pediatric use • Geriatric use • Hepatic impairment • Renal impairment • Gender effect IMPORTANCE OF NOMOGRAMS AND TABULATIONS IN DESIGNING DOSAGE REGIMEN: NOMOGRAMS: For ease of calculation of dosage regimens, many clinicians rely on nomograms to calculate the proper dosage regimen for their patients.  The use of a nomogram may give a quick dosage regimen adjustment for patients with characteristics requiring adjustments, such as age, body weight, and physiologic state. In general, the nomogram of a drug is based on population pharmacokinetic data collected and analyzed using a specific pharmacokinetic model.
  • 4.
     In orderto keep the dosage regimen calculation simple, complicated equations are often solved and the results displayed diagrammatically on special scaled axes or as a table to produce a simple dose recommendation based on patient information.  Some nomograms make use of certain physiologic parameters, such as serum creatinine concentration, to help modify the dosage regimen according to renal function Pharmaceutical manufacturers provide dosage recommendations in the approved label for many marketed drugs in the form of a table or as a nomogram. These are general guidelines to aid the clinician in establishing an initial dosage regimen for patients. TABULATION: The tables may include loading and maintenance doses that are modified for the demographics of the patient (eg, age, weight) and for certain disease states (eg, renal insufficiency). EXAMPLES: For drugs with a narrow therapeutic range, such as theophylline, a guide for monitoring serum drug concentrations is given. Another example is the aminoglycoside antibiotic, tobramycin sulfate USP ,which is eliminated primarily by renal clearance. Thus, the dosage of tobramycin sulfate should be reduced in direct proportion to a reduction in creatinine clearance. -The manufacturer provides a nomogram for estimating
  • 5.
    the percent ofthe normal dose of tobramycin sulfate assuming the serum creatinine level (mg/100 mL) has been obtained. NOMOGRAM: Nomograms or equations, which describe the relationships between patient characteristics (e.g. Age, weight, gender, disease states, interacting drugs, environmental factors- smoking & food) and pharmacokinetic parameters in a population, are often used to estimate the initial pharmacokinetic parameters for drug dosing in individual patients for whom patient-specific parameters are not known. CONSTRUCTION OF NOMOGRAM: o A nomogram typically has 3 scales: Two scales represent known values and one scale where the result is read off. The known scales are placed on the outside; i.e. the result scale is in the center Each known value of the calculation is marked on the outer scales and a line is drawn between each mark. Where the line and the inside scale intersects is the result Examples include, height- BMI- weight, total clearance- maintenance dose- lean body weight, etc. In order to keep the dosage regimen calculation simple, complicated equations are often solved and their results
  • 6.
    displayed diagrammatically onspecial scaled axes to produce a simple dose recommendation based on patient information. Some nomograms make use of certain physiologic parameters, such as serum creatinine concentration, to help modify the dosage regimen according to renal function  For many marketed drugs, the manufacturer provides tabulated general guidelines for use in establishing a dosage regimen for patients, including loading and maintenance doses. Commonly applied nomogram in determining BMI:
  • 7.
    NOMOGRAM IN UREMICPATIENTS: Nomograms are charts available for use in estimating dosage regimens in uremic patients The nomograms may be based on serum creatinine concentrations, patient data (height, weight, age, gender), and the pharmacokinetics of the drug. As discussed by Chennavasin and Brater (1981), each nomogram has errors in its assumptions and drug database. Most methods for dose adjustment in renal disease assume that nonrenal elimination of the drug is not affected by renal impairment and that the remaining renal excretion rate constant in the uremic patient is proportional to the product of a constant and the Clcr: ku = knr + αClcr where knr is the nonrenal elimination rate constant and α is a constant. Equation is similar to next Equation, where 1/VD, and it can be used for the construction of a nomogram. NOMOGRAM FOR RELATIONSHIP BETWEEN CREATININE CLEARENCE AND ELIMINATION RATE CONSTANT FOR FOUR DRUGS:
  • 8.
    Figure shows agraphical representation of Equation for four different drugs, each with a different renal excretion rate constant. The fractions of drug excreted unchanged in the urine (fe) for drugs A, B, C, and D are 5%, 50%, 75%, and 90%, respectively. A Clcr of ≥80 mL/min is considered an adequate GFR in subjects with normal renal function. The uremic elimination rate constant (ku) is the sum of the nonrenal elimination rate con- stant and the renal elimination rate constant, which is decreased due to renal impairment. If the patient has complete renal shutdown (ie, Clcr = 0 mL/min),
  • 9.
    then the intercepton the y axis represents the percent of drug elimination due to nonrenal drug elimination routes. Drug D, which is excreted 90% unchanged in the urine, has the steepest slope (equivalent to = in Equation 24.14) and is most affected by small changes in Clcr.  On the other hand, drug A, which is excreted only 5% unchanged in the urine (ie, 95% eliminated by nonrenal routes), is least affected by a decrease in creatinine clearance. 1) CALCULATING CLCR USING NOMOGRAM IN CHILDREN Traub and Johnson method:  According to this method nomogram is developed based on observation of 81 children between6 and 12 years.  Nomogram consists of 3 vertical straight lines drawn parallel to each other and at a suitable distance from each other.  Vertical line on left represents serum creatinine conc.- it is again divided in to subunits expressing serum creatineconc in mg/100ml.  Vertical line on right represents the height- it is again divided in to units expressing height of child in cm.  Vertical line on middle of these 2lines represent Clcr-it is again subdivided in to units expressing Clcr in ml/min/1.73m2.  Draw a straight line to connect patient serum creatinine values to patient height in cm.
  • 10.
     The pointof intersection of this straight line an vertical line in middle of nomogram indicates the patients Clcr in ml/min/1.73 m2. 2) CALCULATING CLCR USING NOMOGRAM IN ADULTS  Siersback-Nielsen method:  This method uses serum creatinine conc, weight, age and gender of the patient.  It consists of 5 vertical lines in following order  Clearence(ml/min), weight(kg), R (no.of units because this line represents point of reference), age (years), serum creatinine conc.(mg/dl).
  • 11.
    ESTIMATION OF ELIMINATIONRATE CONSTANT BY NOMOGRAM METHOD OF WELLING AND CRAIG: The nomogram method of Welling and Craig (1976) provides an estimate of the ratio of the uremic elimination rate constant (ku) to the normal elimination rate constant (kN) on the basis of Clcr (Fig). For this method, Welling and Craig (1976) provided a list of drugs grouped according to the amount of drug excreted unchanged in the urine (Table). From the ku/kN ratio, the uremic dose can be estimated according to Equation: Uremic dose= ku/kN X normal dose When the dosage interval is kept constant, the uremic dose is always a smaller fraction of the normal dose. Instead of reducing the dose for a uremic patient, the usual dose is kept constant and the dosage interval is prolonged according to the following equation:
  • 12.
    Dosage interval inuremia, tu = kN / ku X tN where tu is the dosage interval for the dose in uremic patients and tN is the dosage interval for the dose in patients with normal renal function. TABULATION OF ELIMINATION RATE OF DRUGS WITH NOMOGRAM:
  • 14.
    NOMOGRAM FOR THEABOVE DRUG LIST: FIGURE:this nomograph describes the changes in the percentage of normal elimination rate constant (left ordinate) and the consequent geometric increase in elimination half life ( right ordinate) as a function of creatinine clearance . the drugs associated with the individual slopes as in the table.
  • 15.
    REFERENCE: Shargel and yu’s“APPLIED BIOPHARMACEUTICS AND PHARMACOKINETICS” – Seventh Edition by leon shargel and Andrew B.C . YU