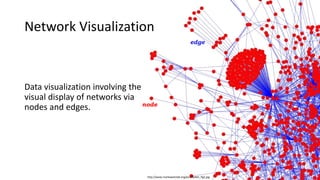
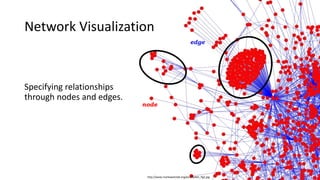
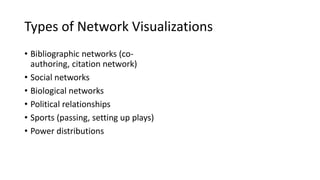
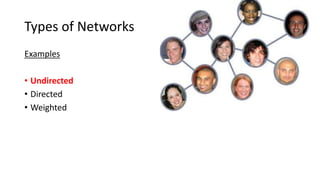
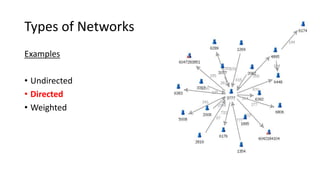
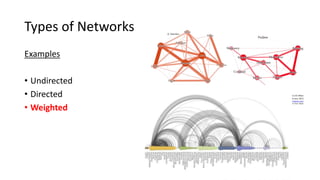
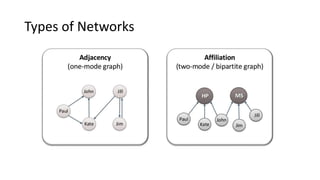
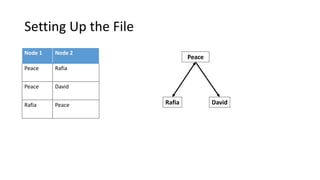
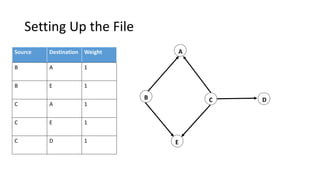
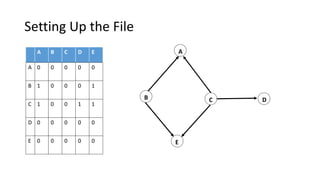
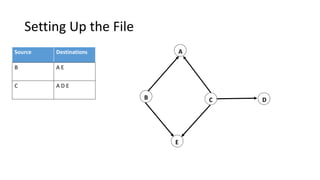
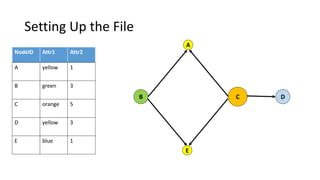
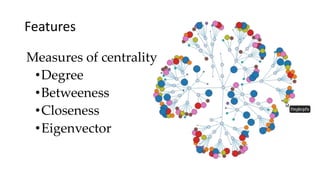
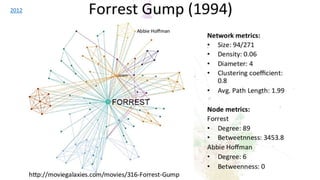
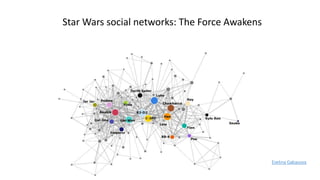
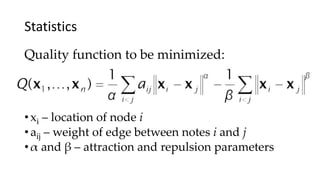
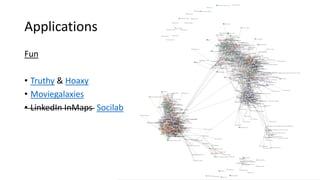
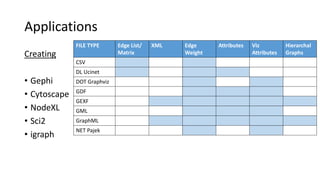
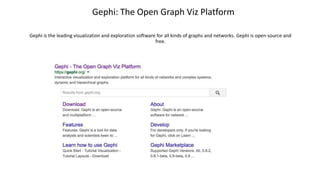
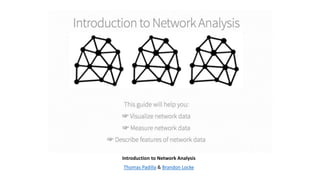
SlideShare a Scribd company logo
Social Network
Visualization 101
Contact Information
Rafia Mirza | Digital Humanities Librarian
@LibrarianRafia | rafia@uta.edu
Peace Ossom Williamson | Director for Research Data Services
@123POW | peace@uta.edu
How to viz
1. Determine what to say
2. Find/collect the data you need
3. Wrangle!
4. Clean!
(Repeat 3 & 4 many more times)
5. Come to a final product/conclusion
What is Data Viz?
Data Visualization
The graphical display of
abstract information for two
purposes:
• sense-making
• communication
https://www.interaction-design.org/literature/book/the-encyclopedia-of-human-computer-interaction-2nd-ed/data-
visualization-for-human-perception
Others
52%
Heather 1%
Lydia 6%
Peace
13%
Kaeli
28%
Answering Nursing Questions
Most nursing questions are not reaching the
nursing team, as we are answering fewer than
50% recorded.
0
20
40
60
80
100
120
12
am
1 2 3 4 5 6 7 8 9 10 11 12
pm
1 2 3 4 5 6 7 8 9 10 11
pm
Hourly Question Frequency
Chat Questions Total Questions
Data Visualization
The graphical display of
abstract information for two
purposes:
• sense-making
• communication
5
11
36
58
61
102
202
409
0 100 200 300 400 500
In-Person
Ask a Librarian
Blank
Phone
Appointment
Drop-In
Email
Chat
Number of questions per semester
How Nursing Questions are Received
Chat is the primary method, followed by emails.
Together, they make up 70% of incoming nursing
questions.
https://www.interaction-design.org/literature/book/the-encyclopedia-of-human-computer-interaction-2nd-ed/data-
visualization-for-human-perception
Data Visualization
The graphical display of
abstract information for two
purposes:
• sense-making
• communication
https://www.interaction-design.org/literature/book/the-encyclopedia-of-human-computer-interaction-2nd-ed/data-
visualization-for-human-perception
Potential Actions:
• Put nursing librarians on chat
• Inform staff on chat how to answer
common questions
• Make contact methods clear to nursing
students
• Be available during hours questions are
most often asked
What is Network Viz?
Network Visualization
http://www.markowetzlab.org/pics/dyNet_fig2.jpg
Data visualization involving the
visual display of networks via
nodes and edges. node
edge
Network Visualization
http://www.markowetzlab.org/pics/dyNet_fig2.jpg
Specifying relationships
through nodes and edges.
node
edge
http://www.pfeffer.at/data/visposter/
Types of Network Visualizations
• Bibliographic networks (co-
authoring, citation network)
• Social networks
• Biological networks
• Political relationships
• Sports (passing, setting up plays)
• Power distributions
What is SNA?
How does it relate to the discipline of History?
Social network analysis (SNA)
• “Social network analysis (SNA) is the process of investigating social
structures through the use of network and graph theories. It
characterizes networked structures in terms of nodes (individual
actors, people, or things within the network) and the ties, edges, or
links (relationships or interactions) that connect them.”
• via Wikipedia
• History of Network Analysis (link to ppt)
Social network analysis in History
• Networks in Historical Research
• “The use of formal network methods for historical research is much more
recent, with only a few exceptions dating back beyond thirty years.”
• Historical Network Research: Network analysis in the historical
disciplines
• “Among historians, the term network has been used in a metaphorical sense
alone for a long time. It was only recently that this has changed.”
Social network analysis in History
• Visualizing Historical Networks Website
• “Kindred Britain is a network of nearly 30,000 individuals — many of
them iconic figures in British culture — connected through family
relationships of blood, marriage, or affiliation. It is a vision of the
nation’s history as a giant family affair.”
International Review of Social History
What types of networks are
there?
Types of Networks
Examples
• Undirected
• Directed
• Weighted
Types of Networks
Examples
• Undirected
• Directed
• Weighted
Types of Networks
Examples
• Undirected
• Directed
• Weighted
Types of Networks
How do you structure your data
to do network viz?
Setting Up the File
Node 1 Node 2
Peace Rafia
Peace David
Rafia Peace
Peace
Rafia David
Setting Up the File
Source Destination Weight
B A 1
B E 1
C A 1
C E 1
C D 1
A
B C D
E
Setting Up the File
A B C D E
A 0 0 0 0 0
B 1 0 0 0 1
C 1 0 0 1 1
D 0 0 0 0 0
E 0 0 0 0 0
A
B C D
E
Setting Up the File
Source Destinations
B A E
C A D E
A
B C D
E
Setting Up the File
NodeID Attr1 Attr2
A yellow 1
B green 3
C orange 5
D yellow 3
E blue 1
A
B C D
E
Attractiveness
Ensure the following:
• Related nodes are close
• Groups of related nodes are
clustered together
• Sufficient empty space between
nodes, minimal overlapping
http://www.markowetzlab.org/pics/dyNet_fig2.jpg
Attractiveness
Measures of centrality
•Degree
•Betweeness
•Closeness
•Eigenvector
Features
2012
Star Wars social networks: The Force Awakens
Evelina Gabasova
Quality function to be minimized:
• xi – location of node i
• aij – weight of edge between notes i and j
• α and β – attraction and repulsion parameters
Statistics
β = -7 β = -6 β = -5 β = -4 β = -3
Attraction = 2
Repulsion = -1
Attraction = 2
Repulsion = 0
Attraction = 2
Repulsion = 1
A Co-Citation Network for Philosophy
Kieran Healy
Applications
Fun
• Truthy & Hoaxy
• Moviegalaxies
• LinkedIn InMaps Socilab
Applications
Creating
• Gephi
• Cytoscape
• NodeXL
• Sci2
• igraph
FILE TYPE Edge List/
Matrix
XML Edge
Weight
Attributes Viz
Attributes
Hierarchal
Graphs
CSV
DL Ucinet
DOT Graphviz
GDF
GEXF
GML
GraphML
NET Pajek
Gephi: The Open Graph Viz Platform
Gephi is the leading visualization and exploration software for all kinds of graphs and networks. Gephi is open-source and
free.
Introduction to Network Analysis
Thomas Padilla & Brandon Locke
Examples
• Sample data sets
• snap.stanford.edu/data
• www-
personal.umich.edu/~mejn/
netdata
• wiki.gephi.org/index.php/da
tasets
Visual complexity
Questions?

More Related Content

What's hot

Social Network Analysis: What It Is, Why We Should Care, and What We Can Lear...
Social Network Analysis: What It Is, Why We Should Care, and What We Can Lear...Social Network Analysis: What It Is, Why We Should Care, and What We Can Lear...
Social Network Analysis: What It Is, Why We Should Care, and What We Can Lear...
Xiaohan Zeng
 
Social Media Mining - Chapter 9 (Recommendation in Social Media)
Social Media Mining - Chapter 9 (Recommendation in Social Media)Social Media Mining - Chapter 9 (Recommendation in Social Media)
Social Media Mining - Chapter 9 (Recommendation in Social Media)
SocialMediaMining
 
CS6010 Social Network Analysis Unit IV
CS6010 Social Network Analysis Unit IVCS6010 Social Network Analysis Unit IV
CS6010 Social Network Analysis Unit IV
pkaviya
 
Social network analysis
Social network analysisSocial network analysis
Social network analysis
Caleb Jones
 
Introduction to Social Network Analysis
Introduction to Social Network AnalysisIntroduction to Social Network Analysis
Introduction to Social Network Analysis
Premsankar Chakkingal
 
Introduction to Social Network Analysis
Introduction to Social Network AnalysisIntroduction to Social Network Analysis
Introduction to Social Network Analysis
Toronto Metropolitan University
 
CS6010 Social Network Analysis Unit I
CS6010 Social Network Analysis Unit ICS6010 Social Network Analysis Unit I
CS6010 Social Network Analysis Unit I
pkaviya
 
09 Ego Network Analysis
09 Ego Network Analysis09 Ego Network Analysis
09 Ego Network Analysis
Duke Network Analysis Center
 
Social Network Analysis
Social Network AnalysisSocial Network Analysis
Social Network Analysis
Sujoy Bag
 
CS6010 Social Network Analysis Unit II
CS6010 Social Network Analysis   Unit IICS6010 Social Network Analysis   Unit II
CS6010 Social Network Analysis Unit II
pkaviya
 
Social Network Analysis
Social Network AnalysisSocial Network Analysis
Social Network Analysis
Fred Stutzman
 
NE7012- SOCIAL NETWORK ANALYSIS
NE7012- SOCIAL NETWORK ANALYSISNE7012- SOCIAL NETWORK ANALYSIS
NE7012- SOCIAL NETWORK ANALYSIS
rathnaarul
 
Social network analysis part ii
Social network analysis part iiSocial network analysis part ii
Social network analysis part ii
THomas Plotkowiak
 
NE7012- SOCIAL NETWORK ANALYSIS
NE7012- SOCIAL NETWORK ANALYSISNE7012- SOCIAL NETWORK ANALYSIS
NE7012- SOCIAL NETWORK ANALYSIS
rathnaarul
 
Social network analysis course 2010 - 2011
Social network analysis course 2010 - 2011Social network analysis course 2010 - 2011
Social network analysis course 2010 - 2011
guillaume ereteo
 
06 Community Detection
06 Community Detection06 Community Detection
06 Community Detection
Duke Network Analysis Center
 
Data Mining: Graph mining and social network analysis
Data Mining: Graph mining and social network analysisData Mining: Graph mining and social network analysis
Data Mining: Graph mining and social network analysis
DataminingTools Inc
 
Principles of Data Visualization
Principles of Data VisualizationPrinciples of Data Visualization
Principles of Data Visualization
Eamonn Maguire
 
Social Network Analysis: Applications & Challenges
Social Network Analysis: Applications & ChallengesSocial Network Analysis: Applications & Challenges
Social Network Analysis: Applications & Challenges
IIIT Hyderabad
 
NE7012- SOCIAL NETWORK ANALYSIS
NE7012- SOCIAL NETWORK ANALYSISNE7012- SOCIAL NETWORK ANALYSIS
NE7012- SOCIAL NETWORK ANALYSIS
rathnaarul
 

What's hot (20)

Social Network Analysis: What It Is, Why We Should Care, and What We Can Lear...
Social Network Analysis: What It Is, Why We Should Care, and What We Can Lear...Social Network Analysis: What It Is, Why We Should Care, and What We Can Lear...
Social Network Analysis: What It Is, Why We Should Care, and What We Can Lear...
 
Social Media Mining - Chapter 9 (Recommendation in Social Media)
Social Media Mining - Chapter 9 (Recommendation in Social Media)Social Media Mining - Chapter 9 (Recommendation in Social Media)
Social Media Mining - Chapter 9 (Recommendation in Social Media)
 
CS6010 Social Network Analysis Unit IV
CS6010 Social Network Analysis Unit IVCS6010 Social Network Analysis Unit IV
CS6010 Social Network Analysis Unit IV
 
Social network analysis
Social network analysisSocial network analysis
Social network analysis
 
Introduction to Social Network Analysis
Introduction to Social Network AnalysisIntroduction to Social Network Analysis
Introduction to Social Network Analysis
 
Introduction to Social Network Analysis
Introduction to Social Network AnalysisIntroduction to Social Network Analysis
Introduction to Social Network Analysis
 
CS6010 Social Network Analysis Unit I
CS6010 Social Network Analysis Unit ICS6010 Social Network Analysis Unit I
CS6010 Social Network Analysis Unit I
 
09 Ego Network Analysis
09 Ego Network Analysis09 Ego Network Analysis
09 Ego Network Analysis
 
Social Network Analysis
Social Network AnalysisSocial Network Analysis
Social Network Analysis
 
CS6010 Social Network Analysis Unit II
CS6010 Social Network Analysis   Unit IICS6010 Social Network Analysis   Unit II
CS6010 Social Network Analysis Unit II
 
Social Network Analysis
Social Network AnalysisSocial Network Analysis
Social Network Analysis
 
NE7012- SOCIAL NETWORK ANALYSIS
NE7012- SOCIAL NETWORK ANALYSISNE7012- SOCIAL NETWORK ANALYSIS
NE7012- SOCIAL NETWORK ANALYSIS
 
Social network analysis part ii
Social network analysis part iiSocial network analysis part ii
Social network analysis part ii
 
NE7012- SOCIAL NETWORK ANALYSIS
NE7012- SOCIAL NETWORK ANALYSISNE7012- SOCIAL NETWORK ANALYSIS
NE7012- SOCIAL NETWORK ANALYSIS
 
Social network analysis course 2010 - 2011
Social network analysis course 2010 - 2011Social network analysis course 2010 - 2011
Social network analysis course 2010 - 2011
 
06 Community Detection
06 Community Detection06 Community Detection
06 Community Detection
 
Data Mining: Graph mining and social network analysis
Data Mining: Graph mining and social network analysisData Mining: Graph mining and social network analysis
Data Mining: Graph mining and social network analysis
 
Principles of Data Visualization
Principles of Data VisualizationPrinciples of Data Visualization
Principles of Data Visualization
 
Social Network Analysis: Applications & Challenges
Social Network Analysis: Applications & ChallengesSocial Network Analysis: Applications & Challenges
Social Network Analysis: Applications & Challenges
 
NE7012- SOCIAL NETWORK ANALYSIS
NE7012- SOCIAL NETWORK ANALYSISNE7012- SOCIAL NETWORK ANALYSIS
NE7012- SOCIAL NETWORK ANALYSIS
 

Viewers also liked

Network Visualization guest lecture at #DataVizQMSS at @Columbia / #SNA at PU...
Network Visualization guest lecture at #DataVizQMSS at @Columbia / #SNA at PU...Network Visualization guest lecture at #DataVizQMSS at @Columbia / #SNA at PU...
Network Visualization guest lecture at #DataVizQMSS at @Columbia / #SNA at PU...
Denis Parra Santander
 
Visualizing Financial Stress - Talk at European Central Bank
Visualizing Financial Stress - Talk at European Central BankVisualizing Financial Stress - Talk at European Central Bank
Visualizing Financial Stress - Talk at European Central Bank
Kimmo Soramaki
 
Exploratory Social Network Analysis with Pajek: Attributes & Relations
Exploratory Social Network Analysis with Pajek: Attributes & RelationsExploratory Social Network Analysis with Pajek: Attributes & Relations
Exploratory Social Network Analysis with Pajek: Attributes & Relations
Hossein Fani
 
Pajek
PajekPajek
Prezentaciq florian pekazh_42b_355274
Prezentaciq florian pekazh_42b_355274Prezentaciq florian pekazh_42b_355274
Prezentaciq florian pekazh_42b_355274guesta5d2ac
 
Pajek
PajekPajek
Pajek
景逸 王
 
Applications of Network Theory in Finance and Production
Applications of Network Theory in Finance and ProductionApplications of Network Theory in Finance and Production
Applications of Network Theory in Finance and Production
Kimmo Soramaki
 
Exploratory Social Network Analysis with Pajek: Diffusion
Exploratory Social Network Analysis with Pajek: DiffusionExploratory Social Network Analysis with Pajek: Diffusion
Exploratory Social Network Analysis with Pajek: Diffusion
Hossein Fani
 
Exploratory Social Network Analysis with Pajek: Sentiments & Friendship
Exploratory Social Network Analysis with Pajek: Sentiments & FriendshipExploratory Social Network Analysis with Pajek: Sentiments & Friendship
Exploratory Social Network Analysis with Pajek: Sentiments & Friendship
Hossein Fani
 
Introdução ao uso do Pajek
Introdução ao uso do PajekIntrodução ao uso do Pajek
Introdução ao uso do Pajek
Jose Eduardo Santarem Segundo
 
DREaM Event 2: Louise Cooke
DREaM Event 2: Louise CookeDREaM Event 2: Louise Cooke
Visualizing Networks
Visualizing NetworksVisualizing Networks
Visualizing Networks
freshdatabos
 
Finding political network bridges on facebook
Finding political network bridges on facebookFinding political network bridges on facebook
Finding political network bridges on facebook
Nasri Messarra
 
Exploratory Social Network Analysis with Pajek: Blockmodels
Exploratory Social Network Analysis with Pajek: BlockmodelsExploratory Social Network Analysis with Pajek: Blockmodels
Exploratory Social Network Analysis with Pajek: Blockmodels
Hossein Fani
 
WSDM16: Temporal Formation and Evolution of Online Communities
WSDM16: Temporal Formation and Evolution of Online CommunitiesWSDM16: Temporal Formation and Evolution of Online Communities
WSDM16: Temporal Formation and Evolution of Online Communities
Hossein Fani
 
Social Network Analysis, Semantic Web and Learning Networks
Social Network Analysis, Semantic Web and Learning NetworksSocial Network Analysis, Semantic Web and Learning Networks
Social Network Analysis, Semantic Web and Learning Networks
Rory Sie
 
Analyzing social media networks with NodeXL - Chapter-07 Images
Analyzing social media networks with NodeXL - Chapter-07 ImagesAnalyzing social media networks with NodeXL - Chapter-07 Images
Analyzing social media networks with NodeXL - Chapter-07 Images
Marc Smith
 
Overview of Bibliometrics - IAP Course version 1.1
Overview of Bibliometrics - IAP Course version 1.1Overview of Bibliometrics - IAP Course version 1.1
Overview of Bibliometrics - IAP Course version 1.1
Micah Altman
 
Analyzing social media networks with NodeXL - Chapter- 09 Images
Analyzing social media networks with NodeXL - Chapter- 09 ImagesAnalyzing social media networks with NodeXL - Chapter- 09 Images
Analyzing social media networks with NodeXL - Chapter- 09 Images
Marc Smith
 
Analyzing social media networks with NodeXL - Chapter- 05 Images
Analyzing social media networks with NodeXL - Chapter- 05 ImagesAnalyzing social media networks with NodeXL - Chapter- 05 Images
Analyzing social media networks with NodeXL - Chapter- 05 Images
Marc Smith
 

Viewers also liked (20)

Network Visualization guest lecture at #DataVizQMSS at @Columbia / #SNA at PU...
Network Visualization guest lecture at #DataVizQMSS at @Columbia / #SNA at PU...Network Visualization guest lecture at #DataVizQMSS at @Columbia / #SNA at PU...
Network Visualization guest lecture at #DataVizQMSS at @Columbia / #SNA at PU...
 
Visualizing Financial Stress - Talk at European Central Bank
Visualizing Financial Stress - Talk at European Central BankVisualizing Financial Stress - Talk at European Central Bank
Visualizing Financial Stress - Talk at European Central Bank
 
Exploratory Social Network Analysis with Pajek: Attributes & Relations
Exploratory Social Network Analysis with Pajek: Attributes & RelationsExploratory Social Network Analysis with Pajek: Attributes & Relations
Exploratory Social Network Analysis with Pajek: Attributes & Relations
 
Pajek
PajekPajek
Pajek
 
Prezentaciq florian pekazh_42b_355274
Prezentaciq florian pekazh_42b_355274Prezentaciq florian pekazh_42b_355274
Prezentaciq florian pekazh_42b_355274
 
Pajek
PajekPajek
Pajek
 
Applications of Network Theory in Finance and Production
Applications of Network Theory in Finance and ProductionApplications of Network Theory in Finance and Production
Applications of Network Theory in Finance and Production
 
Exploratory Social Network Analysis with Pajek: Diffusion
Exploratory Social Network Analysis with Pajek: DiffusionExploratory Social Network Analysis with Pajek: Diffusion
Exploratory Social Network Analysis with Pajek: Diffusion
 
Exploratory Social Network Analysis with Pajek: Sentiments & Friendship
Exploratory Social Network Analysis with Pajek: Sentiments & FriendshipExploratory Social Network Analysis with Pajek: Sentiments & Friendship
Exploratory Social Network Analysis with Pajek: Sentiments & Friendship
 
Introdução ao uso do Pajek
Introdução ao uso do PajekIntrodução ao uso do Pajek
Introdução ao uso do Pajek
 
DREaM Event 2: Louise Cooke
DREaM Event 2: Louise CookeDREaM Event 2: Louise Cooke
DREaM Event 2: Louise Cooke
 
Visualizing Networks
Visualizing NetworksVisualizing Networks
Visualizing Networks
 
Finding political network bridges on facebook
Finding political network bridges on facebookFinding political network bridges on facebook
Finding political network bridges on facebook
 
Exploratory Social Network Analysis with Pajek: Blockmodels
Exploratory Social Network Analysis with Pajek: BlockmodelsExploratory Social Network Analysis with Pajek: Blockmodels
Exploratory Social Network Analysis with Pajek: Blockmodels
 
WSDM16: Temporal Formation and Evolution of Online Communities
WSDM16: Temporal Formation and Evolution of Online CommunitiesWSDM16: Temporal Formation and Evolution of Online Communities
WSDM16: Temporal Formation and Evolution of Online Communities
 
Social Network Analysis, Semantic Web and Learning Networks
Social Network Analysis, Semantic Web and Learning NetworksSocial Network Analysis, Semantic Web and Learning Networks
Social Network Analysis, Semantic Web and Learning Networks
 
Analyzing social media networks with NodeXL - Chapter-07 Images
Analyzing social media networks with NodeXL - Chapter-07 ImagesAnalyzing social media networks with NodeXL - Chapter-07 Images
Analyzing social media networks with NodeXL - Chapter-07 Images
 
Overview of Bibliometrics - IAP Course version 1.1
Overview of Bibliometrics - IAP Course version 1.1Overview of Bibliometrics - IAP Course version 1.1
Overview of Bibliometrics - IAP Course version 1.1
 
Analyzing social media networks with NodeXL - Chapter- 09 Images
Analyzing social media networks with NodeXL - Chapter- 09 ImagesAnalyzing social media networks with NodeXL - Chapter- 09 Images
Analyzing social media networks with NodeXL - Chapter- 09 Images
 
Analyzing social media networks with NodeXL - Chapter- 05 Images
Analyzing social media networks with NodeXL - Chapter- 05 ImagesAnalyzing social media networks with NodeXL - Chapter- 05 Images
Analyzing social media networks with NodeXL - Chapter- 05 Images
 

Similar to Social Network Visualization 101

Information Networks and Semantics
Information Networks and SemanticsInformation Networks and Semantics
Information Networks and Semantics
Srinath Srinivasa
 
ALIAOnline Practical Linked (Open) Data for Libraries, Archives & Museums
ALIAOnline Practical Linked (Open) Data for Libraries, Archives & MuseumsALIAOnline Practical Linked (Open) Data for Libraries, Archives & Museums
ALIAOnline Practical Linked (Open) Data for Libraries, Archives & Museums
Jon Voss
 
20111103 con tech2011-marc smith
20111103 con tech2011-marc smith20111103 con tech2011-marc smith
20111103 con tech2011-marc smith
Marc Smith
 
Social Network Analysis & an Introduction to Tools
Social Network Analysis & an Introduction to ToolsSocial Network Analysis & an Introduction to Tools
Social Network Analysis & an Introduction to Tools
Patti Anklam
 
LSS'11: Charting Collections Of Connections In Social Media
LSS'11: Charting Collections Of Connections In Social MediaLSS'11: Charting Collections Of Connections In Social Media
LSS'11: Charting Collections Of Connections In Social Media
Local Social Summit
 
Sylva workshop.gt that camp.2012
Sylva workshop.gt that camp.2012Sylva workshop.gt that camp.2012
Sylva workshop.gt that camp.2012
CameliaN
 
Tutorial on Relationship Mining In Online Social Networks
Tutorial on Relationship Mining In Online Social NetworksTutorial on Relationship Mining In Online Social Networks
Tutorial on Relationship Mining In Online Social Networks
pjing2
 
Social Networks and Computer Science
Social Networks and Computer ScienceSocial Networks and Computer Science
Social Networks and Computer Science
dragonmeteor
 
Scits 2014
Scits 2014Scits 2014
Scits 2014
Kevin Lanning
 
December 2, 2015: NISO/NFAIS Virtual Conference: Semantic Web: What's New and...
December 2, 2015: NISO/NFAIS Virtual Conference: Semantic Web: What's New and...December 2, 2015: NISO/NFAIS Virtual Conference: Semantic Web: What's New and...
December 2, 2015: NISO/NFAIS Virtual Conference: Semantic Web: What's New and...
DeVonne Parks, CEM
 
20120301 strata-marc smith-mapping social media networks with no coding using...
20120301 strata-marc smith-mapping social media networks with no coding using...20120301 strata-marc smith-mapping social media networks with no coding using...
20120301 strata-marc smith-mapping social media networks with no coding using...
Marc Smith
 
Slides | Research data literacy and the library
Slides | Research data literacy and the librarySlides | Research data literacy and the library
Slides | Research data literacy and the library
Colleen DeLory
 
Slides | Research data literacy and the library
Slides | Research data literacy and the librarySlides | Research data literacy and the library
Slides | Research data literacy and the library
Library_Connect
 
Finding Knowledge: Assessing Knowledge in the Age of Search
Finding Knowledge: Assessing Knowledge in the Age of SearchFinding Knowledge: Assessing Knowledge in the Age of Search
Finding Knowledge: Assessing Knowledge in the Age of Search
Simon Knight
 
Linked Open Data in Libraries, Archives & Museums
Linked Open Data in Libraries, Archives & MuseumsLinked Open Data in Libraries, Archives & Museums
Linked Open Data in Libraries, Archives & Museums
Jon Voss
 
NISO Webinar: Library Linked Data: From Vision to Reality
NISO Webinar: Library Linked Data: From Vision to RealityNISO Webinar: Library Linked Data: From Vision to Reality
NISO Webinar: Library Linked Data: From Vision to Reality
National Information Standards Organization (NISO)
 
Ux and Data Visualisation
Ux and Data VisualisationUx and Data Visualisation
Ux and Data Visualisation
City Unrulyversity
 
Kohacon2016
Kohacon2016Kohacon2016
Kohacon2016
Joy Nelson
 
Intro to Linked Open Data in Libraries Archives & Museums.
Intro to Linked Open Data in Libraries Archives & Museums.Intro to Linked Open Data in Libraries Archives & Museums.
Intro to Linked Open Data in Libraries Archives & Museums.
Jon Voss
 
Reference Rot and Linked Data: Threat and Remedy
Reference Rot and Linked Data: Threat and RemedyReference Rot and Linked Data: Threat and Remedy
Reference Rot and Linked Data: Threat and Remedy
EDINA, University of Edinburgh
 

Similar to Social Network Visualization 101 (20)

Information Networks and Semantics
Information Networks and SemanticsInformation Networks and Semantics
Information Networks and Semantics
 
ALIAOnline Practical Linked (Open) Data for Libraries, Archives & Museums
ALIAOnline Practical Linked (Open) Data for Libraries, Archives & MuseumsALIAOnline Practical Linked (Open) Data for Libraries, Archives & Museums
ALIAOnline Practical Linked (Open) Data for Libraries, Archives & Museums
 
20111103 con tech2011-marc smith
20111103 con tech2011-marc smith20111103 con tech2011-marc smith
20111103 con tech2011-marc smith
 
Social Network Analysis & an Introduction to Tools
Social Network Analysis & an Introduction to ToolsSocial Network Analysis & an Introduction to Tools
Social Network Analysis & an Introduction to Tools
 
LSS'11: Charting Collections Of Connections In Social Media
LSS'11: Charting Collections Of Connections In Social MediaLSS'11: Charting Collections Of Connections In Social Media
LSS'11: Charting Collections Of Connections In Social Media
 
Sylva workshop.gt that camp.2012
Sylva workshop.gt that camp.2012Sylva workshop.gt that camp.2012
Sylva workshop.gt that camp.2012
 
Tutorial on Relationship Mining In Online Social Networks
Tutorial on Relationship Mining In Online Social NetworksTutorial on Relationship Mining In Online Social Networks
Tutorial on Relationship Mining In Online Social Networks
 
Social Networks and Computer Science
Social Networks and Computer ScienceSocial Networks and Computer Science
Social Networks and Computer Science
 
Scits 2014
Scits 2014Scits 2014
Scits 2014
 
December 2, 2015: NISO/NFAIS Virtual Conference: Semantic Web: What's New and...
December 2, 2015: NISO/NFAIS Virtual Conference: Semantic Web: What's New and...December 2, 2015: NISO/NFAIS Virtual Conference: Semantic Web: What's New and...
December 2, 2015: NISO/NFAIS Virtual Conference: Semantic Web: What's New and...
 
20120301 strata-marc smith-mapping social media networks with no coding using...
20120301 strata-marc smith-mapping social media networks with no coding using...20120301 strata-marc smith-mapping social media networks with no coding using...
20120301 strata-marc smith-mapping social media networks with no coding using...
 
Slides | Research data literacy and the library
Slides | Research data literacy and the librarySlides | Research data literacy and the library
Slides | Research data literacy and the library
 
Slides | Research data literacy and the library
Slides | Research data literacy and the librarySlides | Research data literacy and the library
Slides | Research data literacy and the library
 
Finding Knowledge: Assessing Knowledge in the Age of Search
Finding Knowledge: Assessing Knowledge in the Age of SearchFinding Knowledge: Assessing Knowledge in the Age of Search
Finding Knowledge: Assessing Knowledge in the Age of Search
 
Linked Open Data in Libraries, Archives & Museums
Linked Open Data in Libraries, Archives & MuseumsLinked Open Data in Libraries, Archives & Museums
Linked Open Data in Libraries, Archives & Museums
 
NISO Webinar: Library Linked Data: From Vision to Reality
NISO Webinar: Library Linked Data: From Vision to RealityNISO Webinar: Library Linked Data: From Vision to Reality
NISO Webinar: Library Linked Data: From Vision to Reality
 
Ux and Data Visualisation
Ux and Data VisualisationUx and Data Visualisation
Ux and Data Visualisation
 
Kohacon2016
Kohacon2016Kohacon2016
Kohacon2016
 
Intro to Linked Open Data in Libraries Archives & Museums.
Intro to Linked Open Data in Libraries Archives & Museums.Intro to Linked Open Data in Libraries Archives & Museums.
Intro to Linked Open Data in Libraries Archives & Museums.
 
Reference Rot and Linked Data: Threat and Remedy
Reference Rot and Linked Data: Threat and RemedyReference Rot and Linked Data: Threat and Remedy
Reference Rot and Linked Data: Threat and Remedy
 

More from librarianrafia

Know your author's rights
Know your author's rightsKnow your author's rights
Know your author's rights
librarianrafia
 
Publishing in the digital humanities
Publishing in the digital humanitiesPublishing in the digital humanities
Publishing in the digital humanities
librarianrafia
 
Data for the Humanities
Data for the HumanitiesData for the Humanities
Data for the Humanities
librarianrafia
 
Introduction to WordPress (blogging)
Introduction to WordPress (blogging)Introduction to WordPress (blogging)
Introduction to WordPress (blogging)
librarianrafia
 
Digital project planning and pedagogy
Digital project planning and pedagogyDigital project planning and pedagogy
Digital project planning and pedagogy
librarianrafia
 
Introduction To Wordpress
Introduction  To Wordpress Introduction  To Wordpress
Introduction To Wordpress
librarianrafia
 
Digital Frontiers 2016: Memorandums of Understanding Workshop
Digital Frontiers 2016: Memorandums of Understanding Workshop  Digital Frontiers 2016: Memorandums of Understanding Workshop
Digital Frontiers 2016: Memorandums of Understanding Workshop
librarianrafia
 
Introduction to digital scholarship tools
Introduction to digital scholarship toolsIntroduction to digital scholarship tools
Introduction to digital scholarship tools
librarianrafia
 
Create a (free) Wordpress Site
Create a (free) Wordpress SiteCreate a (free) Wordpress Site
Create a (free) Wordpress Site
librarianrafia
 
Your Digital Identity: Social Media & Online Presence
Your Digital Identity: Social Media & Online PresenceYour Digital Identity: Social Media & Online Presence
Your Digital Identity: Social Media & Online Presence
librarianrafia
 
Digitization for accessibility
Digitization for accessibilityDigitization for accessibility
Digitization for accessibility
librarianrafia
 
CTLC Annual 2016 slides
CTLC Annual 2016 slides CTLC Annual 2016 slides
CTLC Annual 2016 slides
librarianrafia
 
Digital Projects Outreach: A Challenge to Traditional Library Liaison Services
Digital Projects Outreach: A Challenge to Traditional Library Liaison Services Digital Projects Outreach: A Challenge to Traditional Library Liaison Services
Digital Projects Outreach: A Challenge to Traditional Library Liaison Services
librarianrafia
 
Memorandum of Understanding Workshop: Creating a Process for Successful Digit...
Memorandum of Understanding Workshop: Creating a Process for Successful Digit...Memorandum of Understanding Workshop: Creating a Process for Successful Digit...
Memorandum of Understanding Workshop: Creating a Process for Successful Digit...
librarianrafia
 
Digital humanities and libraries
Digital humanities and libraries Digital humanities and libraries
Digital humanities and libraries
librarianrafia
 
Introduction to databases and metadata
Introduction to databases and metadataIntroduction to databases and metadata
Introduction to databases and metadata
librarianrafia
 
Introduction To Searching The Web
Introduction To Searching The WebIntroduction To Searching The Web
Introduction To Searching The Web
librarianrafia
 
Digital Humanities for Historians: An introduction
Digital Humanities for Historians: An introductionDigital Humanities for Historians: An introduction
Digital Humanities for Historians: An introduction
librarianrafia
 
Digital Humanities & UTA libraries
Digital Humanities & UTA libraries  Digital Humanities & UTA libraries
Digital Humanities & UTA libraries
librarianrafia
 
Using Omeka as a Gateway to Digital Projects
Using Omeka as a Gateway to Digital ProjectsUsing Omeka as a Gateway to Digital Projects
Using Omeka as a Gateway to Digital Projects
librarianrafia
 

More from librarianrafia (20)

Know your author's rights
Know your author's rightsKnow your author's rights
Know your author's rights
 
Publishing in the digital humanities
Publishing in the digital humanitiesPublishing in the digital humanities
Publishing in the digital humanities
 
Data for the Humanities
Data for the HumanitiesData for the Humanities
Data for the Humanities
 
Introduction to WordPress (blogging)
Introduction to WordPress (blogging)Introduction to WordPress (blogging)
Introduction to WordPress (blogging)
 
Digital project planning and pedagogy
Digital project planning and pedagogyDigital project planning and pedagogy
Digital project planning and pedagogy
 
Introduction To Wordpress
Introduction  To Wordpress Introduction  To Wordpress
Introduction To Wordpress
 
Digital Frontiers 2016: Memorandums of Understanding Workshop
Digital Frontiers 2016: Memorandums of Understanding Workshop  Digital Frontiers 2016: Memorandums of Understanding Workshop
Digital Frontiers 2016: Memorandums of Understanding Workshop
 
Introduction to digital scholarship tools
Introduction to digital scholarship toolsIntroduction to digital scholarship tools
Introduction to digital scholarship tools
 
Create a (free) Wordpress Site
Create a (free) Wordpress SiteCreate a (free) Wordpress Site
Create a (free) Wordpress Site
 
Your Digital Identity: Social Media & Online Presence
Your Digital Identity: Social Media & Online PresenceYour Digital Identity: Social Media & Online Presence
Your Digital Identity: Social Media & Online Presence
 
Digitization for accessibility
Digitization for accessibilityDigitization for accessibility
Digitization for accessibility
 
CTLC Annual 2016 slides
CTLC Annual 2016 slides CTLC Annual 2016 slides
CTLC Annual 2016 slides
 
Digital Projects Outreach: A Challenge to Traditional Library Liaison Services
Digital Projects Outreach: A Challenge to Traditional Library Liaison Services Digital Projects Outreach: A Challenge to Traditional Library Liaison Services
Digital Projects Outreach: A Challenge to Traditional Library Liaison Services
 
Memorandum of Understanding Workshop: Creating a Process for Successful Digit...
Memorandum of Understanding Workshop: Creating a Process for Successful Digit...Memorandum of Understanding Workshop: Creating a Process for Successful Digit...
Memorandum of Understanding Workshop: Creating a Process for Successful Digit...
 
Digital humanities and libraries
Digital humanities and libraries Digital humanities and libraries
Digital humanities and libraries
 
Introduction to databases and metadata
Introduction to databases and metadataIntroduction to databases and metadata
Introduction to databases and metadata
 
Introduction To Searching The Web
Introduction To Searching The WebIntroduction To Searching The Web
Introduction To Searching The Web
 
Digital Humanities for Historians: An introduction
Digital Humanities for Historians: An introductionDigital Humanities for Historians: An introduction
Digital Humanities for Historians: An introduction
 
Digital Humanities & UTA libraries
Digital Humanities & UTA libraries  Digital Humanities & UTA libraries
Digital Humanities & UTA libraries
 
Using Omeka as a Gateway to Digital Projects
Using Omeka as a Gateway to Digital ProjectsUsing Omeka as a Gateway to Digital Projects
Using Omeka as a Gateway to Digital Projects
 

Recently uploaded

THE SACRIFICE HOW PRO-PALESTINE PROTESTS STUDENTS ARE SACRIFICING TO CHANGE T...
THE SACRIFICE HOW PRO-PALESTINE PROTESTS STUDENTS ARE SACRIFICING TO CHANGE T...THE SACRIFICE HOW PRO-PALESTINE PROTESTS STUDENTS ARE SACRIFICING TO CHANGE T...
THE SACRIFICE HOW PRO-PALESTINE PROTESTS STUDENTS ARE SACRIFICING TO CHANGE T...
indexPub
 
How to Manage Reception Report in Odoo 17
How to Manage Reception Report in Odoo 17How to Manage Reception Report in Odoo 17
How to Manage Reception Report in Odoo 17
Celine George
 
Pharmaceutics Pharmaceuticals best of brub
Pharmaceutics Pharmaceuticals best of brubPharmaceutics Pharmaceuticals best of brub
Pharmaceutics Pharmaceuticals best of brub
danielkiash986
 
skeleton System.pdf (skeleton system wow)
skeleton System.pdf (skeleton system wow)skeleton System.pdf (skeleton system wow)
skeleton System.pdf (skeleton system wow)
Mohammad Al-Dhahabi
 
Temple of Asclepius in Thrace. Excavation results
Temple of Asclepius in Thrace. Excavation resultsTemple of Asclepius in Thrace. Excavation results
Temple of Asclepius in Thrace. Excavation results
Krassimira Luka
 
Bossa N’ Roll Records by Ismael Vazquez.
Bossa N’ Roll Records by Ismael Vazquez.Bossa N’ Roll Records by Ismael Vazquez.
Bossa N’ Roll Records by Ismael Vazquez.
IsmaelVazquez38
 
Geography as a Discipline Chapter 1 __ Class 11 Geography NCERT _ Class Notes...
Geography as a Discipline Chapter 1 __ Class 11 Geography NCERT _ Class Notes...Geography as a Discipline Chapter 1 __ Class 11 Geography NCERT _ Class Notes...
Geography as a Discipline Chapter 1 __ Class 11 Geography NCERT _ Class Notes...
ImMuslim
 
Wound healing PPT
Wound healing PPTWound healing PPT
Wound healing PPT
Jyoti Chand
 
Présentationvvvvvvvvvvvvvvvvvvvvvvvvvvvv2.pptx
Présentationvvvvvvvvvvvvvvvvvvvvvvvvvvvv2.pptxPrésentationvvvvvvvvvvvvvvvvvvvvvvvvvvvv2.pptx
Présentationvvvvvvvvvvvvvvvvvvvvvvvvvvvv2.pptx
siemaillard
 
Juneteenth Freedom Day 2024 David Douglas School District
Juneteenth Freedom Day 2024 David Douglas School DistrictJuneteenth Freedom Day 2024 David Douglas School District
Juneteenth Freedom Day 2024 David Douglas School District
David Douglas School District
 
Gender and Mental Health - Counselling and Family Therapy Applications and In...
Gender and Mental Health - Counselling and Family Therapy Applications and In...Gender and Mental Health - Counselling and Family Therapy Applications and In...
Gender and Mental Health - Counselling and Family Therapy Applications and In...
PsychoTech Services
 
Andreas Schleicher presents PISA 2022 Volume III - Creative Thinking - 18 Jun...
Andreas Schleicher presents PISA 2022 Volume III - Creative Thinking - 18 Jun...Andreas Schleicher presents PISA 2022 Volume III - Creative Thinking - 18 Jun...
Andreas Schleicher presents PISA 2022 Volume III - Creative Thinking - 18 Jun...
EduSkills OECD
 
Electric Fetus - Record Store Scavenger Hunt
Electric Fetus - Record Store Scavenger HuntElectric Fetus - Record Store Scavenger Hunt
Electric Fetus - Record Store Scavenger Hunt
RamseyBerglund
 
Data Structure using C by Dr. K Adisesha .ppsx
Data Structure using C by Dr. K Adisesha .ppsxData Structure using C by Dr. K Adisesha .ppsx
Data Structure using C by Dr. K Adisesha .ppsx
Prof. Dr. K. Adisesha
 
REASIGNACION 2024 UGEL CHUPACA 2024 UGEL CHUPACA.pdf
REASIGNACION 2024 UGEL CHUPACA 2024 UGEL CHUPACA.pdfREASIGNACION 2024 UGEL CHUPACA 2024 UGEL CHUPACA.pdf
REASIGNACION 2024 UGEL CHUPACA 2024 UGEL CHUPACA.pdf
giancarloi8888
 
Benner "Expanding Pathways to Publishing Careers"
Benner "Expanding Pathways to Publishing Careers"Benner "Expanding Pathways to Publishing Careers"
Benner "Expanding Pathways to Publishing Careers"
National Information Standards Organization (NISO)
 
Accounting for Restricted Grants When and How To Record Properly
Accounting for Restricted Grants  When and How To Record ProperlyAccounting for Restricted Grants  When and How To Record Properly
Accounting for Restricted Grants When and How To Record Properly
TechSoup
 
Leveraging Generative AI to Drive Nonprofit Innovation
Leveraging Generative AI to Drive Nonprofit InnovationLeveraging Generative AI to Drive Nonprofit Innovation
Leveraging Generative AI to Drive Nonprofit Innovation
TechSoup
 
BÀI TẬP BỔ TRỢ TIẾNG ANH LỚP 8 - CẢ NĂM - FRIENDS PLUS - NĂM HỌC 2023-2024 (B...
BÀI TẬP BỔ TRỢ TIẾNG ANH LỚP 8 - CẢ NĂM - FRIENDS PLUS - NĂM HỌC 2023-2024 (B...BÀI TẬP BỔ TRỢ TIẾNG ANH LỚP 8 - CẢ NĂM - FRIENDS PLUS - NĂM HỌC 2023-2024 (B...
BÀI TẬP BỔ TRỢ TIẾNG ANH LỚP 8 - CẢ NĂM - FRIENDS PLUS - NĂM HỌC 2023-2024 (B...
Nguyen Thanh Tu Collection
 
Haunted Houses by H W Longfellow for class 10
Haunted Houses by H W Longfellow for class 10Haunted Houses by H W Longfellow for class 10
Haunted Houses by H W Longfellow for class 10
nitinpv4ai
 

Recently uploaded (20)

THE SACRIFICE HOW PRO-PALESTINE PROTESTS STUDENTS ARE SACRIFICING TO CHANGE T...
THE SACRIFICE HOW PRO-PALESTINE PROTESTS STUDENTS ARE SACRIFICING TO CHANGE T...THE SACRIFICE HOW PRO-PALESTINE PROTESTS STUDENTS ARE SACRIFICING TO CHANGE T...
THE SACRIFICE HOW PRO-PALESTINE PROTESTS STUDENTS ARE SACRIFICING TO CHANGE T...
 
How to Manage Reception Report in Odoo 17
How to Manage Reception Report in Odoo 17How to Manage Reception Report in Odoo 17
How to Manage Reception Report in Odoo 17
 
Pharmaceutics Pharmaceuticals best of brub
Pharmaceutics Pharmaceuticals best of brubPharmaceutics Pharmaceuticals best of brub
Pharmaceutics Pharmaceuticals best of brub
 
skeleton System.pdf (skeleton system wow)
skeleton System.pdf (skeleton system wow)skeleton System.pdf (skeleton system wow)
skeleton System.pdf (skeleton system wow)
 
Temple of Asclepius in Thrace. Excavation results
Temple of Asclepius in Thrace. Excavation resultsTemple of Asclepius in Thrace. Excavation results
Temple of Asclepius in Thrace. Excavation results
 
Bossa N’ Roll Records by Ismael Vazquez.
Bossa N’ Roll Records by Ismael Vazquez.Bossa N’ Roll Records by Ismael Vazquez.
Bossa N’ Roll Records by Ismael Vazquez.
 
Geography as a Discipline Chapter 1 __ Class 11 Geography NCERT _ Class Notes...
Geography as a Discipline Chapter 1 __ Class 11 Geography NCERT _ Class Notes...Geography as a Discipline Chapter 1 __ Class 11 Geography NCERT _ Class Notes...
Geography as a Discipline Chapter 1 __ Class 11 Geography NCERT _ Class Notes...
 
Wound healing PPT
Wound healing PPTWound healing PPT
Wound healing PPT
 
Présentationvvvvvvvvvvvvvvvvvvvvvvvvvvvv2.pptx
Présentationvvvvvvvvvvvvvvvvvvvvvvvvvvvv2.pptxPrésentationvvvvvvvvvvvvvvvvvvvvvvvvvvvv2.pptx
Présentationvvvvvvvvvvvvvvvvvvvvvvvvvvvv2.pptx
 
Juneteenth Freedom Day 2024 David Douglas School District
Juneteenth Freedom Day 2024 David Douglas School DistrictJuneteenth Freedom Day 2024 David Douglas School District
Juneteenth Freedom Day 2024 David Douglas School District
 
Gender and Mental Health - Counselling and Family Therapy Applications and In...
Gender and Mental Health - Counselling and Family Therapy Applications and In...Gender and Mental Health - Counselling and Family Therapy Applications and In...
Gender and Mental Health - Counselling and Family Therapy Applications and In...
 
Andreas Schleicher presents PISA 2022 Volume III - Creative Thinking - 18 Jun...
Andreas Schleicher presents PISA 2022 Volume III - Creative Thinking - 18 Jun...Andreas Schleicher presents PISA 2022 Volume III - Creative Thinking - 18 Jun...
Andreas Schleicher presents PISA 2022 Volume III - Creative Thinking - 18 Jun...
 
Electric Fetus - Record Store Scavenger Hunt
Electric Fetus - Record Store Scavenger HuntElectric Fetus - Record Store Scavenger Hunt
Electric Fetus - Record Store Scavenger Hunt
 
Data Structure using C by Dr. K Adisesha .ppsx
Data Structure using C by Dr. K Adisesha .ppsxData Structure using C by Dr. K Adisesha .ppsx
Data Structure using C by Dr. K Adisesha .ppsx
 
REASIGNACION 2024 UGEL CHUPACA 2024 UGEL CHUPACA.pdf
REASIGNACION 2024 UGEL CHUPACA 2024 UGEL CHUPACA.pdfREASIGNACION 2024 UGEL CHUPACA 2024 UGEL CHUPACA.pdf
REASIGNACION 2024 UGEL CHUPACA 2024 UGEL CHUPACA.pdf
 
Benner "Expanding Pathways to Publishing Careers"
Benner "Expanding Pathways to Publishing Careers"Benner "Expanding Pathways to Publishing Careers"
Benner "Expanding Pathways to Publishing Careers"
 
Accounting for Restricted Grants When and How To Record Properly
Accounting for Restricted Grants  When and How To Record ProperlyAccounting for Restricted Grants  When and How To Record Properly
Accounting for Restricted Grants When and How To Record Properly
 
Leveraging Generative AI to Drive Nonprofit Innovation
Leveraging Generative AI to Drive Nonprofit InnovationLeveraging Generative AI to Drive Nonprofit Innovation
Leveraging Generative AI to Drive Nonprofit Innovation
 
BÀI TẬP BỔ TRỢ TIẾNG ANH LỚP 8 - CẢ NĂM - FRIENDS PLUS - NĂM HỌC 2023-2024 (B...
BÀI TẬP BỔ TRỢ TIẾNG ANH LỚP 8 - CẢ NĂM - FRIENDS PLUS - NĂM HỌC 2023-2024 (B...BÀI TẬP BỔ TRỢ TIẾNG ANH LỚP 8 - CẢ NĂM - FRIENDS PLUS - NĂM HỌC 2023-2024 (B...
BÀI TẬP BỔ TRỢ TIẾNG ANH LỚP 8 - CẢ NĂM - FRIENDS PLUS - NĂM HỌC 2023-2024 (B...
 
Haunted Houses by H W Longfellow for class 10
Haunted Houses by H W Longfellow for class 10Haunted Houses by H W Longfellow for class 10
Haunted Houses by H W Longfellow for class 10
 

Social Network Visualization 101

  • 2. Contact Information Rafia Mirza | Digital Humanities Librarian @LibrarianRafia | rafia@uta.edu Peace Ossom Williamson | Director for Research Data Services @123POW | peace@uta.edu
  • 3. How to viz 1. Determine what to say 2. Find/collect the data you need 3. Wrangle! 4. Clean! (Repeat 3 & 4 many more times) 5. Come to a final product/conclusion
  • 5. Data Visualization The graphical display of abstract information for two purposes: • sense-making • communication https://www.interaction-design.org/literature/book/the-encyclopedia-of-human-computer-interaction-2nd-ed/data- visualization-for-human-perception Others 52% Heather 1% Lydia 6% Peace 13% Kaeli 28% Answering Nursing Questions Most nursing questions are not reaching the nursing team, as we are answering fewer than 50% recorded. 0 20 40 60 80 100 120 12 am 1 2 3 4 5 6 7 8 9 10 11 12 pm 1 2 3 4 5 6 7 8 9 10 11 pm Hourly Question Frequency Chat Questions Total Questions
  • 6. Data Visualization The graphical display of abstract information for two purposes: • sense-making • communication 5 11 36 58 61 102 202 409 0 100 200 300 400 500 In-Person Ask a Librarian Blank Phone Appointment Drop-In Email Chat Number of questions per semester How Nursing Questions are Received Chat is the primary method, followed by emails. Together, they make up 70% of incoming nursing questions. https://www.interaction-design.org/literature/book/the-encyclopedia-of-human-computer-interaction-2nd-ed/data- visualization-for-human-perception
  • 7. Data Visualization The graphical display of abstract information for two purposes: • sense-making • communication https://www.interaction-design.org/literature/book/the-encyclopedia-of-human-computer-interaction-2nd-ed/data- visualization-for-human-perception Potential Actions: • Put nursing librarians on chat • Inform staff on chat how to answer common questions • Make contact methods clear to nursing students • Be available during hours questions are most often asked
  • 9. Network Visualization http://www.markowetzlab.org/pics/dyNet_fig2.jpg Data visualization involving the visual display of networks via nodes and edges. node edge
  • 12.
  • 13.
  • 14. Types of Network Visualizations • Bibliographic networks (co- authoring, citation network) • Social networks • Biological networks • Political relationships • Sports (passing, setting up plays) • Power distributions
  • 15. What is SNA? How does it relate to the discipline of History?
  • 16.
  • 17. Social network analysis (SNA) • “Social network analysis (SNA) is the process of investigating social structures through the use of network and graph theories. It characterizes networked structures in terms of nodes (individual actors, people, or things within the network) and the ties, edges, or links (relationships or interactions) that connect them.” • via Wikipedia • History of Network Analysis (link to ppt)
  • 18. Social network analysis in History • Networks in Historical Research • “The use of formal network methods for historical research is much more recent, with only a few exceptions dating back beyond thirty years.” • Historical Network Research: Network analysis in the historical disciplines • “Among historians, the term network has been used in a metaphorical sense alone for a long time. It was only recently that this has changed.”
  • 19. Social network analysis in History • Visualizing Historical Networks Website • “Kindred Britain is a network of nearly 30,000 individuals — many of them iconic figures in British culture — connected through family relationships of blood, marriage, or affiliation. It is a vision of the nation’s history as a giant family affair.”
  • 20. International Review of Social History
  • 21. What types of networks are there?
  • 22. Types of Networks Examples • Undirected • Directed • Weighted
  • 23. Types of Networks Examples • Undirected • Directed • Weighted
  • 24. Types of Networks Examples • Undirected • Directed • Weighted
  • 26. How do you structure your data to do network viz?
  • 27. Setting Up the File Node 1 Node 2 Peace Rafia Peace David Rafia Peace Peace Rafia David
  • 28. Setting Up the File Source Destination Weight B A 1 B E 1 C A 1 C E 1 C D 1 A B C D E
  • 29. Setting Up the File A B C D E A 0 0 0 0 0 B 1 0 0 0 1 C 1 0 0 1 1 D 0 0 0 0 0 E 0 0 0 0 0 A B C D E
  • 30. Setting Up the File Source Destinations B A E C A D E A B C D E
  • 31. Setting Up the File NodeID Attr1 Attr2 A yellow 1 B green 3 C orange 5 D yellow 3 E blue 1 A B C D E
  • 32. Attractiveness Ensure the following: • Related nodes are close • Groups of related nodes are clustered together • Sufficient empty space between nodes, minimal overlapping http://www.markowetzlab.org/pics/dyNet_fig2.jpg
  • 35. 2012
  • 36. Star Wars social networks: The Force Awakens Evelina Gabasova
  • 37. Quality function to be minimized: • xi – location of node i • aij – weight of edge between notes i and j • α and β – attraction and repulsion parameters Statistics
  • 38. β = -7 β = -6 β = -5 β = -4 β = -3
  • 42. A Co-Citation Network for Philosophy Kieran Healy
  • 43. Applications Fun • Truthy & Hoaxy • Moviegalaxies • LinkedIn InMaps Socilab
  • 44. Applications Creating • Gephi • Cytoscape • NodeXL • Sci2 • igraph FILE TYPE Edge List/ Matrix XML Edge Weight Attributes Viz Attributes Hierarchal Graphs CSV DL Ucinet DOT Graphviz GDF GEXF GML GraphML NET Pajek
  • 45. Gephi: The Open Graph Viz Platform Gephi is the leading visualization and exploration software for all kinds of graphs and networks. Gephi is open-source and free.
  • 46. Introduction to Network Analysis Thomas Padilla & Brandon Locke
  • 47. Examples • Sample data sets • snap.stanford.edu/data • www- personal.umich.edu/~mejn/ netdata • wiki.gephi.org/index.php/da tasets Visual complexity

Editor's Notes

  1. Learning Outcomes Understand the basic use of visualizations in network analysis What is Data Viz? Network Viz? SNA What types of Networks are there? How do you structure your data to do a viz? Recognize visualization file setup and structure What applications can you use? Distinguish systems or programs that create network visualizations What applications can you use? What are some tools/programs you can use?
  2. Data visualization is the graphical display of abstract information for two purposes: sense-making (also called data analysis) and communication. Important stories live in our data and data visualization is a powerful means to discover and understand these stories, and then to present them to others. Image: 1st one: Area chart: showing how many questions received each hour of the day 2nd one: pie chart: what % of questions coming form nursing dept., who is answering Sense making, data that otherwise you could not see patterns in if you had not visualized
  3. Communication: now communicating for purpose, marketing, argument, etc. Bar charts: shows most ? Coming in chat or email, could use to make argument need to increase staff on those
  4. Can also do both. What is your end goal? What is your thesis? If no purpose then not very useful. The information is abstract in that it describes things that are not physical. Statistical information is abstract. Whether it concerns sales, incidences of disease, athletic performance, or anything else, even though it doesn't pertain to the physical world, we can still display it visually, but to do this we must find a way to give form to that which has none. This translation of the abstract into physical attributes of vision (length, position, size, shape, and color, to name a few) can only succeed if we understand a bit about visual perception and cognition. In other words, to visualize data effectively, we must follow design principles that are derived from an understanding of human perception.
  5. So, what is a network? A network is any collection of objects in which some pairs of these objects are connected by links/edges (Easley & Kleinberg, 2011). Networks are critical to modern society, and a thorough understanding of how they behave is crucial to their efficient operation. Fortunately, data on networks is plentiful; by visualizing this data, it is possible to greatly improve our understanding. Our focus is on visualizing the data associated with a network and not on simply visualizing the structure of the network itself.
  6. In this visualization, the focus is on specifying relationships among a collection of items. A network consists of nodes, edges, and possibly spatial information. Statistics are associated with the nodes and the edges. Nodes (or objects) are connected by links (or edges). The edge statistics may be directed, or pointed, or undirected. The network may have a natural spatial layout as does a geographical trade-flow network, or may be abstract as in a personal communications network. Network data may categorical, such as the type of node or edge, or quantitative such as a edge’s capacity. The data may be static, such as a network’s capacity, or time varying, such as the network flow in several time periods.
  7. Modern network visualization goes back to Jacob L. Moreno’s “Sociograms” of the 1930s. He standardized the usage of circles and lines to represent agents and their relations (1932). He introduced shapes to mark different groups of nodes and used arrow heads to show directionality of connections (1934). Decades before computer programs were available, Moreno positioned the nodes to reveal social structure (1934). In subsequent years, important nodes were arranged centrally in radial layouts (Lundberg and Steele, 1939) or were drawn with larger circles (Loomis, 1946). Contextual information played an ever greater role in network visualizations—Roethlisberger and Dickson (1939) positioned nodes based on their physical location; Davis, Gardner, and Gardner (1941) used socio-economic variables to position the nodes; and Sampson (1968) mapped positive and negative sentiment towards agents to node positions. However, some remarkable network visualizations had already been published as early as the late nineteenth century. These visualizations include Alexander Macfarlane’s visual representation of British marriage prohibitions (1883) and John Hobson’s approach of visualizing two-mode data by showing the overlap of directors among South African companies (1894). For this poster presentation, we have re-created the above mentioned visualizations as well as other historic network figures. All of them represent milestones in the development of network visualizations that guide contemporary network visualizations through today.
  8. Bernfeld – circle of girl friends. Four figures show different relations. Line thickness represents intensity. Moreno – class structure, 5th grade. Girls (circles) and boys (triangles). Links show two best friends. Top line represents group border
  9. Roethlisberger – observed friendship ties and cliques in a factory. Position reflects the location of their workspace. Davis – a group of women in Old City, 1936. Women participating at social events. Rows and columns were rearranged to show groups.
  10. Many kinds of network viz, but what is you lens/methadology/purpose
  11. In the 1960s, Eugene Garfield created the “historiograph”, a technique to visualize the history of scientific fields using a network of citations or historical narratives laid out temporally from top to bottom.1 Garfield developed a method of creating historiographs algorithmically, and his contemporaries hoped the diagram would eventually be used frequently by historians. The idea was that historians could use these visuals to quickly get a grasp of the history of a discipline’s research trajectories, either for research purposes or as a quick summary in a publication.
  12. Undirected: no direction, mutual, so no arrows Facebook friends Who lived in same era
  13. Twitter is directed (not mutual), has arrows, Twitter you can follow , but they don’t follow back, Hierarchical relations, , leaders such as kings, queens, generals, etc. Communication (letters, epistles, etc)
  14. Weighted when you weigh size of edge by intensity. So example, Facebook likes, maybe you like everything someone posts, (thick line) but they only like a 1/3 of what you post (thinner line)
  15. Adjacency: Facebook, twitter, how one node connects to another Affiliation: two/multiple nodes , how one type of node is connected to another type of node (could show people and party affiliation)
  16. You are going to need to figure out what tool you are using, so you are going to set up file in a way that the tool can read. Here are some examples of what that will look like
  17. One type of file set up Example: 1st column, originator node, to destination node Peace is listed in two rows, because point to different names Example: who writes each other letters ?
  18. One type of file set up Similar file set up to previous, but weight added Has different headers Headers dictated by what you want to show and how program you are using want file structured
  19. One type of file set up Column names will be reflected in viz, do you want to name column a A or Alison? Example: All potential recipient listed across top All potential originators listed across left
  20. For this file type all destination need to be on same line
  21. For this file, type, program says if you want nodes to have color, and size you have to add that as an attribute
  22. Best practices is Attractiveness may depend on the type of visualization (static versus interactive) and the type of network (size and density) How people parse information
  23. Attractiveness may depend on the type of visualization (static versus interactive) and the type of network (size and density)
  24. Degree – how many other nodes are directly reached by this node? Betweenness – how likely is this node to be the direct route between two other nodes in the network? Closeness – how fast can this node reach every other node in the network? Eigenvector – how well is this node connected to other well-connected nodes?
  25. Network metrics This is a viz that shows degree and betweeness of Forrest and Abbie Degree – how many other nodes are directly reached by this node? Betweenness – how likely is this node to be the direct route between two other nodes in the network? Forrest has high degree and betweeness, so he is in middle of network (and example of how you might manually adjust viz to crate understanding, manually made his dot bigger) Abbi has low.
  26. Star Wars social networks: The Force Awakens http://evelinag.com/blog/2016/01-25-social-network-force-awakens/#.WIGLFMtMHqA “ The nodes in the network represent the individual characters, and they are connected by a link if they both speak within the same scene. The width of each link represents the frequency of co-occurrence of the two corresponding characters, and the size of each node represents the number of scenes where the character speaks.” Closeness – how fast can this node reach every other node in the network? Shows how many times characters have talked to each other (how fast you can reach 1 to the other) Eigenvector – how well is this node connected to other well-connected nodes? Rd-d2 has high eigenvector
  27. We will be using Google fusion tables to create a basic summary table and a chart. Network viz don’t just happens, stats are involved that determine how layout is going to be
  28. This is repulsion and attraction settings Alpha attraction Beta is repulsion As attraction increases, nodes get closer together As repulsion increases, nodes move further apart
  29. Decrease repulsion Very sparse networks may benefit from negative repulsion -low repulsion leads to more uniform and less clustered layouts, which may be attractive for static visualizations
  30. Often, this is the best layout for interactive visualizations Reduced repulsion here, if you wanted networks/clusters to be closer together
  31. Default values which usually work reasonably well for both static and interactive visualizations. Coauthor network This is a setting, what do you want your attraction and repulsion settings to be This is Default
  32. My LinkedIn network: Left – college, Right – librarians, Lower – UTA nursing faculty, dots – random people (running partner, best friend since HS, personal trainer)