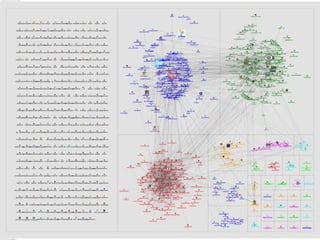
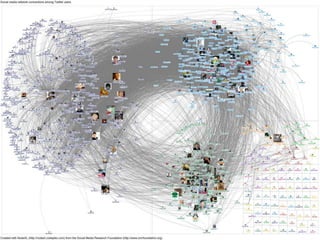
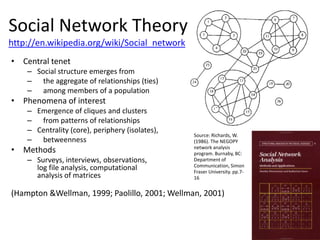
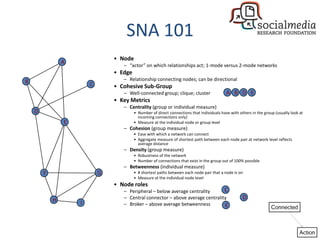
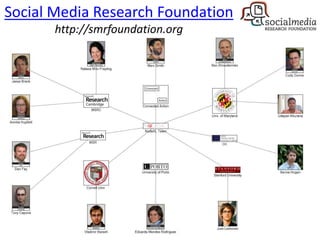
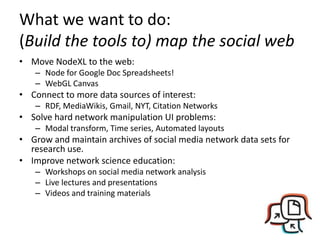
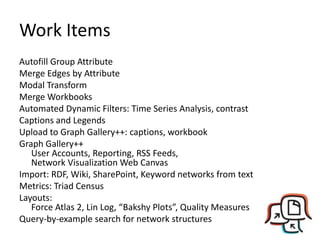
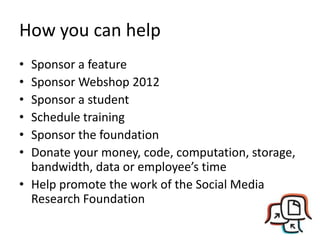
Slides for talk at ConTech 2011 the International Symposium on Convergence Technology (ConTech 2011) – Smart & Humane World – on November 3rd in Seoul, South Korea.
Date: 2011 November 3 (Thurs)
Place: COEX Grand Ballroom, Seoul, Korea
Organized by Advanced Institutes of Convergence Technologies (AICT), Seoul National University (SNU)
In Cooperation with Ministry of Knowledge Economy, Ministry of Education, Science and Technology, National Research Foundation of Korea, Graduate School of Convergence Science and Technology (GSCST)
2010 june - personal democracy forum - marc smith - mapping political socia...Marc Smith
Marc Smith's presentation to the Personal Democracy Forum 2010 in New York City on June 4th, 2010 about the use of NodeXL, a social media network analysis tool, to map political topics in services like Twitter.
NodeXL is available from http://nodexl.codeplex.com
2013 NodeXL Social Media Network AnalysisMarc Smith
Social media network analysis and visualization with NodeXL - the network overview discovery and exploration add-in for Excel. Map Twitter, Facebook, email, blogs, and the web with a point and click interface within the familiar spreadsheet.
An overview of the Network Overview Discovery and Exploration add-in for Excel 2007 (NodeXL), a social network analysis add-in for the familiar spreadsheet application. Visualize twitter, flickr, facebook, and email networks with just a few mouse clicks.
2009 - Node XL v.84+ - Social Media Network Visualization Tools For Excel 2007Marc Smith
Overview of the NodeXL project (Network Overview, Discovery and Exploration) that adds social network metrics and visualization features to Excel 2007. Contains updated images from version .84 of the NodeXL project.
UNIT II MODELING AND VISUALIZATION
Visualizing Online Social Networks - A Taxonomy of Visualizations - Graph Representation -
Centrality- Clustering - Node-Edge Diagrams - Visualizing Social Networks with Matrix-Based
Representations- Node-Link Diagrams - Hybrid Representations - Modelling and aggregating
social network data – Random Walks and their Applications –Use of Hadoop and Map Reduce -
Ontological representation of social individuals and relationships.
Network Visualization guest lecture at #DataVizQMSS at @Columbia / #SNA at PU...Denis Parra Santander
- First version was a guest lecture about Network Visualization in the class "Data Visualization" taught by Dr. Sharon Hsiao in the QMSS program at Columbia University http://www.columbia.edu/~ih2240/dataviz/index.htm
- This updated version was delivered in our class on SNA at PUC Chile in the MPGI master program.
2015 #MMeasure-Marc Smith-NodeXL Mapping social media using social network ma...Marc Smith
Networks are a powerful way to understand social media.
This talk reviews the ways the NodeXL application can be used to reveal the social media networks structures around topics.
2014 TheNextWeb-Mapping connections with NodeXLMarc Smith
Slides from a talk at the 2014 TheNextWeb in Amsterdam.
NodeXL social media network analysis of Twitter reveals six common structures in Twitter networks.
This is a presentation that describes at a high level some of the work we've been performing related to NodeXL and it's use to understand social media networks.
Social Network Analysis (SNA) and its implications for knowledge discovery in...ACMBangalore
Social Network Analysis (SNA) and its implications for knowledge discovery in Informal Networks- Talk by Dr Jai Ganesh, SETLabs, Infosys at Search and Social Platforms tutorial, as part of Compute 2009, ACM Bangalore
A high-level overview of social network analysis using gephi with your exported Facebook friends network. See more network analysis at http://allthingsgraphed.com.
New Metrics for New Media Bay Area CIO IT Executives MeetupTatyana Kanzaveli
Presentation done by Marc Smith, Chief Social Scientist, Telligent at the Bay Area CIO/IT Executives meetup http://www.meetup.com/CIO-IT-Executives/ run by Tatyana Kanzaveli.
1. Basics of Social Networks
2. Real-world problem
3. How to construct graph from real-world problem?
4. What graph theory problem getting from real-world problem?
5. Graph type of Social Networks
6. Special properties in social graph
7. How to find communities and groups in social networks? (Algorithms)
8. How to interpret graph solution back to real-world problem?
2009 - Connected Action - Marc Smith - Social Media Network AnalysisMarc Smith
Review of social media network analysis of Internet social spaces like twitter, flickr, email, message boards, etc. Network analysis and visualization of social media collections of connections.
Marc Smith - Charting Collections of Connections in Social Media: Creating Ma...Saratoga
An advocate for open tools, open data and open scholarships, Marc Smith strives for access to information to be available to all. Pioneering the possibilities through charting collections and creating maps with NodeXL.
Slides from talks presented at Mammoth BI in Cape Town on 17 November 2014.
Visit www.mammothbi.co.za for details on the event. Follow @MammothBI on twitter.
2010 Catalyst Conference - Trends in Social Network AnalysisMarc Smith
Review of trends related to social network analysis in the enterprise. Presented at the 2010 Catalyst Conference in San Diego, CA july 29, 2010. Presented with Mike Gotta, Gartner Group.
In social networks, where users send messages to each other, the issue of what triggers communication between unrelated users arises: does communication between previously unrelated users depend on friend-of-a-friend type of relationships, common interests, or other factors? In this work, we study the problem of predicting directed communication
intention between two users. Link prediction is similar to communication intention in that it uses network structure for prediction. However, these two problems exhibit fundamental
differences that originate from their focus. Link prediction uses evidence to predict network structure evolution, whereas our focal point is directed communication initiation between
users who are previously not structurally connected. To address this problem, we employ topological evidence in conjunction to transactional information in order to predict communication intention. It is not intuitive whether methods that work well for
link prediction would work well in this case. In fact, we show in this work that network or content evidence, when considered separately, are not sufficiently accurate predictors. Our novel approach, which jointly considers local structural properties of users in a social network, in conjunction with their generated content, captures numerous interactions, direct and indirect, social and contextual, which have up to date been considered independently. We performed an empirical study to evaluate our method using an extracted network of directed @-messages sent between users of a corporate microblogging service, which resembles Twitter. We find that our method outperforms state of the art techniques for link prediction. Our findings have implications for a wide range of social web applications, such as contextual expert recommendation for Q&A, new friendship relationships creation, and targeted content delivery.
Gephi is an open source software for graph and network analysis. It uses a 3D render engine to display large networks in real-time and to speed up the exploration. A flexible and multi-task architecture brings new pos- sibilities to work with complex data sets and produce valuable visual results. We present several key features of Gephi in the context of interactive exploration and interpretation of networks. It provides easy and broad access to network data and allows for spatializing, fil- tering, navigating, manipulating and clustering
How to use social media network analysis for amplificationMarc Smith
How can social media network analysis help you get your message out? Use network maps of social media to identify the most influential contributors based on their location within the network. Use content analysis to identify the topics, hashtags and URLs of greatest interest to the "mayors" of the hashtags that matter to you.
A network is a collection of connections. Learn how to express an edge in NodeXL. If you can make a pie chart, you can now make a network chart in NodeXL,
Think Link: Network Insights with No Programming SkillsMarc Smith
Networks are everywhere, but the tools for end users to access, analyze, visualize and share insights into connected structures have been absent. NodeXL, the network overview discovery and exploration add-in for Excel makes network analysis as easy as making a pie chart.
Course description for Optimice class on organizational network analysis (ONA) - the application of social network analysis (SNA) to business organizations.
20110830 Introducing the Social Media Research FoundationMarc Smith
Description of the activities and goals of the Social Media Research Foundation. The foundation is dedicated to Open Tools, Open Data, and Open Scholarship. See: http://www.smrfoundation.org.
One project from the Social Media Research Foundation is NodeXL, the network overview, discovery and exploration add-in for Excel 2007/2010. See: http://www.smrfoundation.org
20110128 connected action-node xl-sea of connectionsMarc Smith
Slides for the 28 January 2011 Presentation of "Finding direction in a sea of connection" at Hartnell College in Salinas, California, sponsored by the Community Foundation for Monterey County (CFMCO.org)
Encryption in Microsoft 365 - ExpertsLive Netherlands 2024Albert Hoitingh
In this session I delve into the encryption technology used in Microsoft 365 and Microsoft Purview. Including the concepts of Customer Key and Double Key Encryption.
Epistemic Interaction - tuning interfaces to provide information for AI supportAlan Dix
Paper presented at SYNERGY workshop at AVI 2024, Genoa, Italy. 3rd June 2024
https://alandix.com/academic/papers/synergy2024-epistemic/
As machine learning integrates deeper into human-computer interactions, the concept of epistemic interaction emerges, aiming to refine these interactions to enhance system adaptability. This approach encourages minor, intentional adjustments in user behaviour to enrich the data available for system learning. This paper introduces epistemic interaction within the context of human-system communication, illustrating how deliberate interaction design can improve system understanding and adaptation. Through concrete examples, we demonstrate the potential of epistemic interaction to significantly advance human-computer interaction by leveraging intuitive human communication strategies to inform system design and functionality, offering a novel pathway for enriching user-system engagements.
Smart TV Buyer Insights Survey 2024 by 91mobiles.pdf91mobiles
91mobiles recently conducted a Smart TV Buyer Insights Survey in which we asked over 3,000 respondents about the TV they own, aspects they look at on a new TV, and their TV buying preferences.
Securing your Kubernetes cluster_ a step-by-step guide to success !KatiaHIMEUR1
Today, after several years of existence, an extremely active community and an ultra-dynamic ecosystem, Kubernetes has established itself as the de facto standard in container orchestration. Thanks to a wide range of managed services, it has never been so easy to set up a ready-to-use Kubernetes cluster.
However, this ease of use means that the subject of security in Kubernetes is often left for later, or even neglected. This exposes companies to significant risks.
In this talk, I'll show you step-by-step how to secure your Kubernetes cluster for greater peace of mind and reliability.
Transcript: Selling digital books in 2024: Insights from industry leaders - T...BookNet Canada
The publishing industry has been selling digital audiobooks and ebooks for over a decade and has found its groove. What’s changed? What has stayed the same? Where do we go from here? Join a group of leading sales peers from across the industry for a conversation about the lessons learned since the popularization of digital books, best practices, digital book supply chain management, and more.
Link to video recording: https://bnctechforum.ca/sessions/selling-digital-books-in-2024-insights-from-industry-leaders/
Presented by BookNet Canada on May 28, 2024, with support from the Department of Canadian Heritage.
Elevating Tactical DDD Patterns Through Object CalisthenicsDorra BARTAGUIZ
After immersing yourself in the blue book and its red counterpart, attending DDD-focused conferences, and applying tactical patterns, you're left with a crucial question: How do I ensure my design is effective? Tactical patterns within Domain-Driven Design (DDD) serve as guiding principles for creating clear and manageable domain models. However, achieving success with these patterns requires additional guidance. Interestingly, we've observed that a set of constraints initially designed for training purposes remarkably aligns with effective pattern implementation, offering a more ‘mechanical’ approach. Let's explore together how Object Calisthenics can elevate the design of your tactical DDD patterns, offering concrete help for those venturing into DDD for the first time!
Slack (or Teams) Automation for Bonterra Impact Management (fka Social Soluti...Jeffrey Haguewood
Sidekick Solutions uses Bonterra Impact Management (fka Social Solutions Apricot) and automation solutions to integrate data for business workflows.
We believe integration and automation are essential to user experience and the promise of efficient work through technology. Automation is the critical ingredient to realizing that full vision. We develop integration products and services for Bonterra Case Management software to support the deployment of automations for a variety of use cases.
This video focuses on the notifications, alerts, and approval requests using Slack for Bonterra Impact Management. The solutions covered in this webinar can also be deployed for Microsoft Teams.
Interested in deploying notification automations for Bonterra Impact Management? Contact us at sales@sidekicksolutionsllc.com to discuss next steps.
LF Energy Webinar: Electrical Grid Modelling and Simulation Through PowSyBl -...DanBrown980551
Do you want to learn how to model and simulate an electrical network from scratch in under an hour?
Then welcome to this PowSyBl workshop, hosted by Rte, the French Transmission System Operator (TSO)!
During the webinar, you will discover the PowSyBl ecosystem as well as handle and study an electrical network through an interactive Python notebook.
PowSyBl is an open source project hosted by LF Energy, which offers a comprehensive set of features for electrical grid modelling and simulation. Among other advanced features, PowSyBl provides:
- A fully editable and extendable library for grid component modelling;
- Visualization tools to display your network;
- Grid simulation tools, such as power flows, security analyses (with or without remedial actions) and sensitivity analyses;
The framework is mostly written in Java, with a Python binding so that Python developers can access PowSyBl functionalities as well.
What you will learn during the webinar:
- For beginners: discover PowSyBl's functionalities through a quick general presentation and the notebook, without needing any expert coding skills;
- For advanced developers: master the skills to efficiently apply PowSyBl functionalities to your real-world scenarios.
Kubernetes & AI - Beauty and the Beast !?! @KCD Istanbul 2024Tobias Schneck
As AI technology is pushing into IT I was wondering myself, as an “infrastructure container kubernetes guy”, how get this fancy AI technology get managed from an infrastructure operational view? Is it possible to apply our lovely cloud native principals as well? What benefit’s both technologies could bring to each other?
Let me take this questions and provide you a short journey through existing deployment models and use cases for AI software. On practical examples, we discuss what cloud/on-premise strategy we may need for applying it to our own infrastructure to get it to work from an enterprise perspective. I want to give an overview about infrastructure requirements and technologies, what could be beneficial or limiting your AI use cases in an enterprise environment. An interactive Demo will give you some insides, what approaches I got already working for real.
Dev Dives: Train smarter, not harder – active learning and UiPath LLMs for do...UiPathCommunity
💥 Speed, accuracy, and scaling – discover the superpowers of GenAI in action with UiPath Document Understanding and Communications Mining™:
See how to accelerate model training and optimize model performance with active learning
Learn about the latest enhancements to out-of-the-box document processing – with little to no training required
Get an exclusive demo of the new family of UiPath LLMs – GenAI models specialized for processing different types of documents and messages
This is a hands-on session specifically designed for automation developers and AI enthusiasts seeking to enhance their knowledge in leveraging the latest intelligent document processing capabilities offered by UiPath.
Speakers:
👨🏫 Andras Palfi, Senior Product Manager, UiPath
👩🏫 Lenka Dulovicova, Product Program Manager, UiPath
Neuro-symbolic is not enough, we need neuro-*semantic*Frank van Harmelen
Neuro-symbolic (NeSy) AI is on the rise. However, simply machine learning on just any symbolic structure is not sufficient to really harvest the gains of NeSy. These will only be gained when the symbolic structures have an actual semantics. I give an operational definition of semantics as “predictable inference”.
All of this illustrated with link prediction over knowledge graphs, but the argument is general.
Neuro-symbolic is not enough, we need neuro-*semantic*
20111103 con tech2011-marc smith
1. Charting Collections of
Connections in Social
Media:
Creating Maps and
Measures with NodeXL
A project from the Social Media Research Foundation: http://www.smrfoundation.org
2. About Me
Introductions
Marc A. Smith
Chief Social Scientist
Connected Action Consulting Group
Marc@connectedaction.net
http://www.connectedaction.net
http://www.codeplex.com/nodexl
http://www.twitter.com/marc_smith
http://delicious.com/marc_smith/Paper
http://www.flickr.com/photos/marc_smith
http://www.facebook.com/marc.smith.sociologist
http://www.linkedin.com/in/marcasmith
http://www.slideshare.net/Marc_A_Smith
http://www.smrfoundation.org
5. There are many kinds of ties….
Like, Link, Reply, Rate, Review, Favorite, Friend, Follow, Edit, Tag, Comment…
http://www.flickr.com/photos/stevendepolo/3254238329
13. Social Network Theory
http://en.wikipedia.org/wiki/Social_network
• Central tenet
– Social structure emerges from
– the aggregate of relationships (ties)
– among members of a population
• Phenomena of interest
– Emergence of cliques and clusters
– from patterns of relationships
– Centrality (core), periphery (isolates),
Source: Richards, W.
– betweenness (1986). The NEGOPY
• Methods network analysis
program. Burnaby, BC:
– Surveys, interviews, observations, Department of
Communication, Simon
log file analysis, computational Fraser University. pp.7-
analysis of matrices 16
(Hampton &Wellman, 1999; Paolillo, 2001; Wellman, 2001)
14. SNA 101
• Node
A
– “actor” on which relationships act; 1-mode versus 2-mode networks
• Edge
B – Relationship connecting nodes; can be directional
C • Cohesive Sub-Group
– Well-connected group; clique; cluster A B D E
• Key Metrics
– Centrality (group or individual measure)
D • Number of direct connections that individuals have with others in the group (usually look at
incoming connections only)
E • Measure at the individual node or group level
– Cohesion (group measure)
• Ease with which a network can connect
• Aggregate measure of shortest path between each node pair at network level reflects
average distance
– Density (group measure)
• Robustness of the network
• Number of connections that exist in the group out of 100% possible
– Betweenness (individual measure)
F G • # shortest paths between each node pair that a node is on
• Measure at the individual node level
• Node roles
– Peripheral – below average centrality C
H – Central connector – above average centrality D
I – Broker – above average betweenness E
17. Welser, Howard T., Eric Gleave, Danyel Fisher,
and Marc Smith. 2007. Visualizing the Signatures
of Social Roles in Online Discussion Groups.
The Journal of Social Structure. 8(2).
Experts and “Answer People” Discussion people, Topic setters
Discussion starters, Topic setters
23. Goal: Make SNA easier
• Existing Social Network Tools are challenging
for many novice users
• Tools like Excel are widely used
• Leveraging a spreadsheet as a host for SNA
lowers barriers to network data analysis and
display
24. Who we are
People Disciplines Institutions
University Computer Science University of Maryland
Faculty
Students HCI, CSCW Oxford Internet Institute
Industry Machine Learning Stanford University
Independent Information Visualization Microsoft Research
Researchers UI/UX Illinois Institute of
Technology
Developers Social Science/Sociology Connected Action
Network Analysis Cornell
Collective Action Morningside Analytics
26. What we are trying to do:
Open Tools, Open Data, Open Scholarship
• Build the “Firefox of GraphML” – open tools for
collecting and visualizing social media data
• Connect users to network analysis – make
network charts as easy as making a pie chart
• Connect researchers to social media data sources
• Archive: Be the “Allen Very Large Telescope Array”
for Social Media data – coordinate and aggregate
the results of many user’s data collection and
analysis
• Create open access research papers & findings
• Make “collections of connections” easy for users
to manage
27. What we have done: Open Tools
• NodeXL
• Data providers (“spigots”)
– ThreadMill Message Board
– Exchange Enterprise Email
– Voson Hyperlink
– SharePoint
– Facebook
– Twitter
– YouTube
– Flickr
28. What we have done: Open Data
• NodeXLGraphGallery.org
– User generated collection
of network graphs,
datasets and annotations
– Collective repository for
the research community
– Published collections of
data from a range of social
media data sources to help
students and researchers
connect with data of
interest and relevance
42. What we want to do:
(Build the tools to) map the social web
• Move NodeXL to the web:
– Node for Google Doc Spreadsheets!
– WebGL Canvas
• Connect to more data sources of interest:
– RDF, MediaWikis, Gmail, NYT, Citation Networks
• Solve hard network manipulation UI problems:
– Modal transform, Time series, Automated layouts
• Grow and maintain archives of social media network data sets for
research use.
• Improve network science education:
– Workshops on social media network analysis
– Live lectures and presentations
– Videos and training materials
43. Work Items
Autofill Group Attribute
Merge Edges by Attribute
Modal Transform
Merge Workbooks
Automated Dynamic Filters: Time Series Analysis, contrast
Captions and Legends
Upload to Graph Gallery++: captions, workbook
Graph Gallery++
User Accounts, Reporting, RSS Feeds,
Network Visualization Web Canvas
Import: RDF, Wiki, SharePoint, Keyword networks from text
Metrics: Triad Census
Layouts:
Force Atlas 2, Lin Log, “Bakshy Plots”, Quality Measures
Query-by-example search for network structures
44. How you can help
• Sponsor a feature
• Sponsor Webshop 2012
• Sponsor a student
• Schedule training
• Sponsor the foundation
• Donate your money, code, computation, storage,
bandwidth, data or employee’s time
• Help promote the work of the Social Media
Research Foundation
45. Contact:
Marc A. Smith
Chief Social Scientist
Connected Action Consulting Group
Marc@connectedaction.net
http://www.connectedaction.net
http://www.codeplex.com/nodexl
http://www.twitter.com/marc_smith
http://delicious.com/marc_smith/Paper
http://www.flickr.com/photos/marc_smith
http://www.facebook.com/marc.smith.sociologist
http://www.linkedin.com/in/marcasmith
http://www.slideshare.net/Marc_A_Smith
http://www.smrfoundation.org
46. Charting Collections of
Connections in Social
Media:
Creating Maps and
Measures with NodeXL
A project from the Social Media Research Foundation: http://www.smrfoundation.org