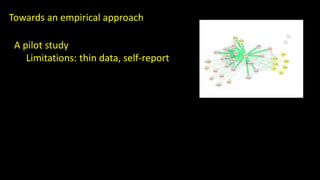
Download to read offline

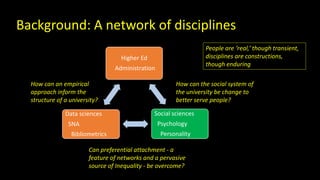
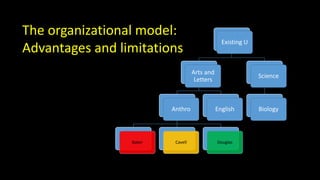
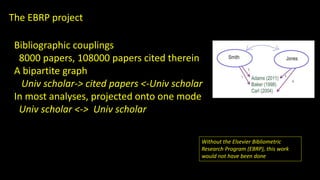
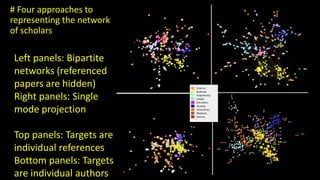
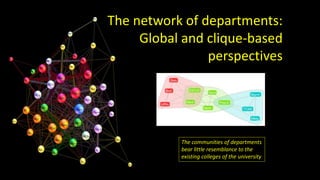
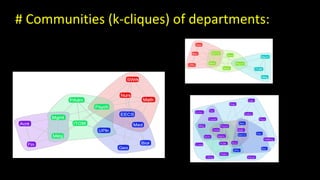
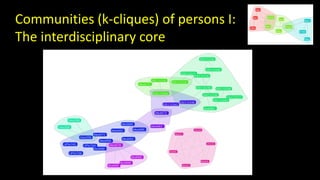
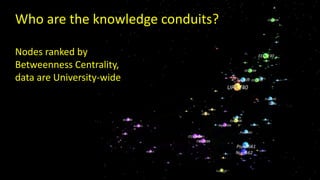
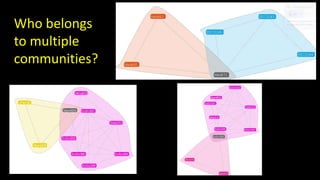
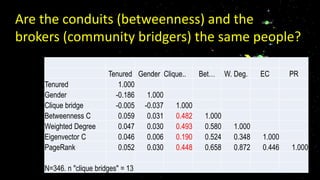

This document summarizes a presentation on using bibliographic couplings to analyze the structure of a large public university. The presentation analyzed co-citation networks between university scholars and the papers they cited to identify overlapping intellectual communities across disciplines. It identified key individuals who bridge communities and act as knowledge conduits. The analysis found that the network of engaged scholars bears little resemblance to the existing academic units, suggesting opportunities to restructure the university to better support interdisciplinary work.


![Polymer [ बहुलक ] Chemistry Notes PDF - Irfanullah Mehar - JJ Sir Chemistry.pdf](https://cdn.slidesharecdn.com/ss_thumbnails/polymerchemistrynotespdf-irfanullahmehar-jjsirchemistry-260210172118-3f9b37f7-thumbnail.jpg?width=640&height=640&fit=bounds)


