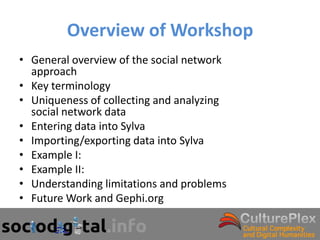
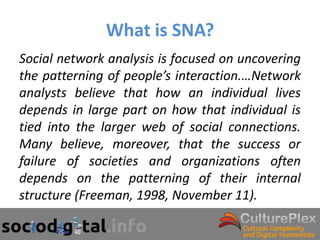
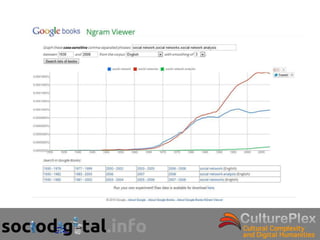
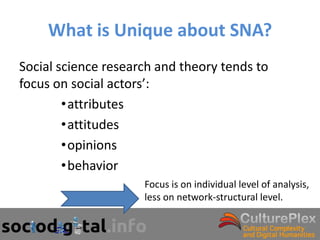
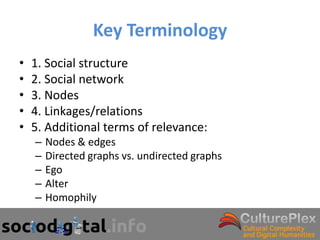
This document provides an overview of social network analysis and the Sylva software. It begins with key concepts in social network analysis including social structure, social networks, nodes, linkages, and additional terminology. It then discusses what makes social network analysis unique and provides examples of ego-centered and community-centered network analysis. Finally, it describes the features and capabilities of the Sylva software for collecting, storing, visualizing, and analyzing social network data.


![Sustaining a Global Community
• Henrich et al. [1] have proven that the existence of norms that
sustain fairness in exchanges among strangers are connected with
the diffusion of institutions such as market integration and the
participation in world religions.
• Their research confirms the hypothesis that modern world religion
may have contributed to the sustainability of large- scale societies
and large-scale interactions and we propose that art is another
institution that contributes to the arising and sustainability of large-
scale societies.
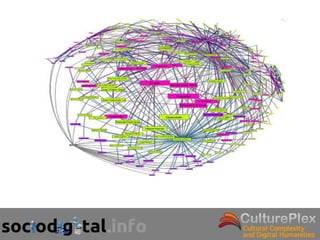
• We use the case of the formation of an artistic network of
paintings, schools, themes, genres, and artists whose development
goes along with the expansion and colonization of the Hispanic
Monarchy across America to show that this artistic network has a
presence in all political territories encompassing most ethnicities
and religions of indigenous origin.](https://image.slidesharecdn.com/sylvaworkshop-gtthatcamp-2012-120504183042-phpapp02/85/Sylva-workshop-gt-that-camp-2012-55-320.jpg)
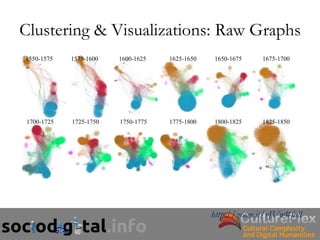
![Methodology
• The data set comprising the paintings from the Baroque period are
organized and stored in a PostgreSQL web based database.
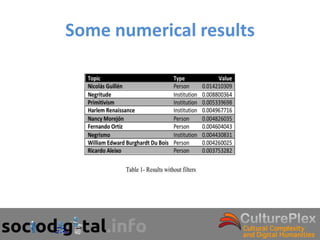
• The data includes more than 100,000 total topics (11,443 of them
are artworks). A distinctive feature of the information is that it is
organized around both text fields and ad-hoc descriptors that follow
the model of a formal ontology.
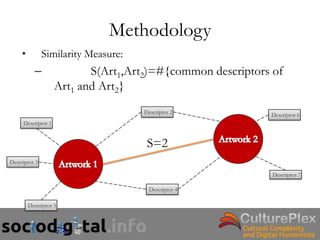
• For our study we have decided to model the data in one of the
possible networks, a network created from common descriptors as
weighted edges and artworks as nodes.
• Some pruning methods had to be applied in order to overcome
some of the shortcomings resulting from the millions of edges and
the too many relational joins. We also split the dataset in 12
sections, each covering a 25 year-period, from 1550 to 1850 [4].](https://image.slidesharecdn.com/sylvaworkshop-gtthatcamp-2012-120504183042-phpapp02/85/Sylva-workshop-gt-that-camp-2012-56-320.jpg)


![Social Network Analysis [1994]](https://cdn.slidesharecdn.com/ss_thumbnails/socialnetworkanalysis1994-160617072245-thumbnail.jpg?width=640&height=640&fit=bounds)


